Description of NetCDF data files
The weekly analysis grids are given in standardized binary data format (Network common data form: NetCDF v4). The variables are given as grid arrays, see therefore Table 1. All grids are projected onto the 25 km EASE2 Grid, which is based on a polar aspect spherical Lambert azimuthal equal-area projection (Figure 1). NetCDF files are formatted according to CF conventions: CF-1.6 ACDD-1.3.
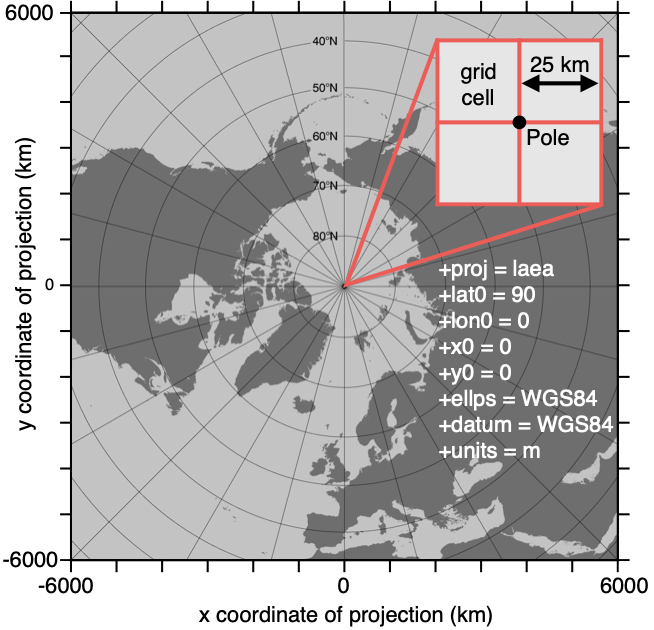
Figure 1: Specifications of the EASE2 25 km grid, which is used for the merged product.
Table 1: NETCDF file content.
Variable | Description | Unit | Type | Dimension |
|---|---|---|---|---|
Lambert_Azimuthal_Grid | - | - | int | - |
time_bnds | - | seconds since 1978-01-01 00:00:00 | int | 2 |
analysis_ice_thickness | CS2SMOS merged sea ice thickness | m | Int | 1,432,432 |
background_ice_thickness | optimal interpolation background field | m | Int | 1,432,432 |
weighted_mean_ice_thickness | weighted mean of weekly cs2 and smos ice thickness retrievals | m | Int | 1,432,432 |
innovation | difference between background and analysis ice thickness | m | Int | 1,432,432 |
ice_conc | sea ice concentration | % | Int | 1,432,432 |
ice_type | sea ice type | - | Int | 1,432,432 |
correlation_length_scale | correlation length scale of sea ice thickness | m | Int | 1,432,432 |
analysis_thickness_unc | uncertainty of the merged sea ice thickness | m | Int | 1,432,432 |
smos_ice_thickness | weekly averaged SMOS ice thickness | m | Int | 1,432,432 |
cs2_ice_thickness | weekly averaged CryoSat-2 ice thickness | m | Int | 1,432,432 |
time | reference time of product | seconds since 1978-01-01 00:00:00 | Int | 1 |
xc | x coordinate of projection (eastings) | km | Int | 432 |
yc | y coordinate of projection (northings) | km | Int | 432 |
lon | longitude coordinate | degrees_north | Int | 432,432 |
lat | latitude coordinate | degrees_east | int | 432,432 |