One useful method to evaluate sea ice thickness information from remote sensing and numerical models is to compare monthly anomalies. This parameter is defined as the difference of one particular month to the mean monthly thickness fields of other month in the data record. Monthly anomalies are therefore sensitive to processes that cause sea ice thickness changes and can be compared to other sources which may have a systematic thickness bias to the reference thickness field.
One of these comparisons is regularly carried by the Polar Science Center (PSC) of the Applied Physics Laboratory at the University of Washington. The PSC operates the Pan-Arctic Ice Ocean Modeling and Assimilation System (PIOMAS) that provides near-real time updates of Arctic sea ice thickness and volume.
The following two figures show monthly thickness anomalies for PIOMAS and CryoSat-2 (cs2awi v2.0 NRT) for March 2018 with mean conditions from the time frame of the CryoSat-2 data record (2011-2017).
PIOMAS Scientific Reference:
Schweiger, A., R. Lindsay, J. Zhang, M. Steele, H. Stern, Uncertainty in modeled arctic sea ice volume, J. Geophys. Res., doi:10.1029/2011JC007084, 2011
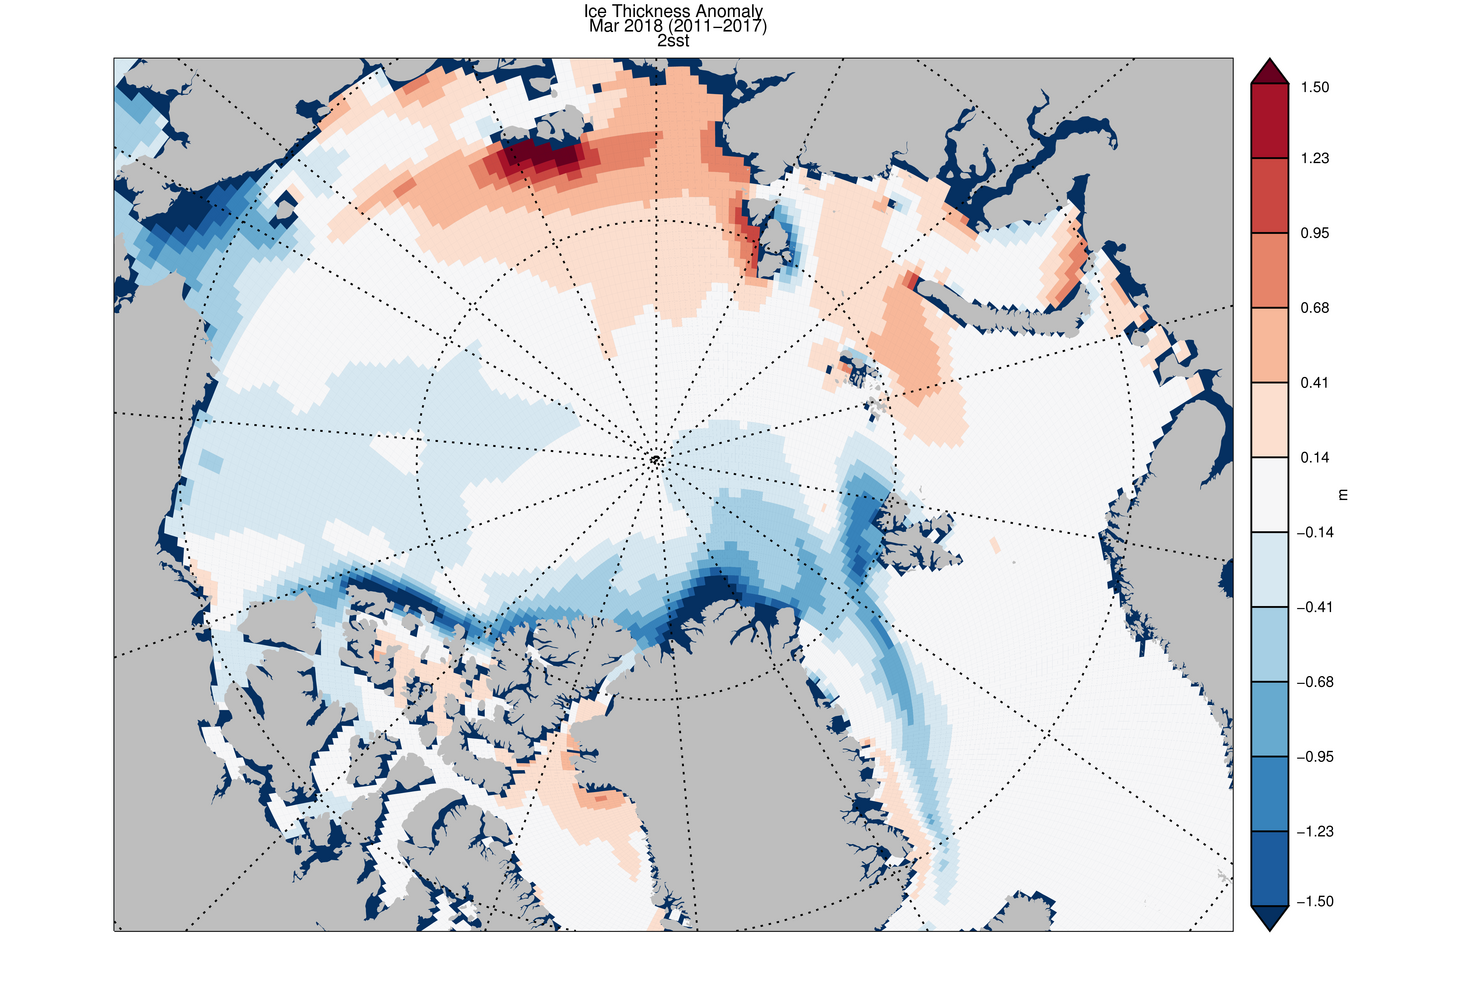
PIOMAS March 2018 sea ice thickness anomaly
(credit: Axel Schweiger, Polar Science Center, Source)
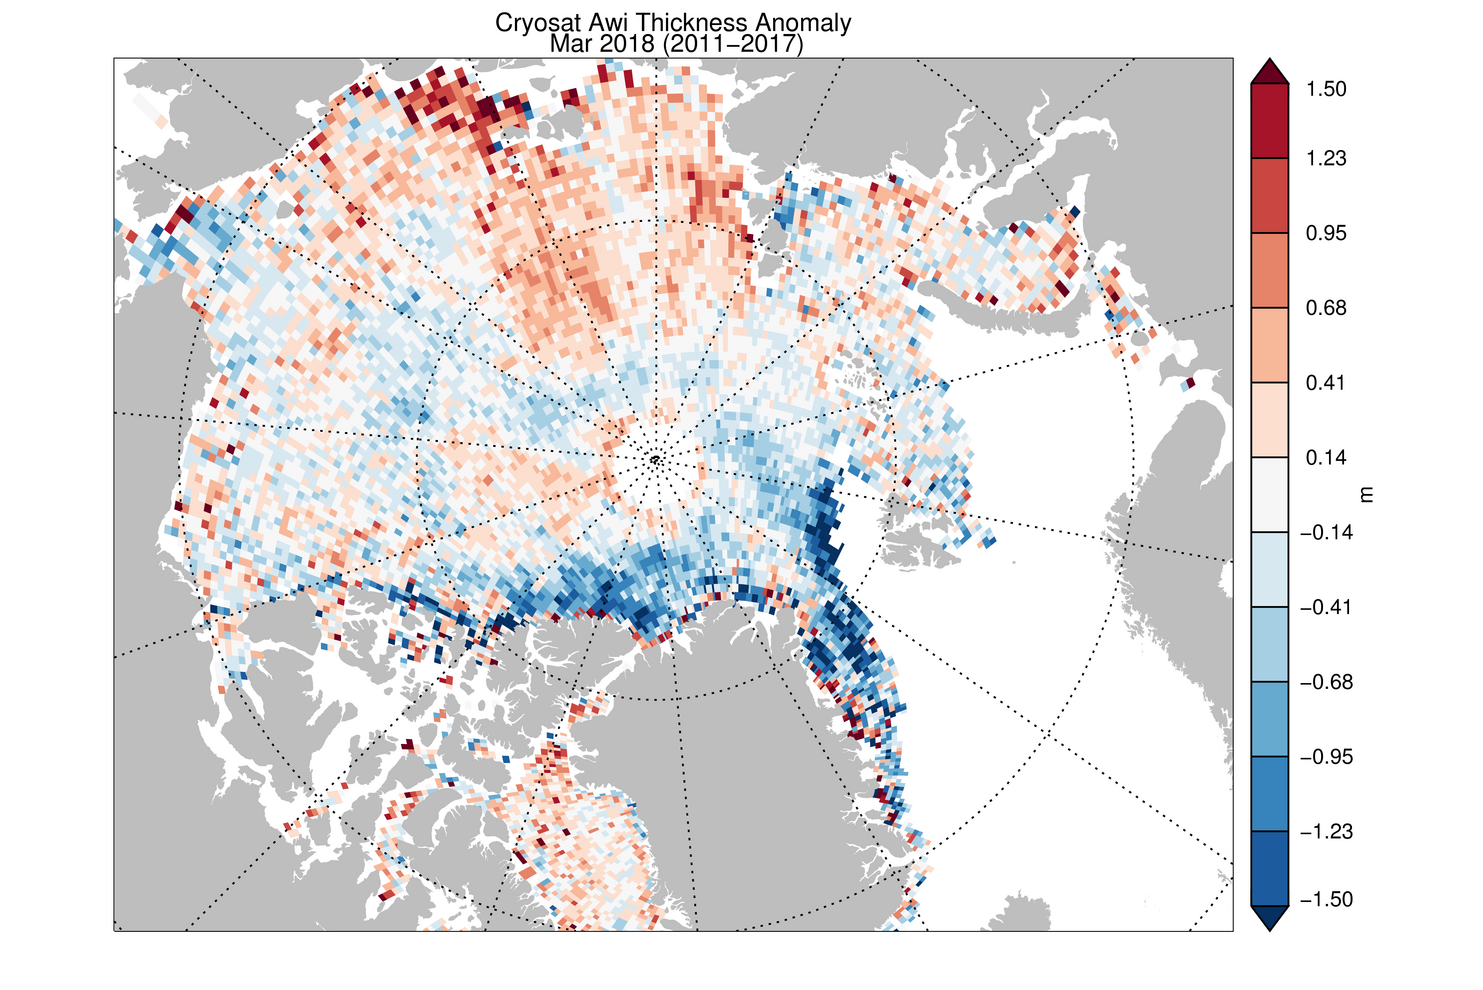
CryoSat-2 March 2018 sea ice thickness anomaly projected to PIOMAS grid
(credit: Axel Schweiger, Polar Science Center, Source)
The regional patterns in the March 2018 thickness anomalies are widely consistent with
- distinct positive thickness anomaly in the Russion Sector and Baffin Bay
- distinct negative thickness anomaly north of Greenland and the Canadian Archipelago as well as Fram Strait
The agreement is less close to the north pole where CryoSat-2 indicates a minor positive thickness anomaly that is not visible in the PIOMAS data. The previous CryoSat-2 monthly anomalies (below) of the winter season of 2017/18 indicate that this particular positive anomaly persisted and has been more pronounced in the previous month. However, a detailed drift analysis is necessary to track the sea ice region to origin in the previous year for a more detailed analysis.
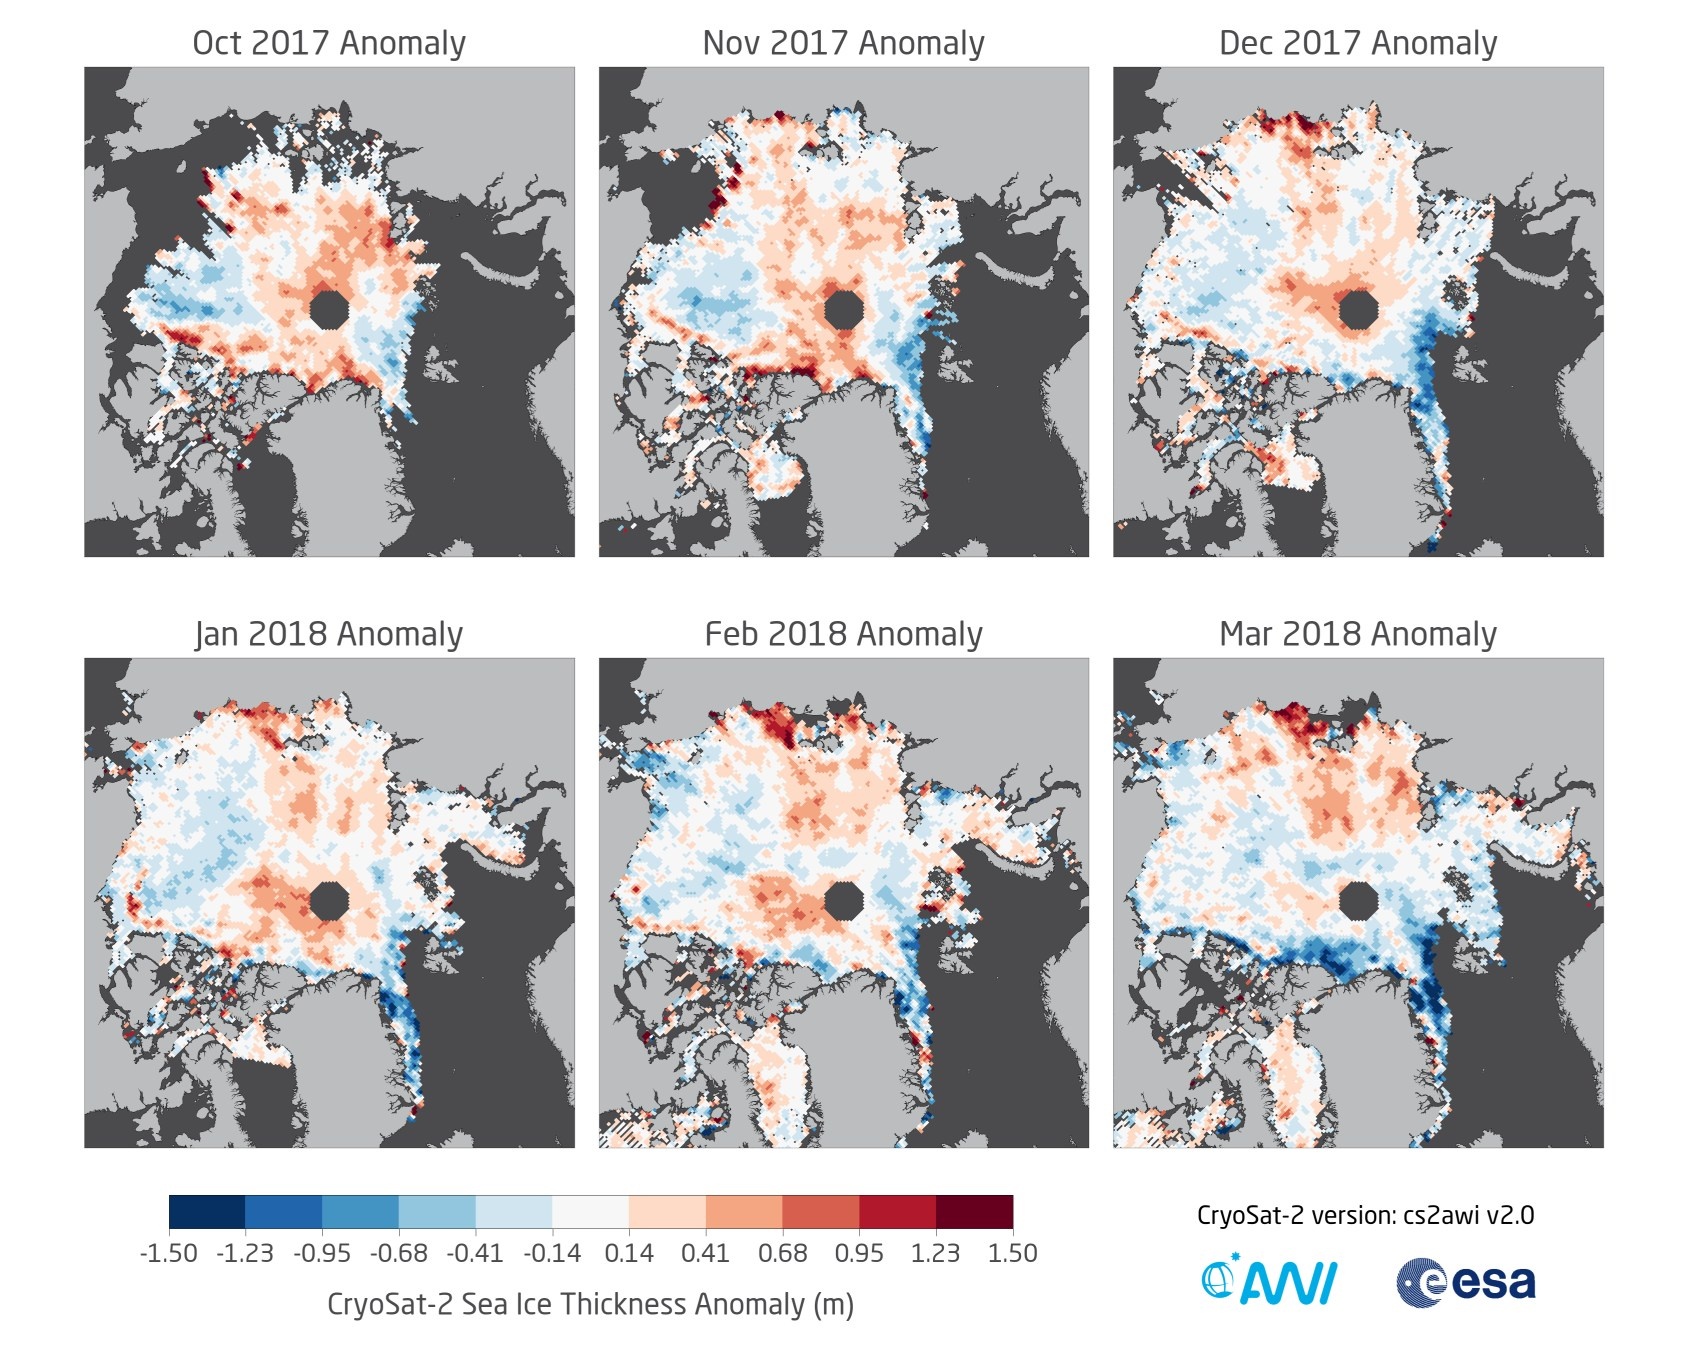
Monthly CryoSat-2 thickness anomalies for winter season 2017/2018 (March 2018: NRT data)