The production of the sea ice thickness climate data record of the ESA Climate Change Initiative (CCI) has been finalized. The files are currently being registered with their respective doi's and official dissimination will commence shortly.
The CCI sea ice thickness climate data record is based on 15 year of satellite radar altimeter data from Envisat and CryoSat-2 data and provides daily trajectory (l2p) and monthly gridded (l3c) observations between 2002 and 2017 in netCDF format. For the first time, the radar altimeter data record has been extended to the southern hemisphere with year-around freeboard and thickness retrieval which is possible due to the absence of melt ponds. The version of the product is v2.0 to indicate that this is the outcome of the second phase of the CCI project.
The dataset allows the investigation of sea ice thickness time series within the Envisat below a latitude of 81.45 degrees. Only with the onset of CryoSat-2 data availability, sea ice thickness observations are available in the high latitude (< 88N) of the central Arctic Ocean. In the Antarctic however, the Envisat type orbit is sufficient to cover the full sea ice cover which allows the analysis of true sea ice volume.
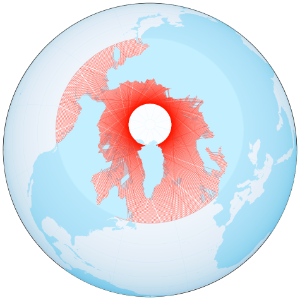
CryoSat-2 Northern hemisphere orbit coverage
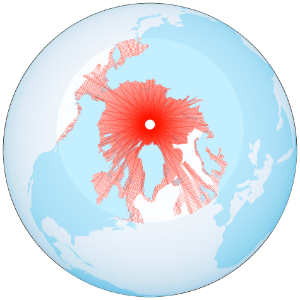
Envisat Northern hemisphere orbit coverage
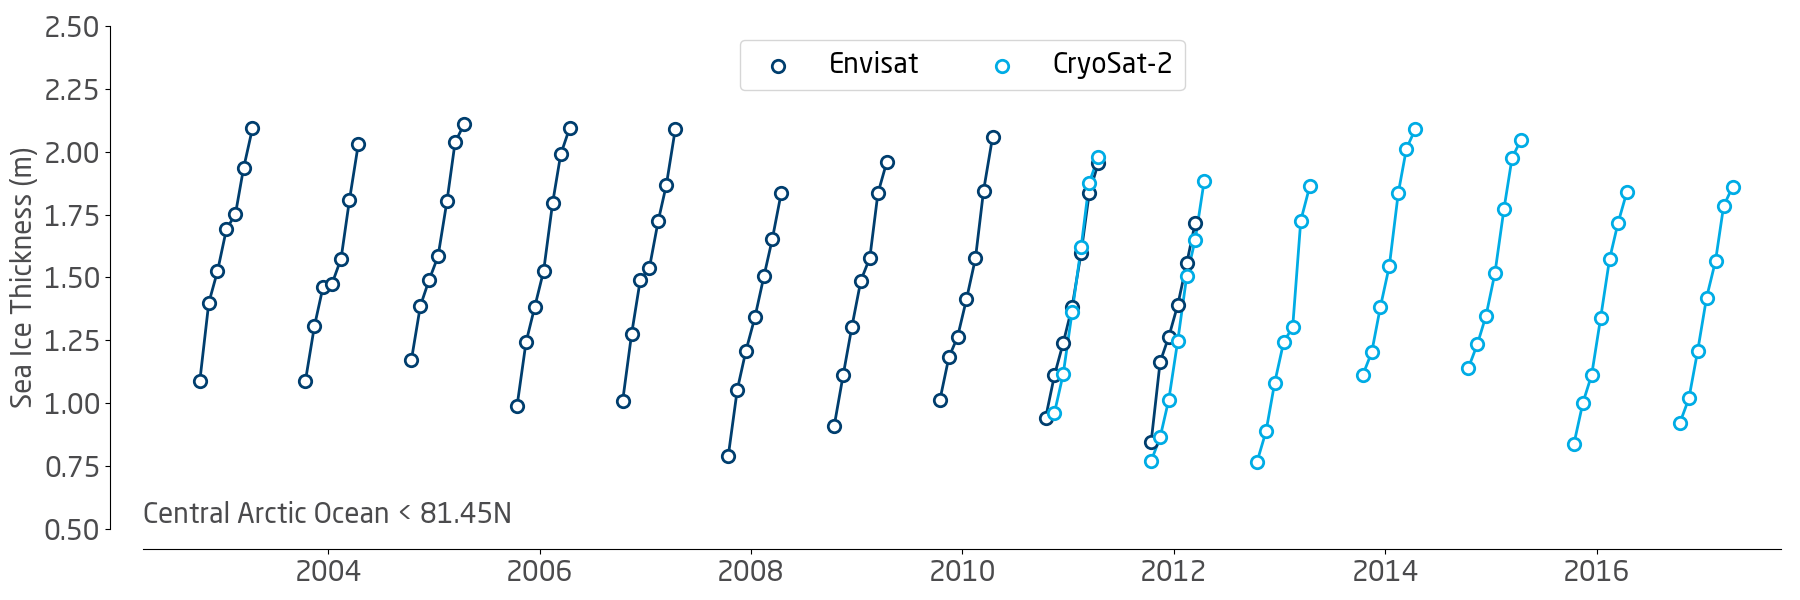
Mean monthly Arctic basin sea ice thickness in the winter month between October and April (within the Envisat orbit: < 81.45N)
CryoSat-2 Northern hemisphere orbit coverage
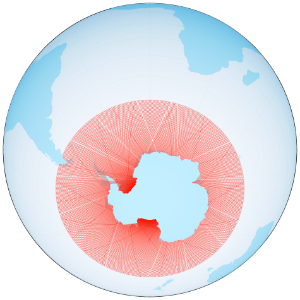
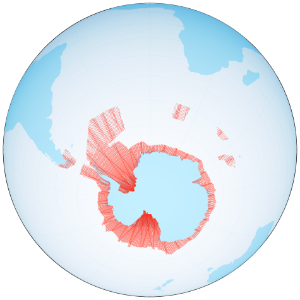
Envisat Southern hemisphere orbit coverage
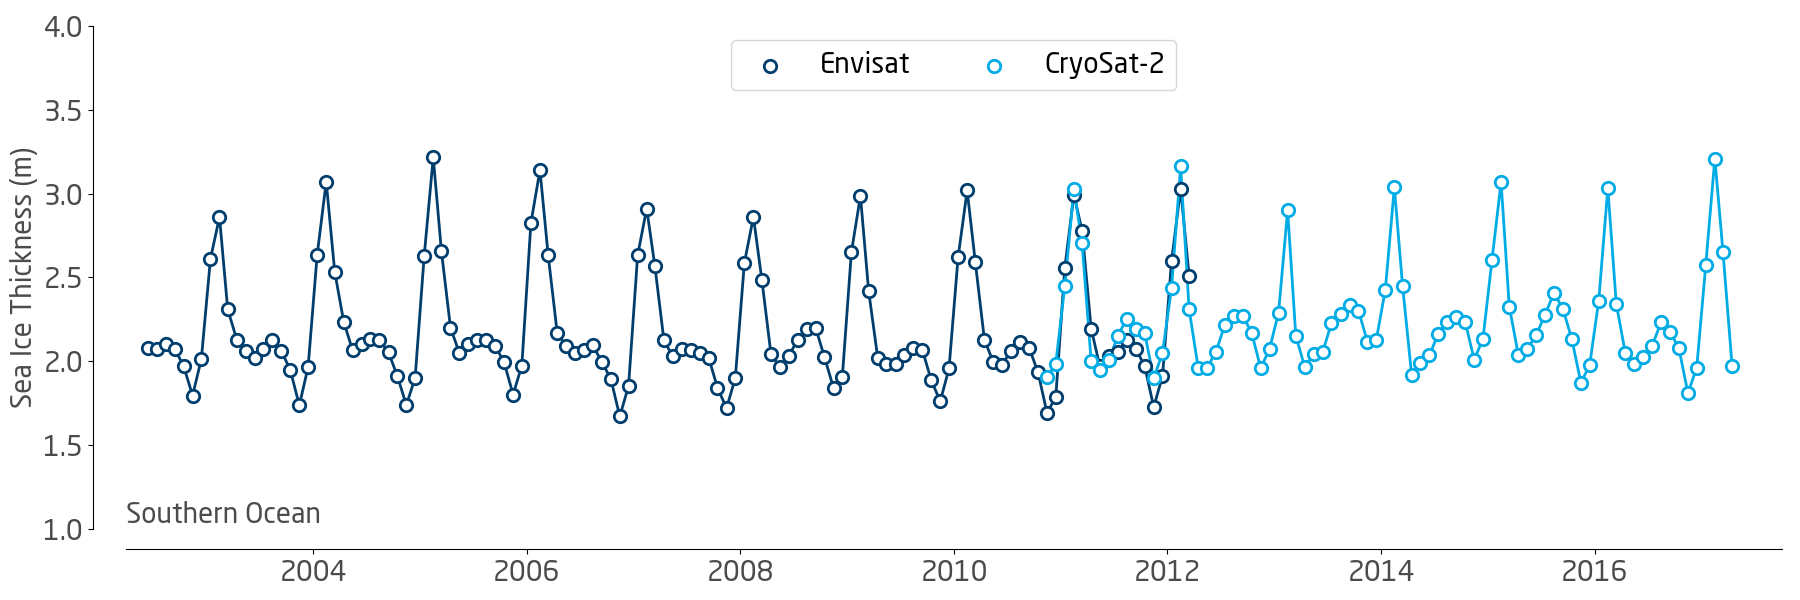
Mean monthly Antarctic-wide sea ice thickness of the experimental climate data record for the southern hemisphere
Data sets of the CCI sea ice thickness climate data record
The climate record contains the all days/month for both satellites and hemispheres. Both satellites have an overlap period between November 2010 and March 2012 which can be used to study the different performance of the two radar altimeter generations for sea ice thickness retrieval.
A description of the datasets and a graphical coverage report of the daily l2p trajectory data is given below.
| Dataset | Product Level | Begin | End | Coverage |
|---|---|---|---|---|
Northern Hemisphere Sea Ice Thickness from the CryoSat-2 satellite, v2.0 | L2P (Daily) | 2010-11-01 | 2017-04-30 | October through April |
| Northern Hemisphere Sea Ice Thickness from the CryoSat-2 satellite, v2.0 | L3C (Monthly) | 2010-11-01 | 2017-04-30 | October through April |
| Southern Hemisphere Sea Ice Thickness from the CryoSat-2 satellite, v2.0 | L2P (Daily) | 2010-11-01 | 2017-04-30 | Year-around |
| Southern Hemisphere Sea Ice Thickness from the CryoSat-2 satellite, v2.0 | L3C (Monthly) | 2010-11-01 | 2017-04-30 | Year-around |
| Northern Hemisphere Sea Ice Thickness from the Envisat satellite, v2.0 | L2P (Daily) | 2002-10-01 | 2012-03-31 | October through April |
| Northern Hemisphere Sea Ice Thickness from the Envisat satellite, v2.0 | L3C (Monthly) | 2002-10-01 | 2012-03-31 | October through April |
| Southern Hemisphere Sea Ice Thickness from the Envisat satellite, v2.0 | L2P (Daily) | 2002-06-01 | 2012-03-31 | Year-around |
| Southern Hemisphere Sea Ice Thickness from the Envisat satellite, v2.0 | L3C (Monthly) | 2002-06-01 | 2012-03-31 | Year-around |
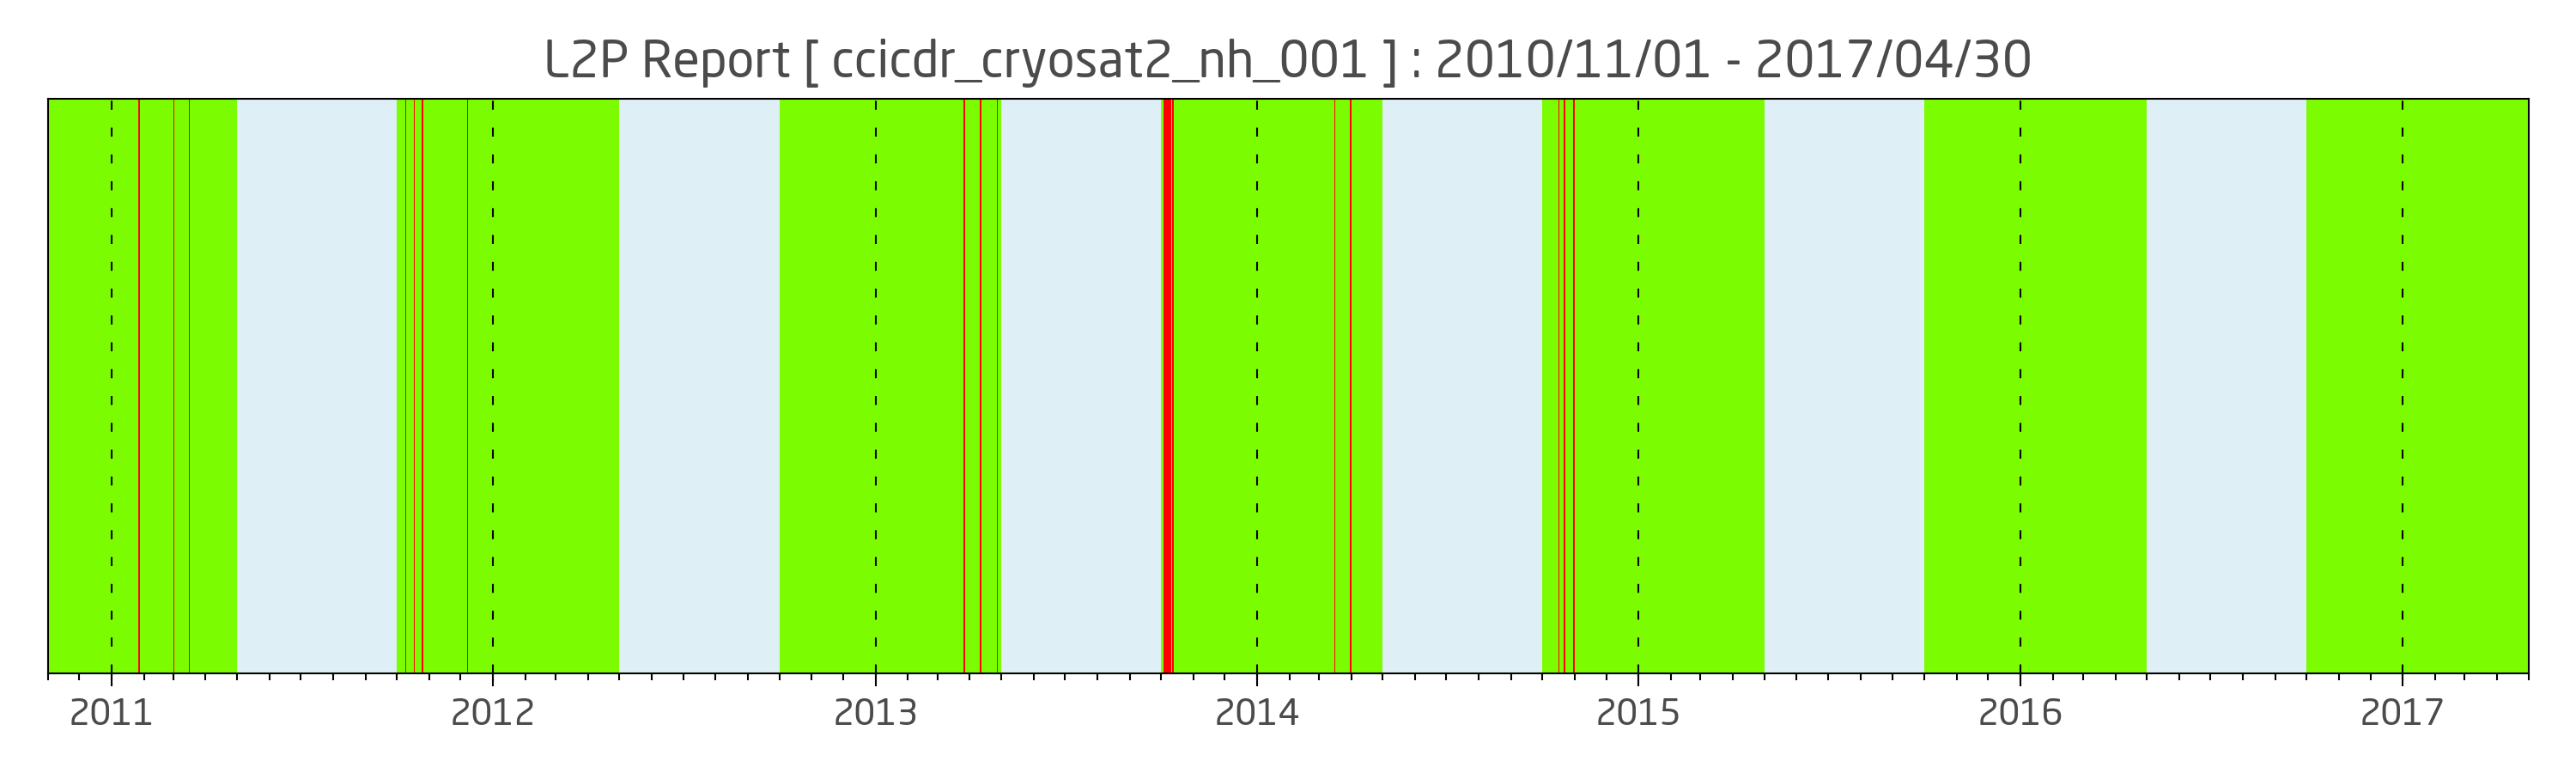
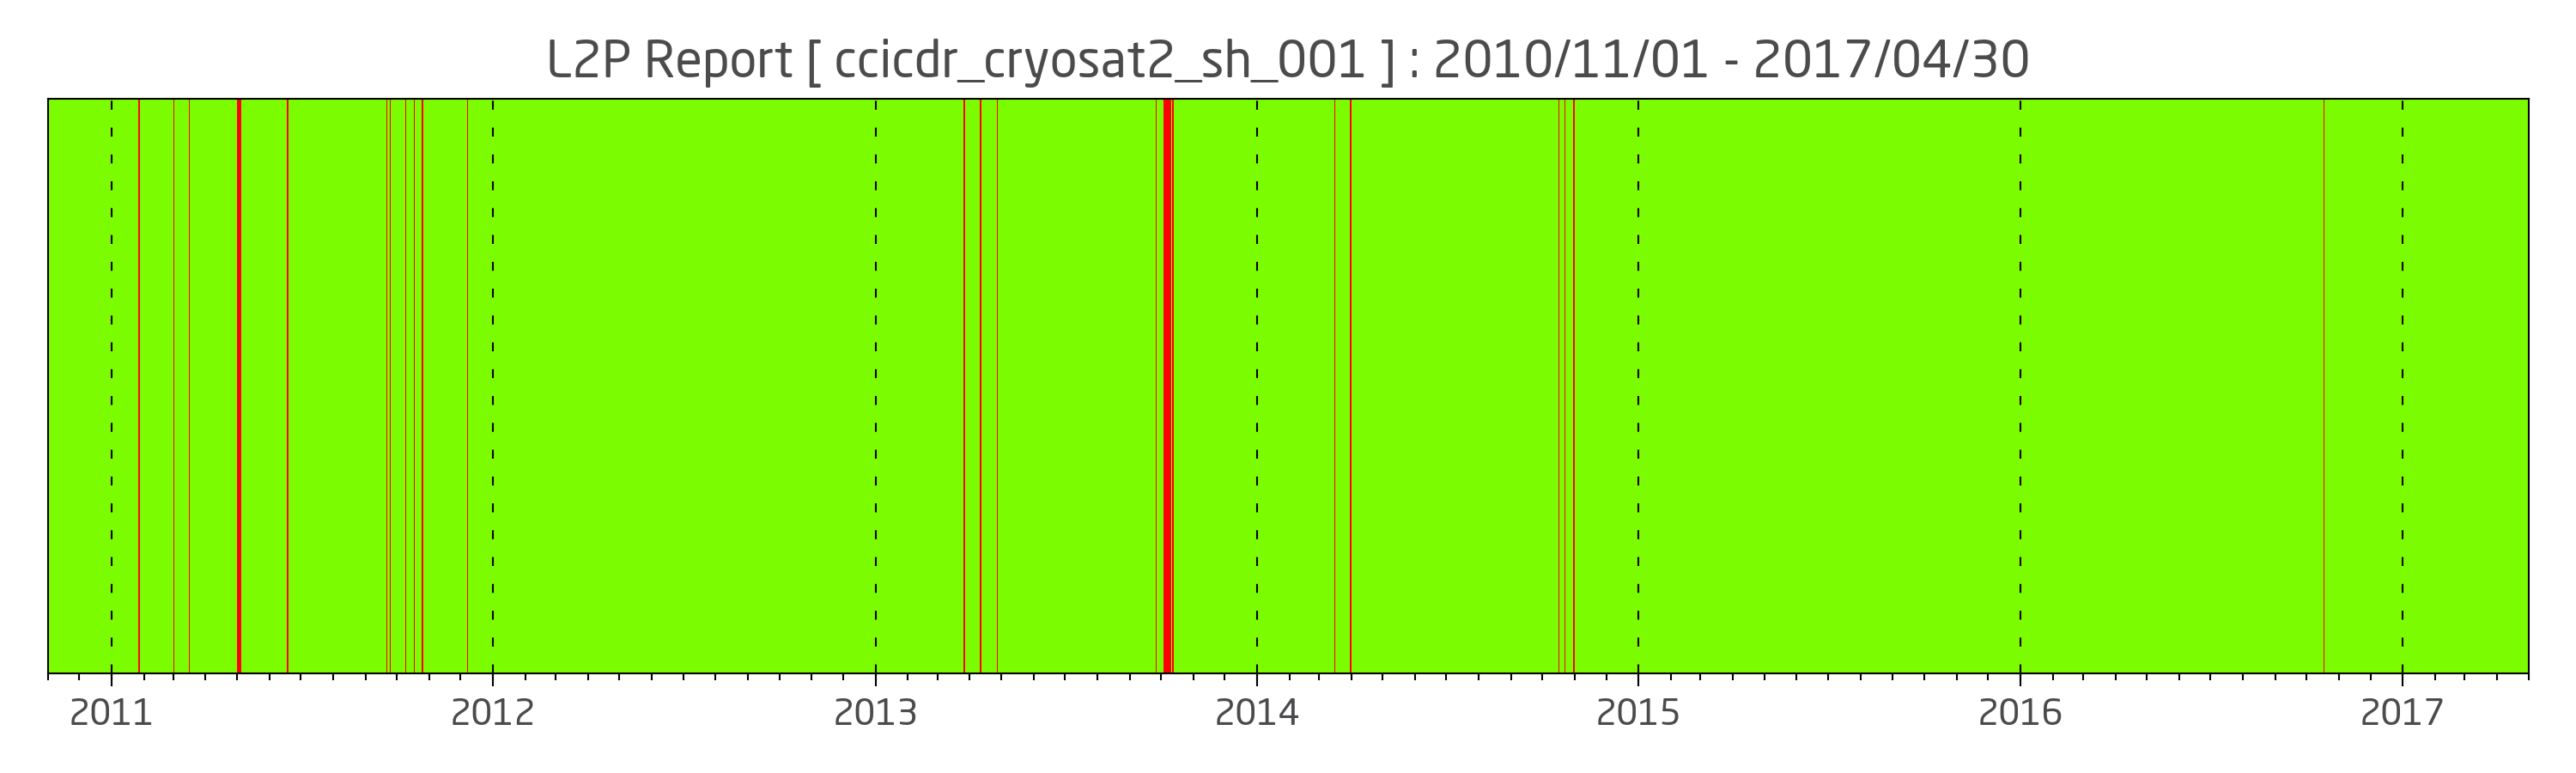
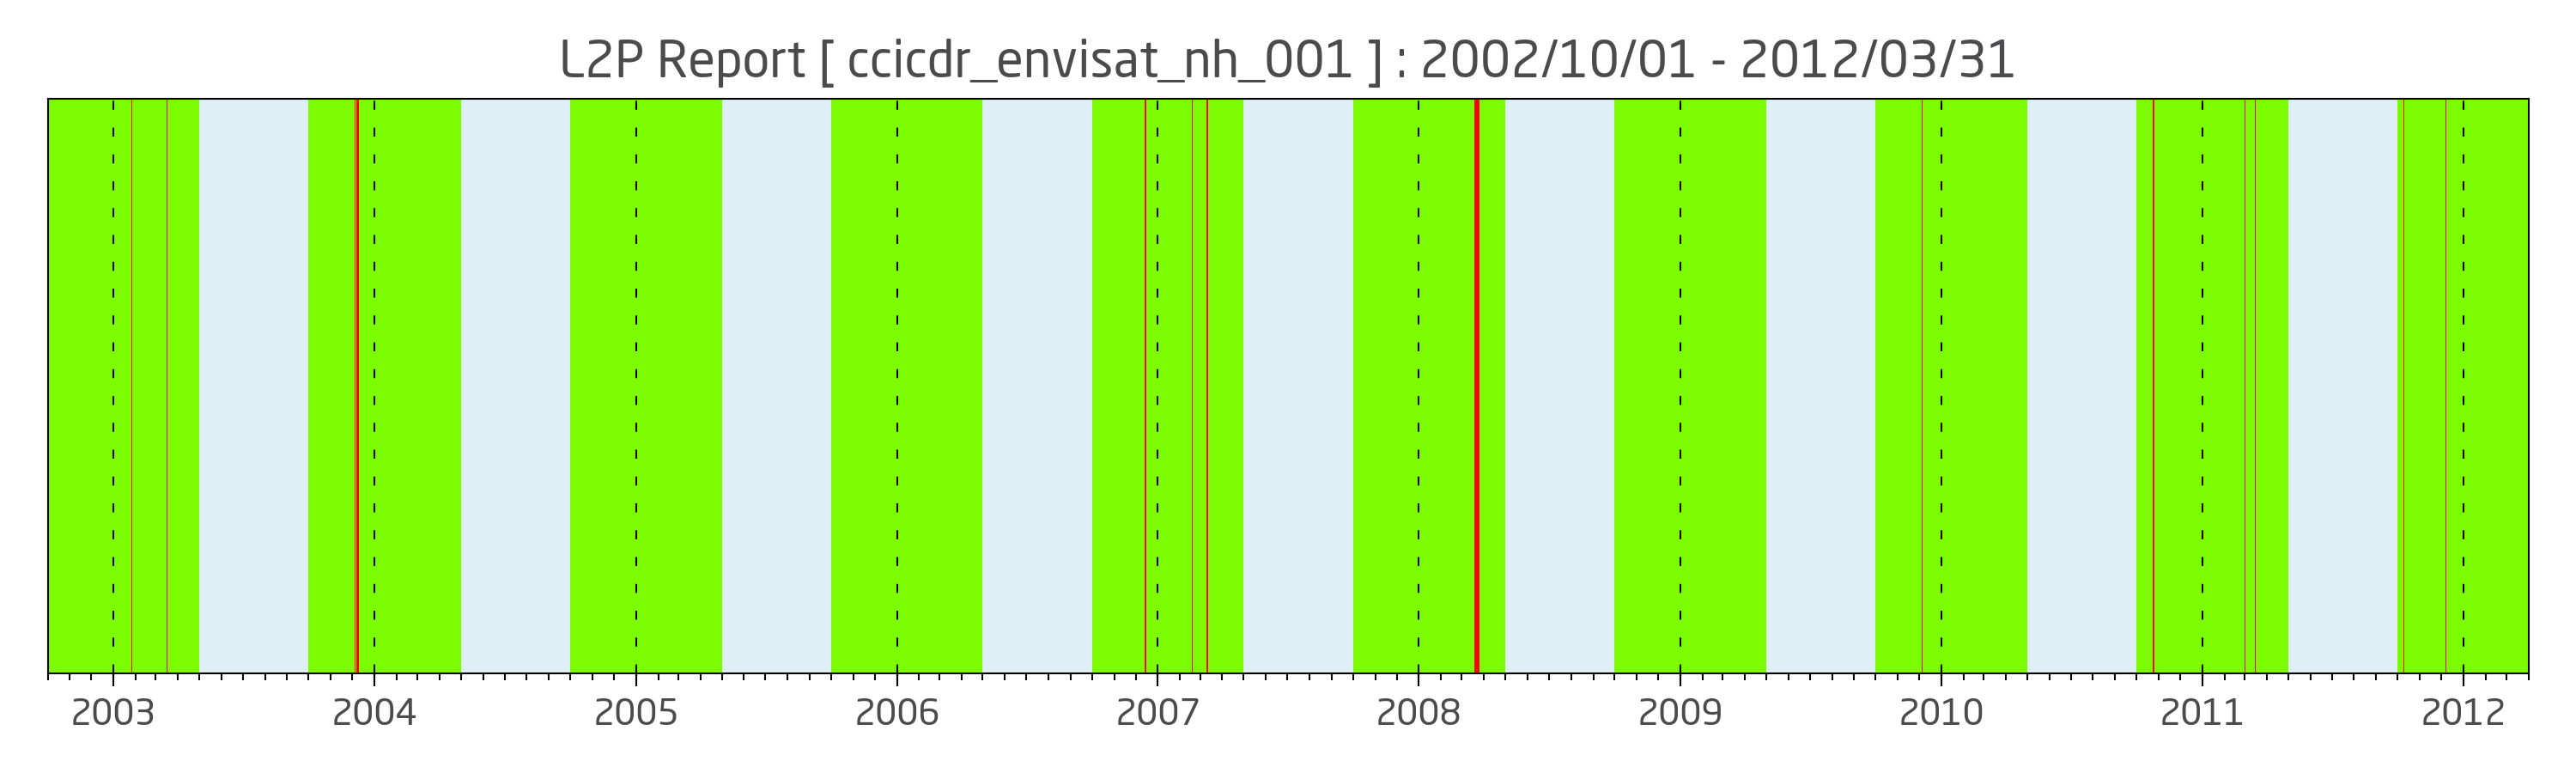
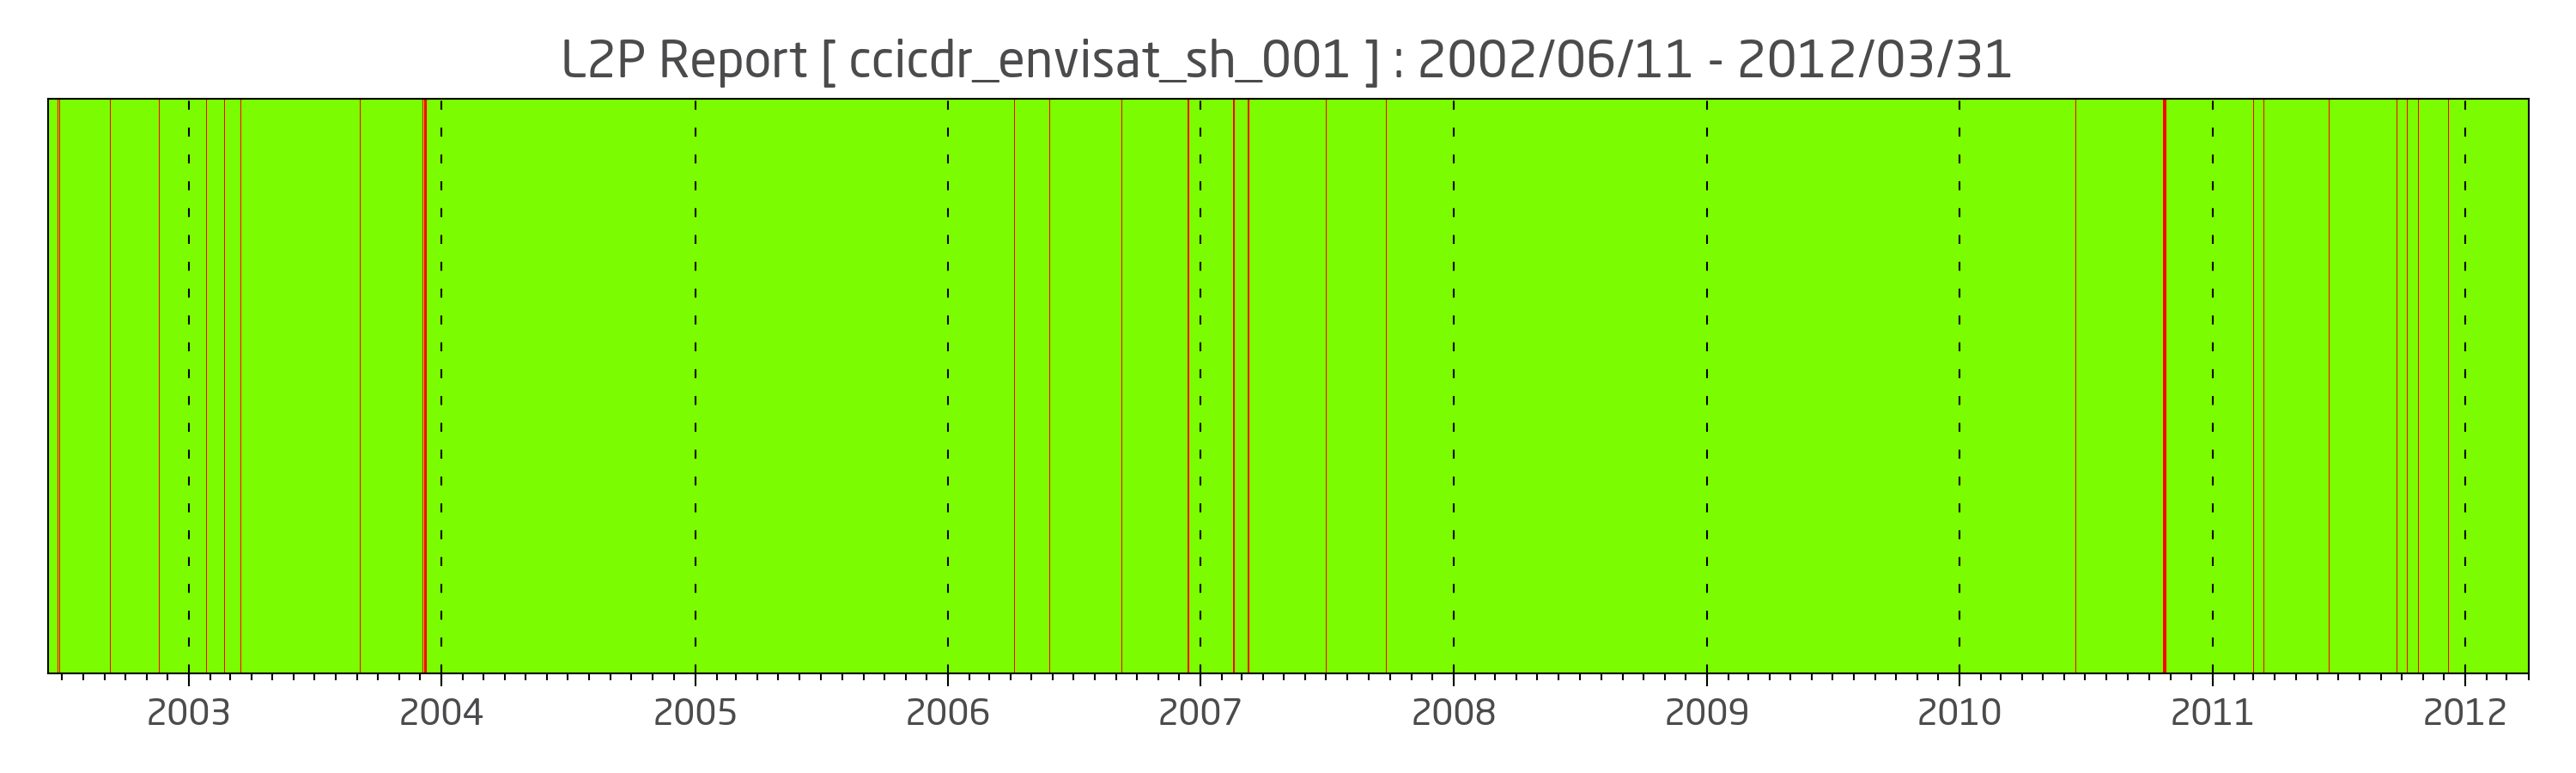
(Color coding: green: daily l2p available, red: daily l2p missing, light blue: Arctic summer gap)
One useful method to evaluate sea ice thickness information from remote sensing and numerical models is to compare monthly anomalies. This parameter is defined as the difference of one particular month to the mean monthly thickness fields of other month in the data record. Monthly anomalies are therefore sensitive to processes that cause sea ice thickness changes and can be compared to other sources which may have a systematic thickness bias to the reference thickness field.
One of these comparisons is regularly carried by the Polar Science Center (PSC) of the Applied Physics Laboratory at the University of Washington. The PSC operates the Pan-Arctic Ice Ocean Modeling and Assimilation System (PIOMAS) that provides near-real time updates of Arctic sea ice thickness and volume.
The following two figures show monthly thickness anomalies for PIOMAS and CryoSat-2 (cs2awi v2.0 NRT) for March 2018 with mean conditions from the time frame of the CryoSat-2 data record (2011-2017).
PIOMAS Scientific Reference:
Schweiger, A., R. Lindsay, J. Zhang, M. Steele, H. Stern, Uncertainty in modeled arctic sea ice volume, J. Geophys. Res., doi:10.1029/2011JC007084, 2011
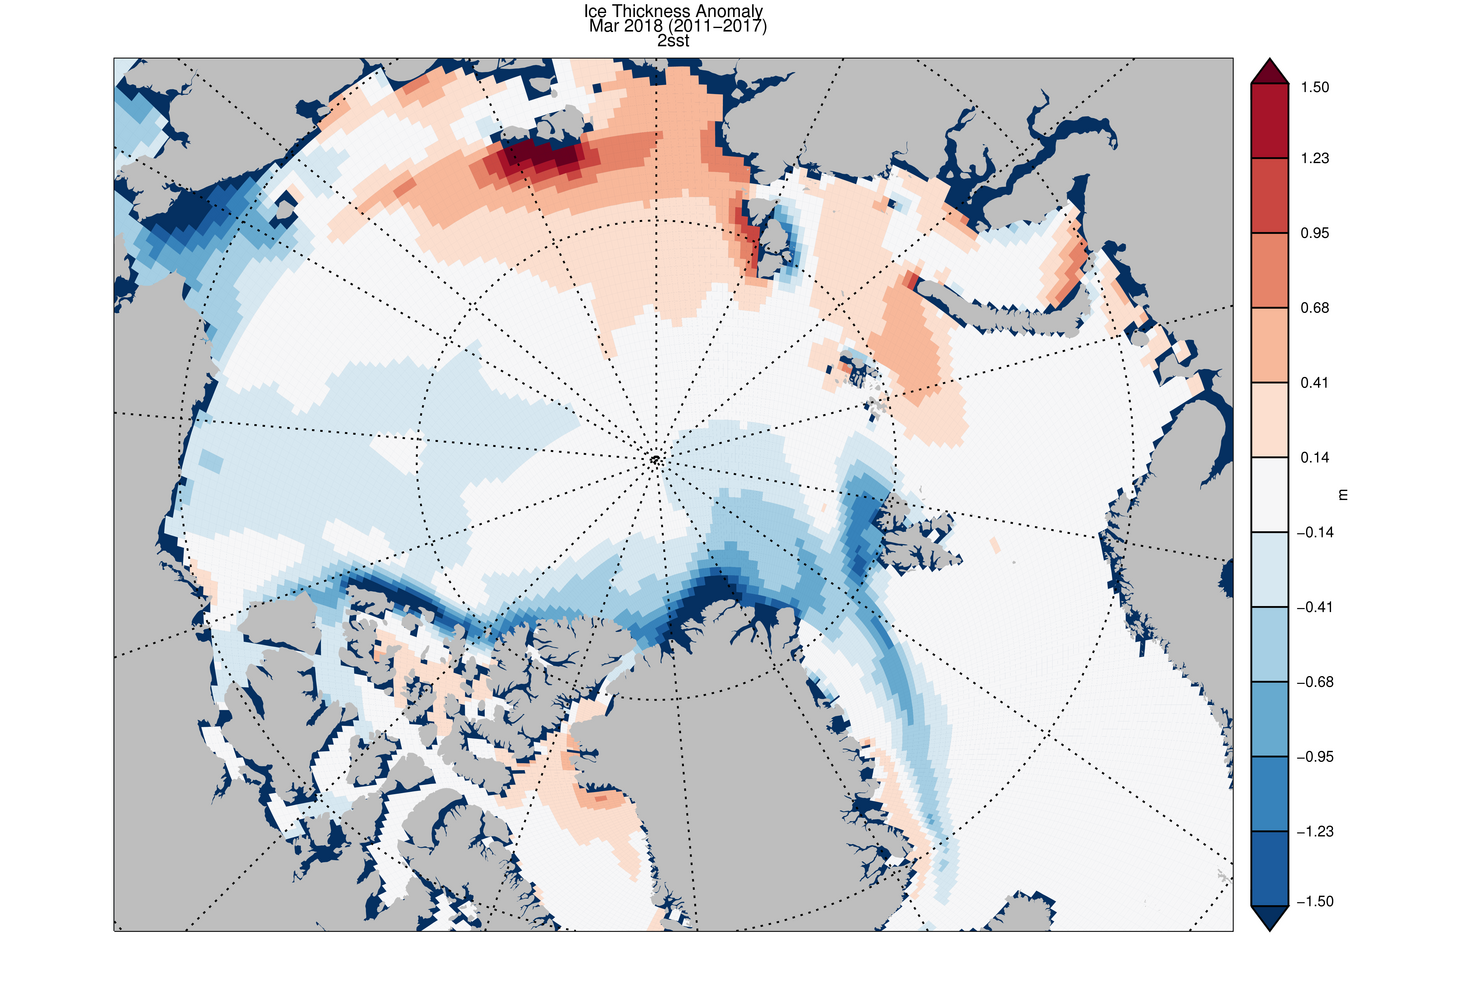
PIOMAS March 2018 sea ice thickness anomaly
(credit: Axel Schweiger, Polar Science Center, Source)
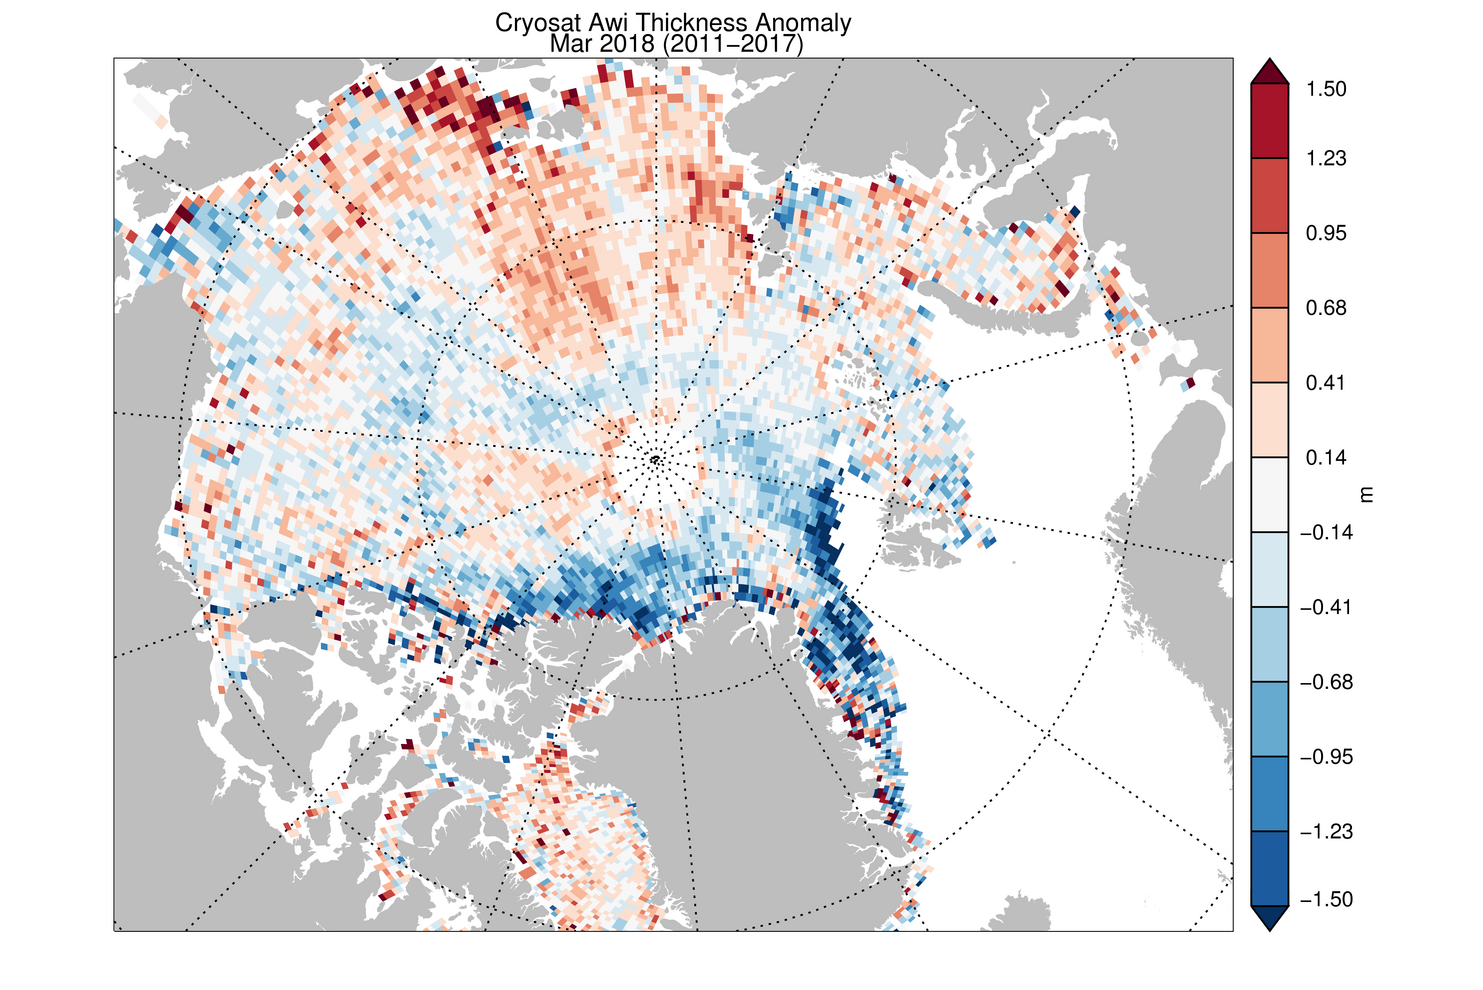
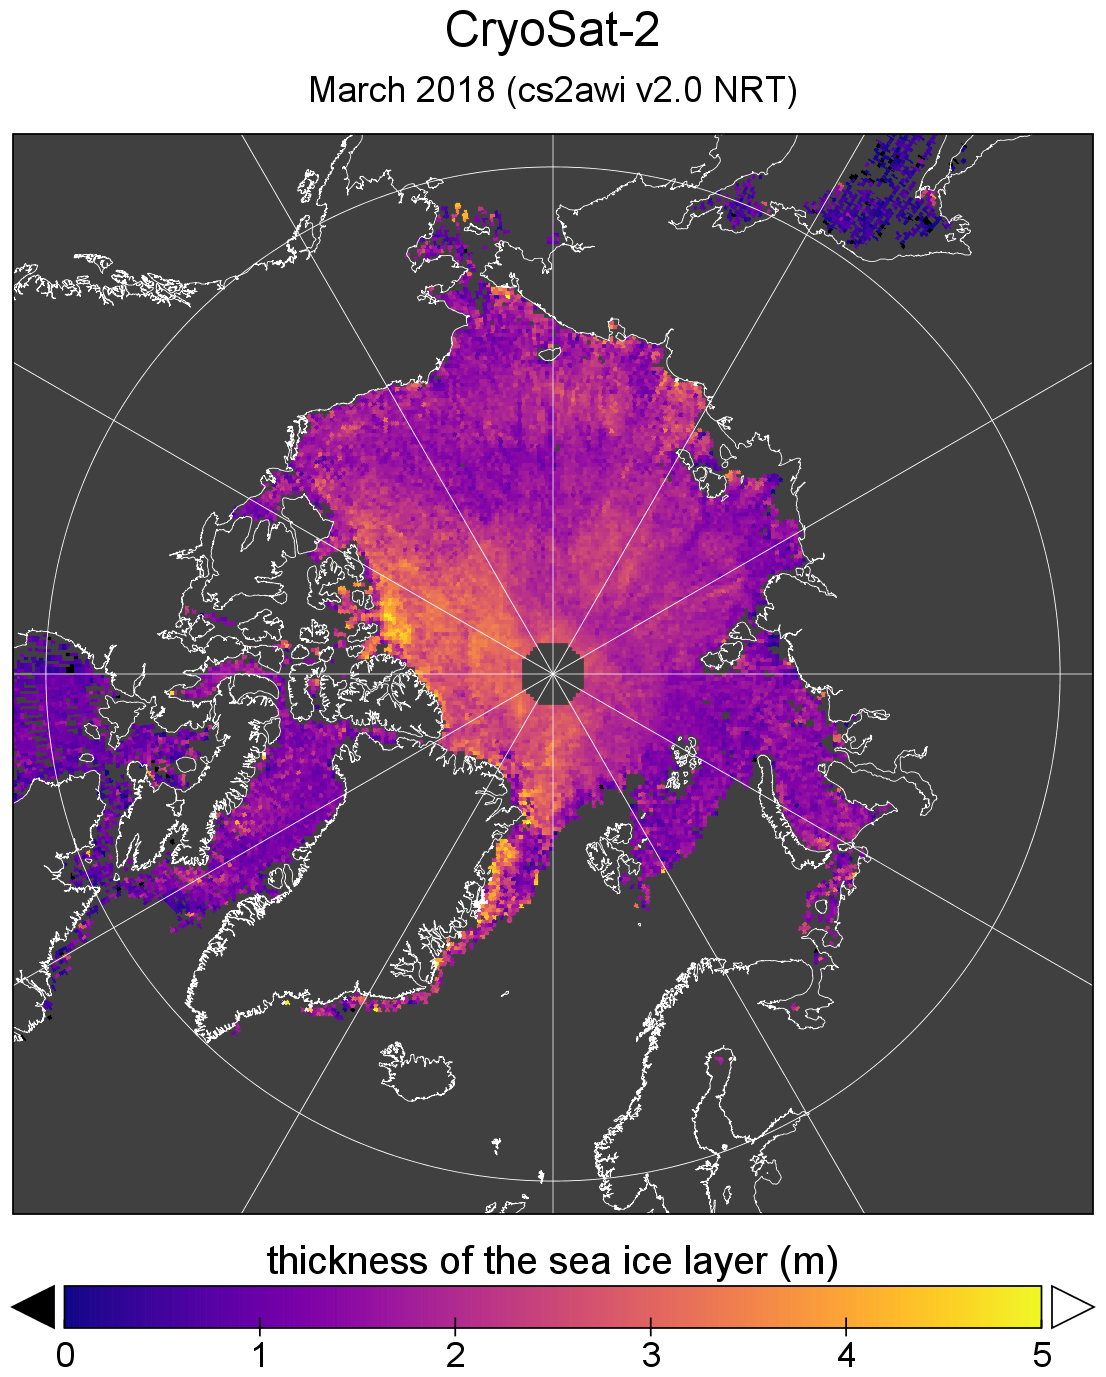
CryoSat-2 March 2018 sea ice thickness anomaly projected to PIOMAS grid
(credit: Axel Schweiger, Polar Science Center, Source)
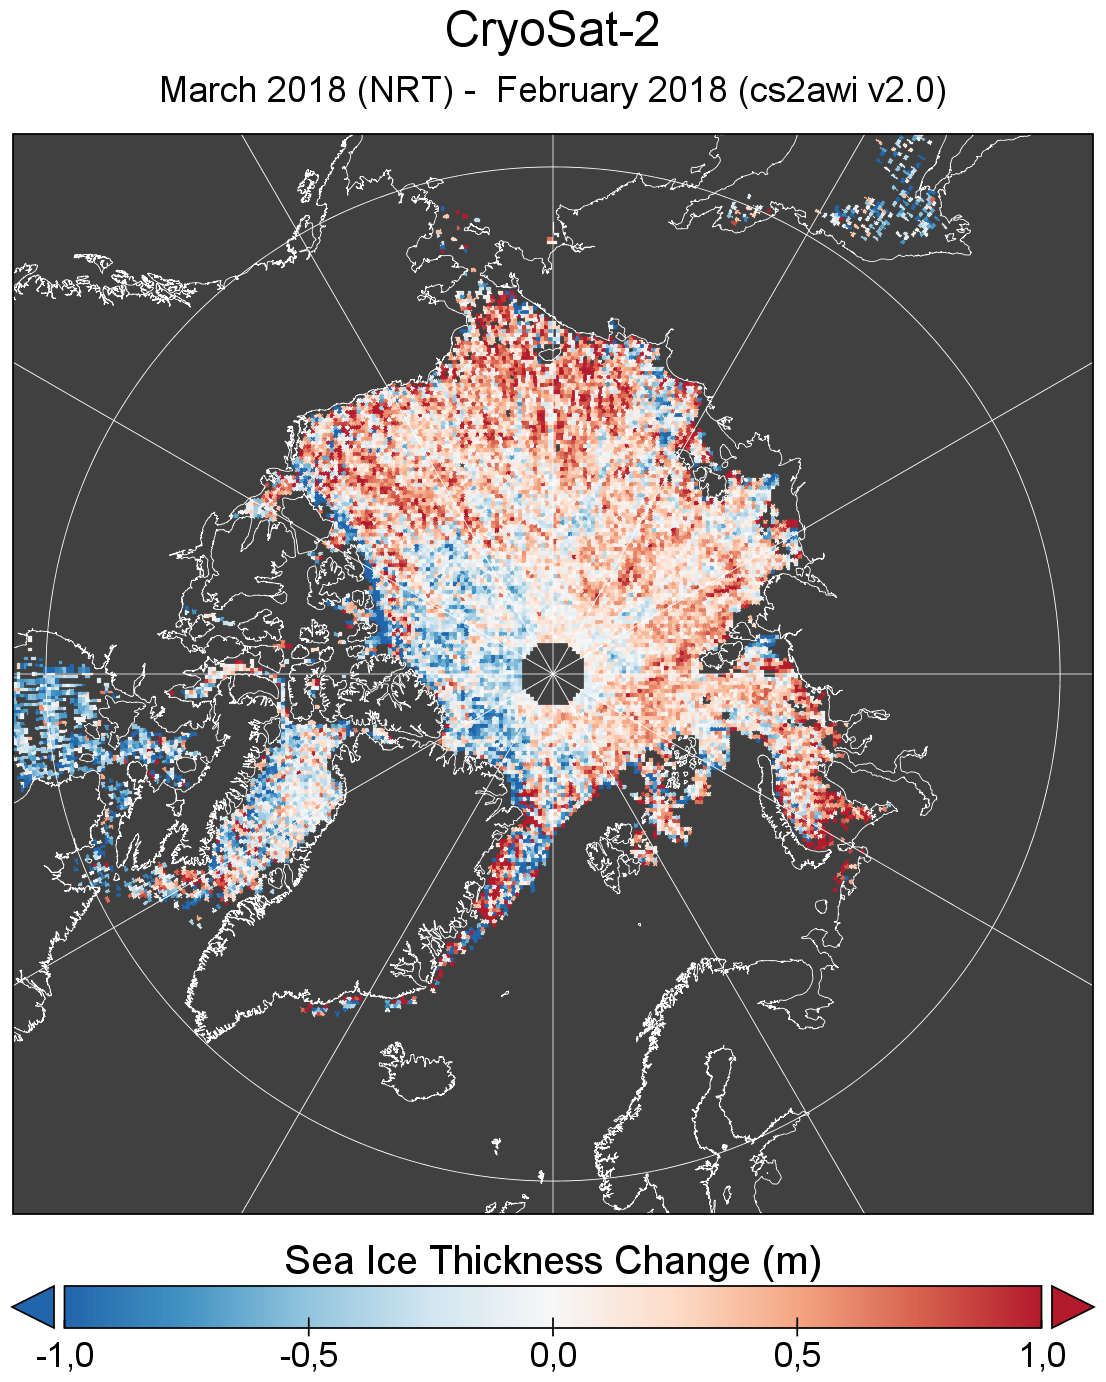
The regional patterns in the March 2018 thickness anomalies are widely consistent with
- distinct positive thickness anomaly in the Russion Sector and Baffin Bay
- distinct negative thickness anomaly north of Greenland and the Canadian Archipelago as well as Fram Strait
The agreement is less close to the north pole where CryoSat-2 indicates a minor positive thickness anomaly that is not visible in the PIOMAS data. The previous CryoSat-2 monthly anomalies (below) of the winter season of 2017/18 indicate that this particular positive anomaly persisted and has been more pronounced in the previous month. However, a detailed drift analysis is necessary to track the sea ice region to origin in the previous year for a more detailed analysis.
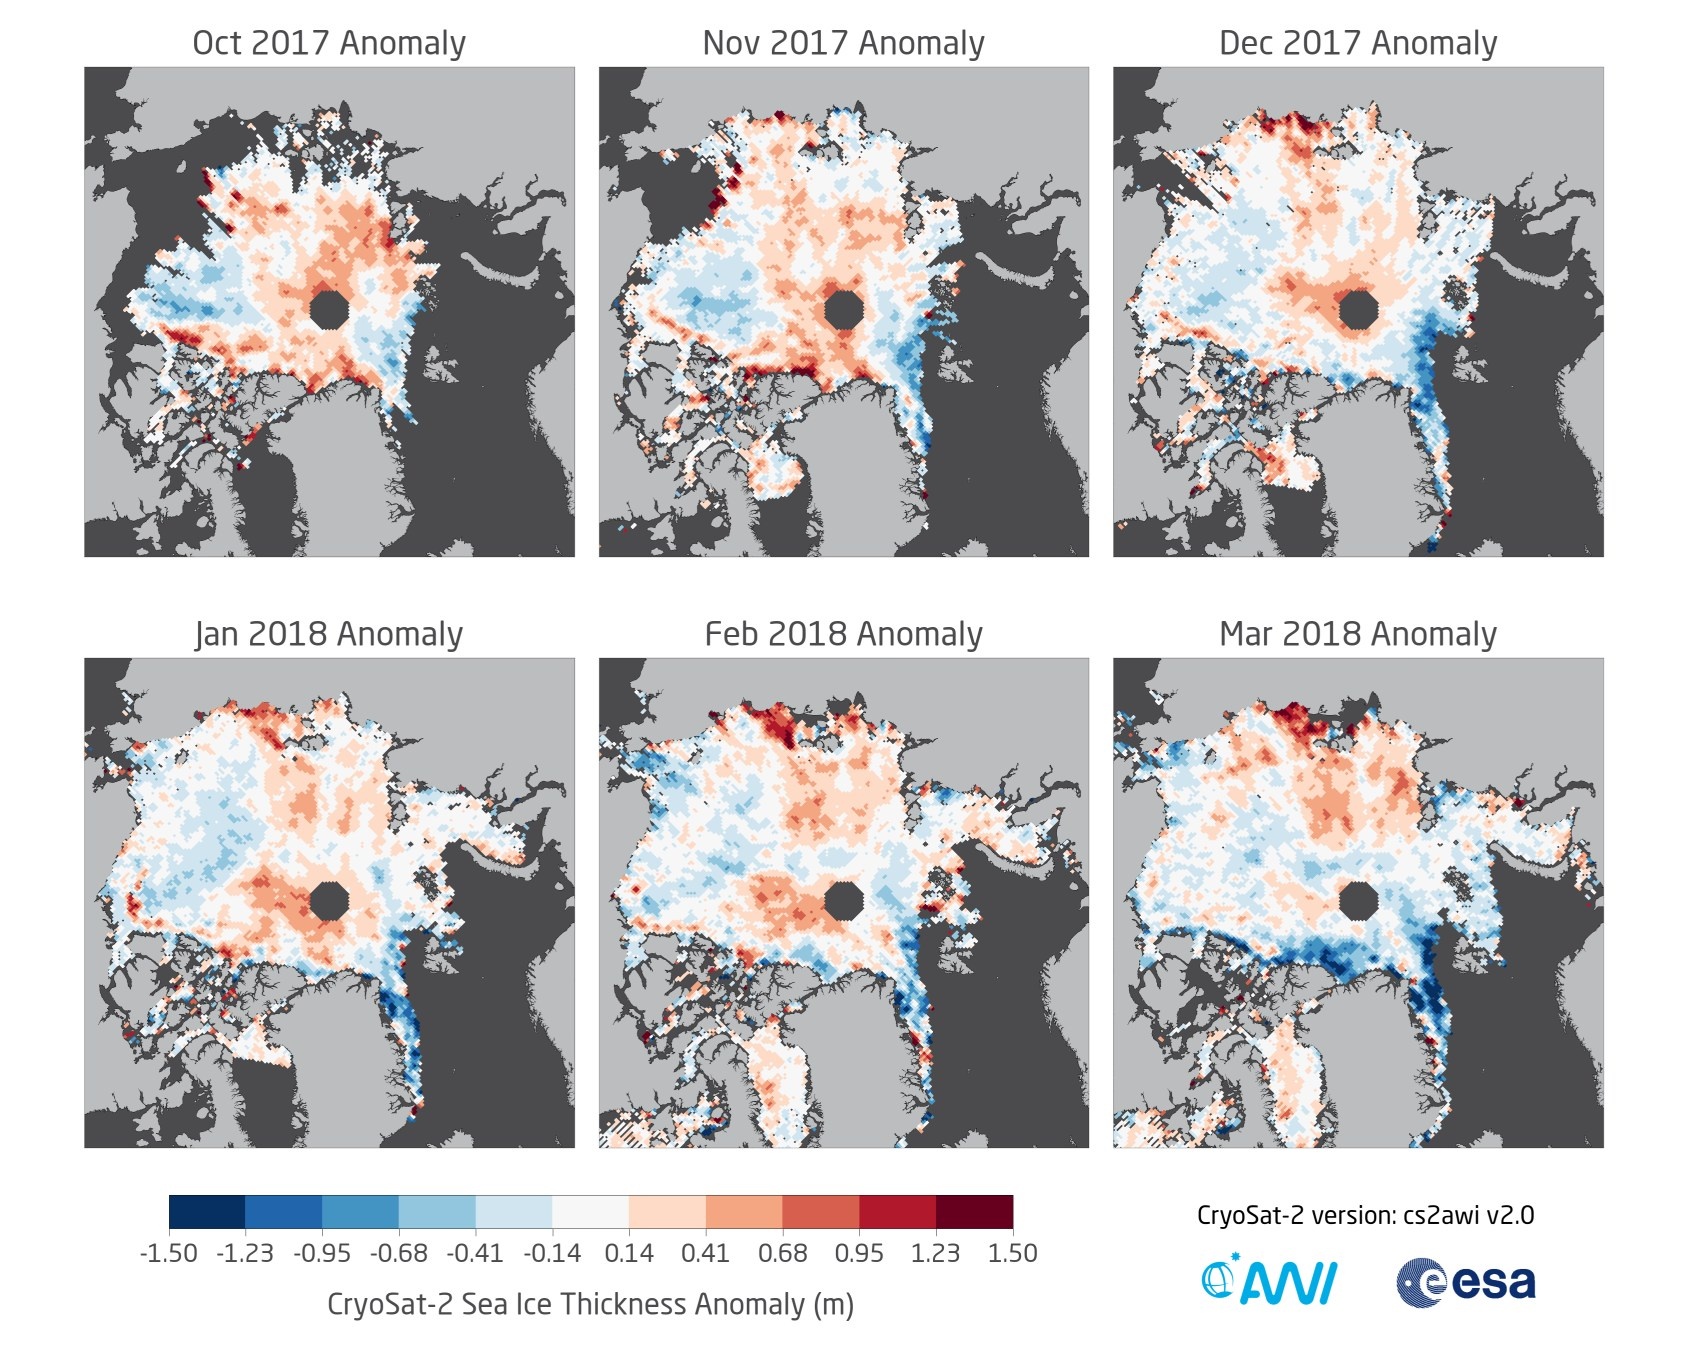
Monthly CryoSat-2 thickness anomalies for winter season 2017/2018 (March 2018: NRT data)
Arctic sea ice thickness information has been updated with NRT data for March 2018 and reprocessed data for February 2018. Daily, weekly and monthly products are available here: Reprocessed, Near-real time
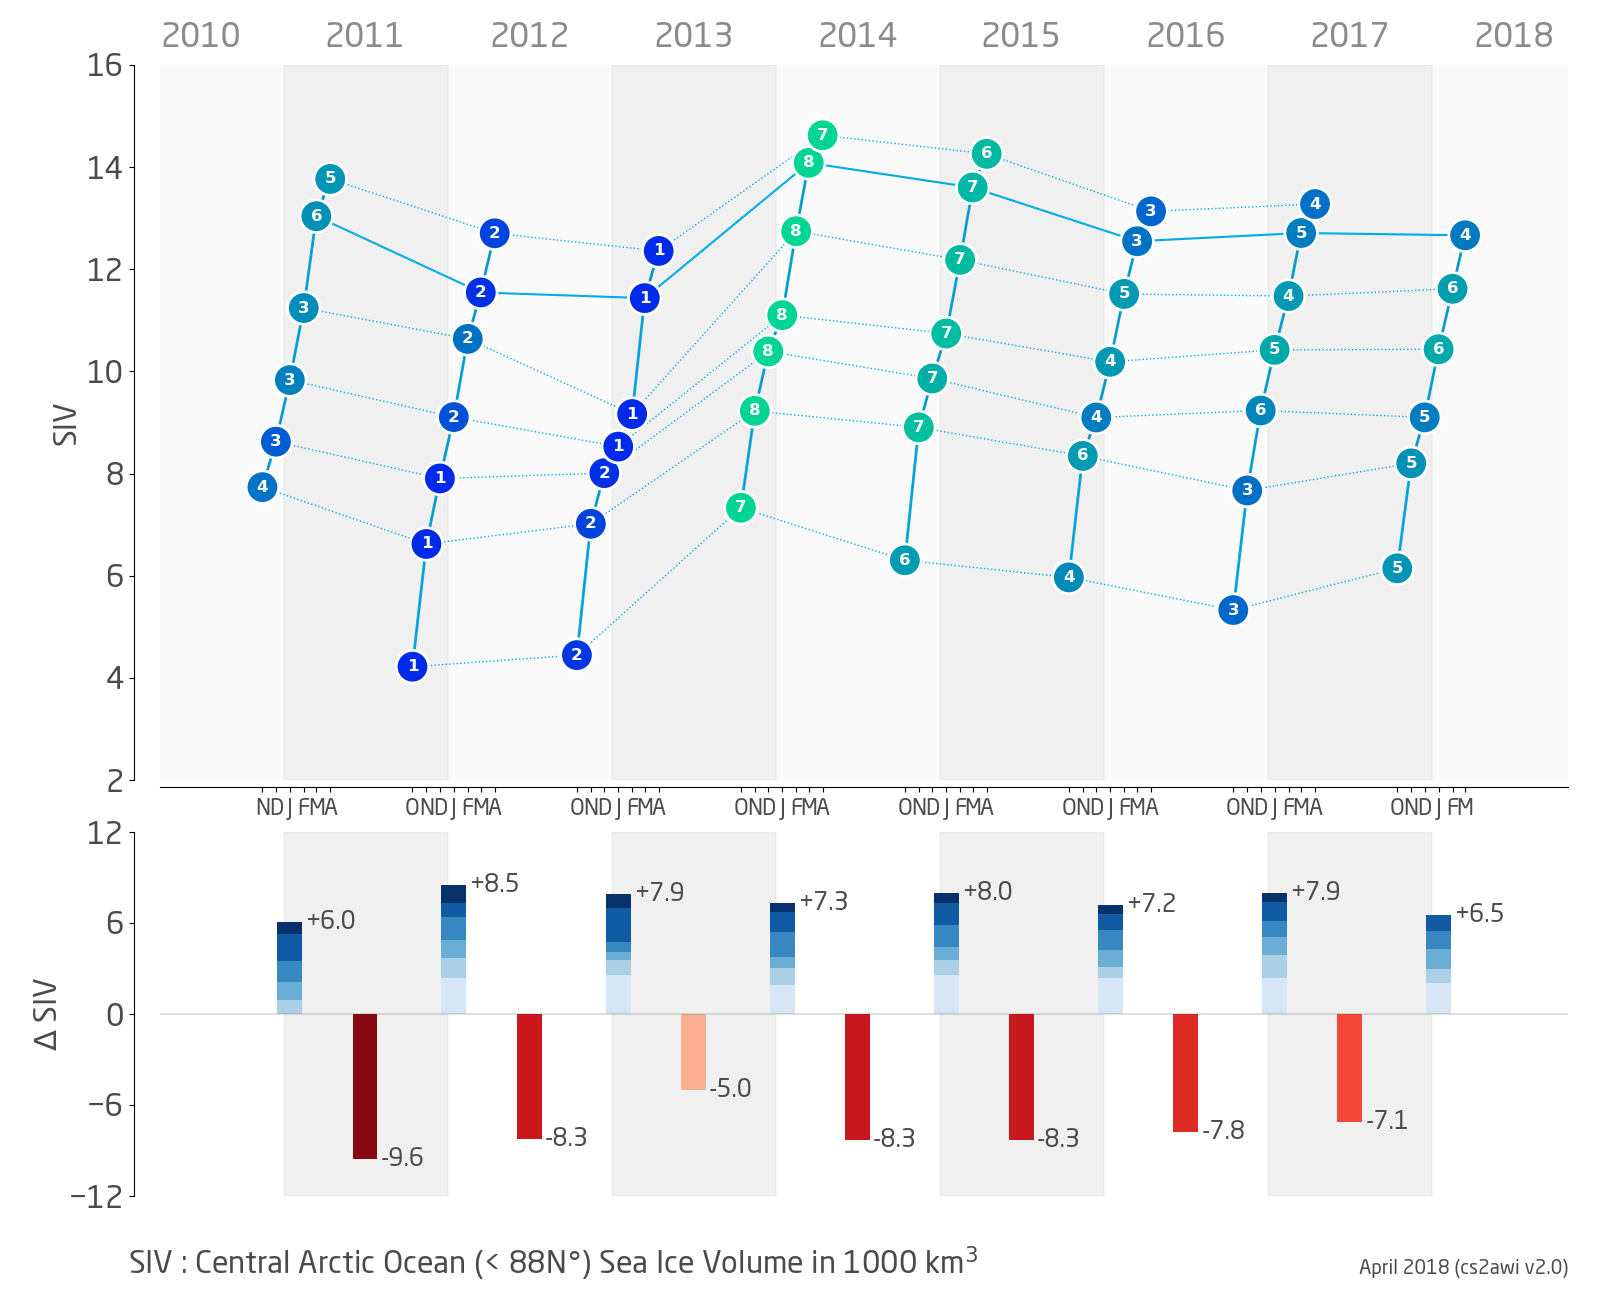
Short Facts
- March sea ice volume in the central Arctic was 4th lowest / 4th highest in 8 years of CryoSat-2 observations: 12.67 • 103 km3
- highest: 14.08 • 103 km3 in Mar 2014
- lowest: 11.44 • 103 km3 in Mar 2013
- average: 12.70 • 103 km3
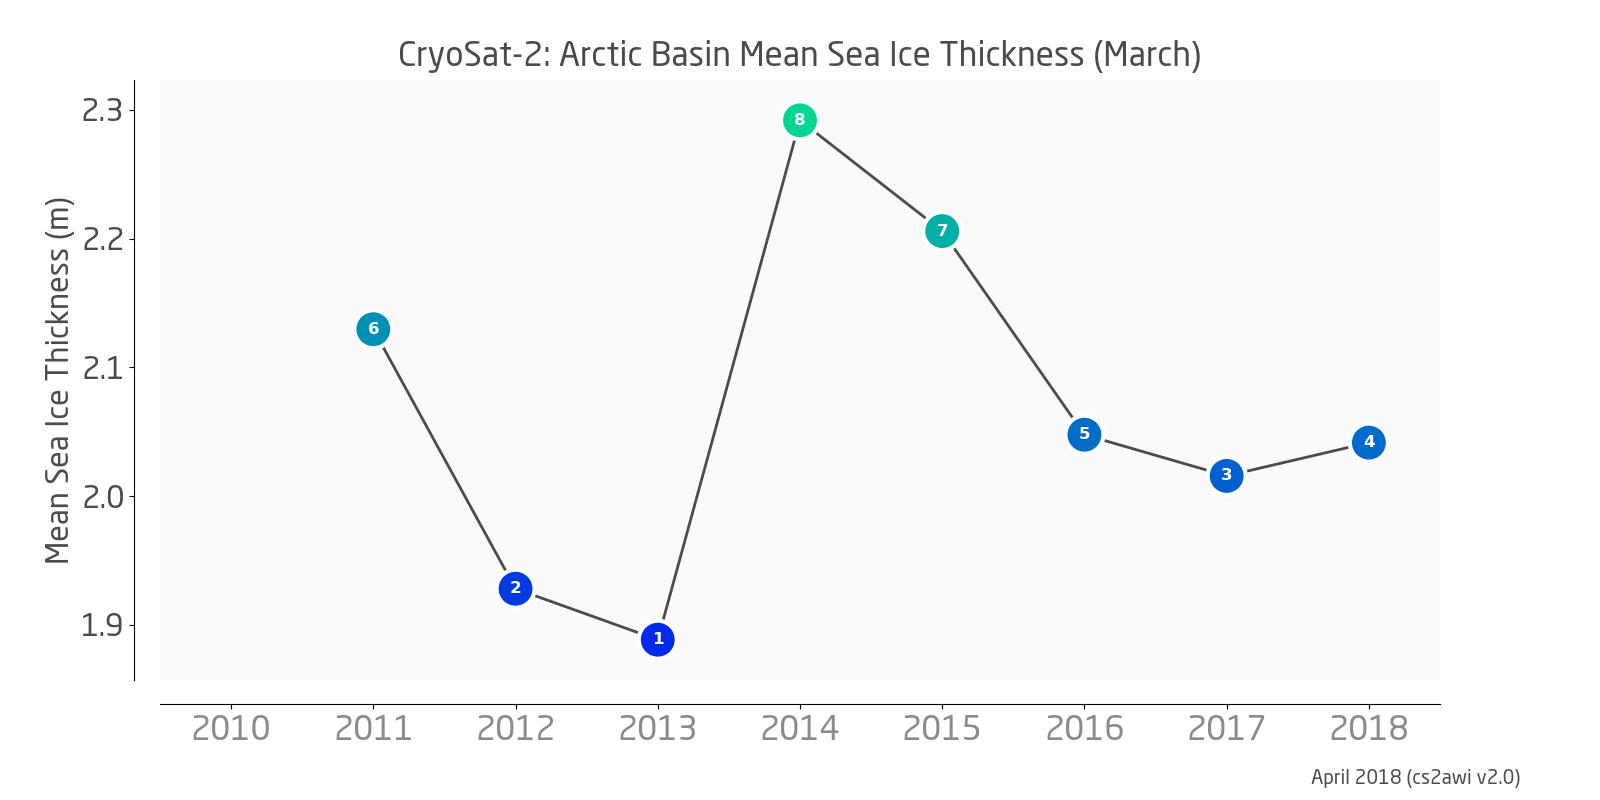
- March mean sea ice thickness in the central Arctic was 4th lowest / 4th highest in 8 years of CryoSat-2 observations: 2.04 m
- highest: 2.29 m in Mar 2014
- lowest: 1.89 m in Mar 2013
- average: 2.04 m
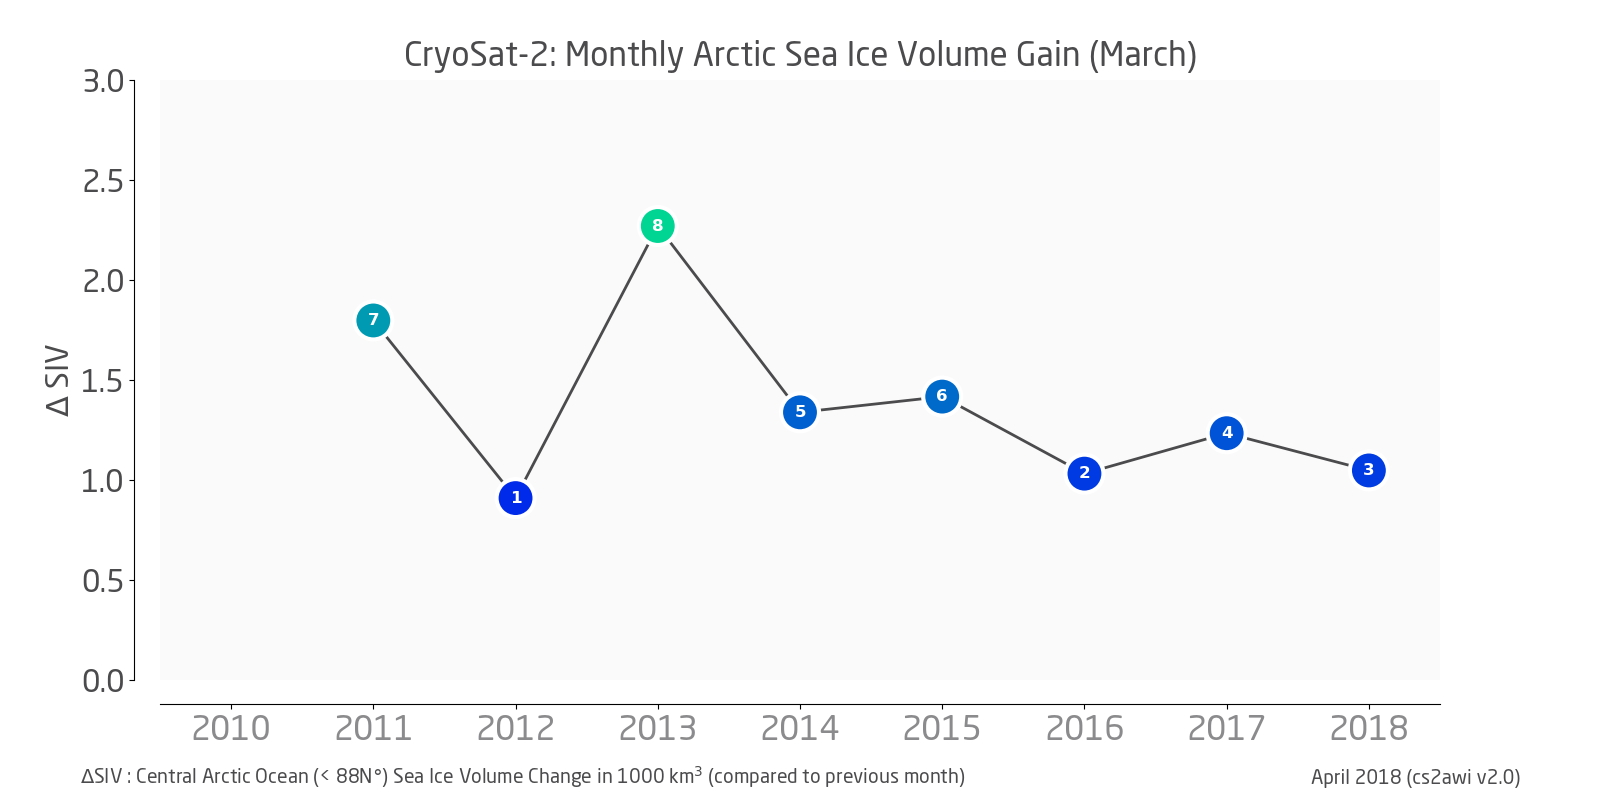
- Monthly sea ice volume gain (February through March) was 3rd lowest / 6th highest in 8 years of CryoSat-2 observations: +1.38 • 103 km3
- highest: +2.27 • 103 km3 in March 2013 (potential retrieval anomaly, under investigation)
- lowest: +0.91 • 103 km3 in Mar 2012
- average: +1.38 • 103 km3
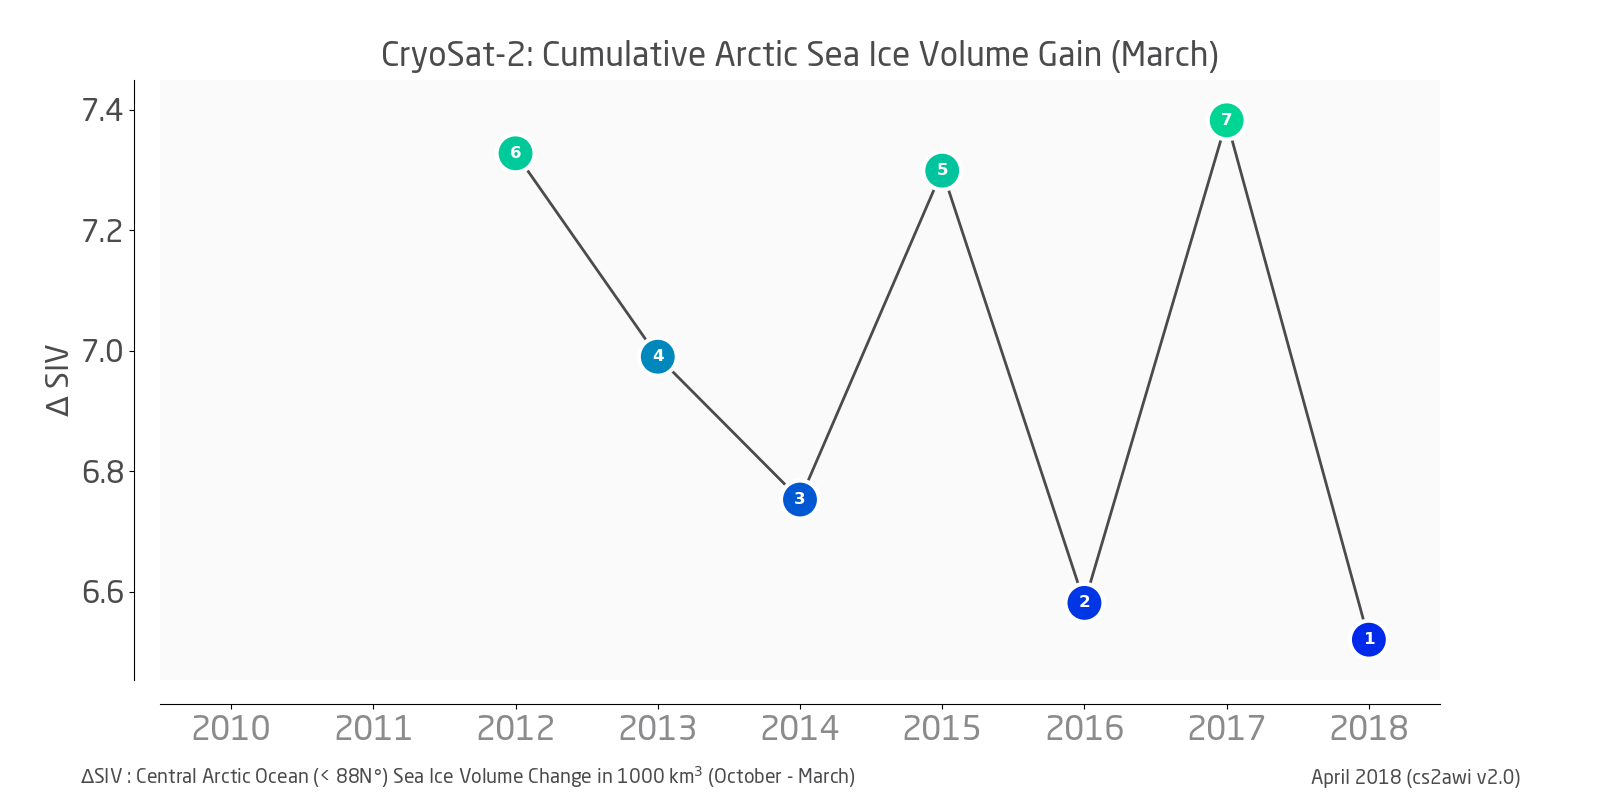
- Cummulative sea ice volume gain (October through February) was lowest in 8 years of CryoSat-2 observations: +6.52 • 103 km3
- highest: +7.38 • 103 km3 in Mar 2017
- average: +6.98 • 103 km3