
The production of sea ice thickness from CryoSat-2 near real-time data has been resumed for the winter season 2023/24. Documentation of the new version 2.6 will be made available shortly on this page.
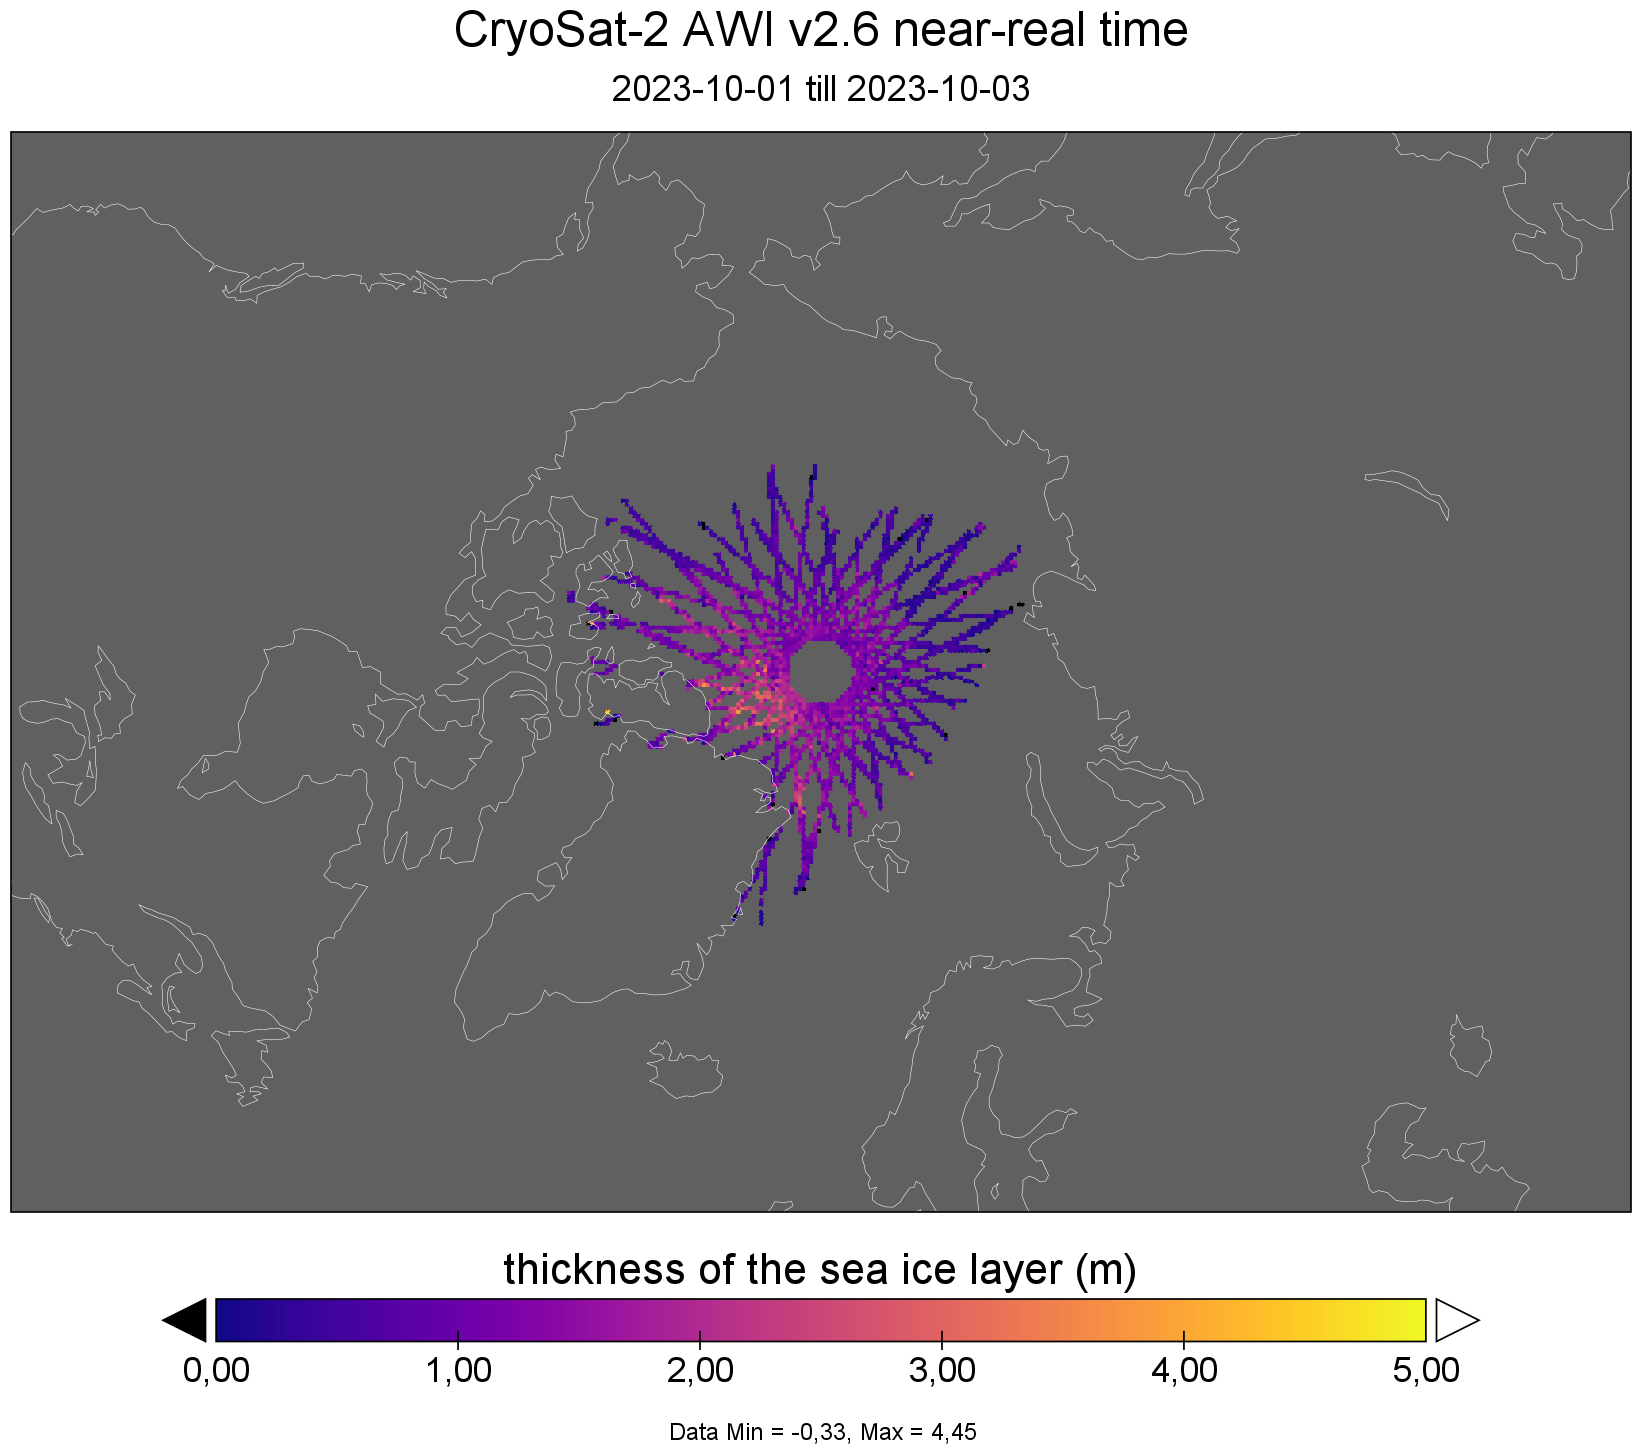 Figure: CryoSat-2 NRT data from the first 3 days of October 2023
Operational production of CrypSat-2 near real time data has been completed for the 2022/23 Arctic winter season. Production will resume in October 2023.
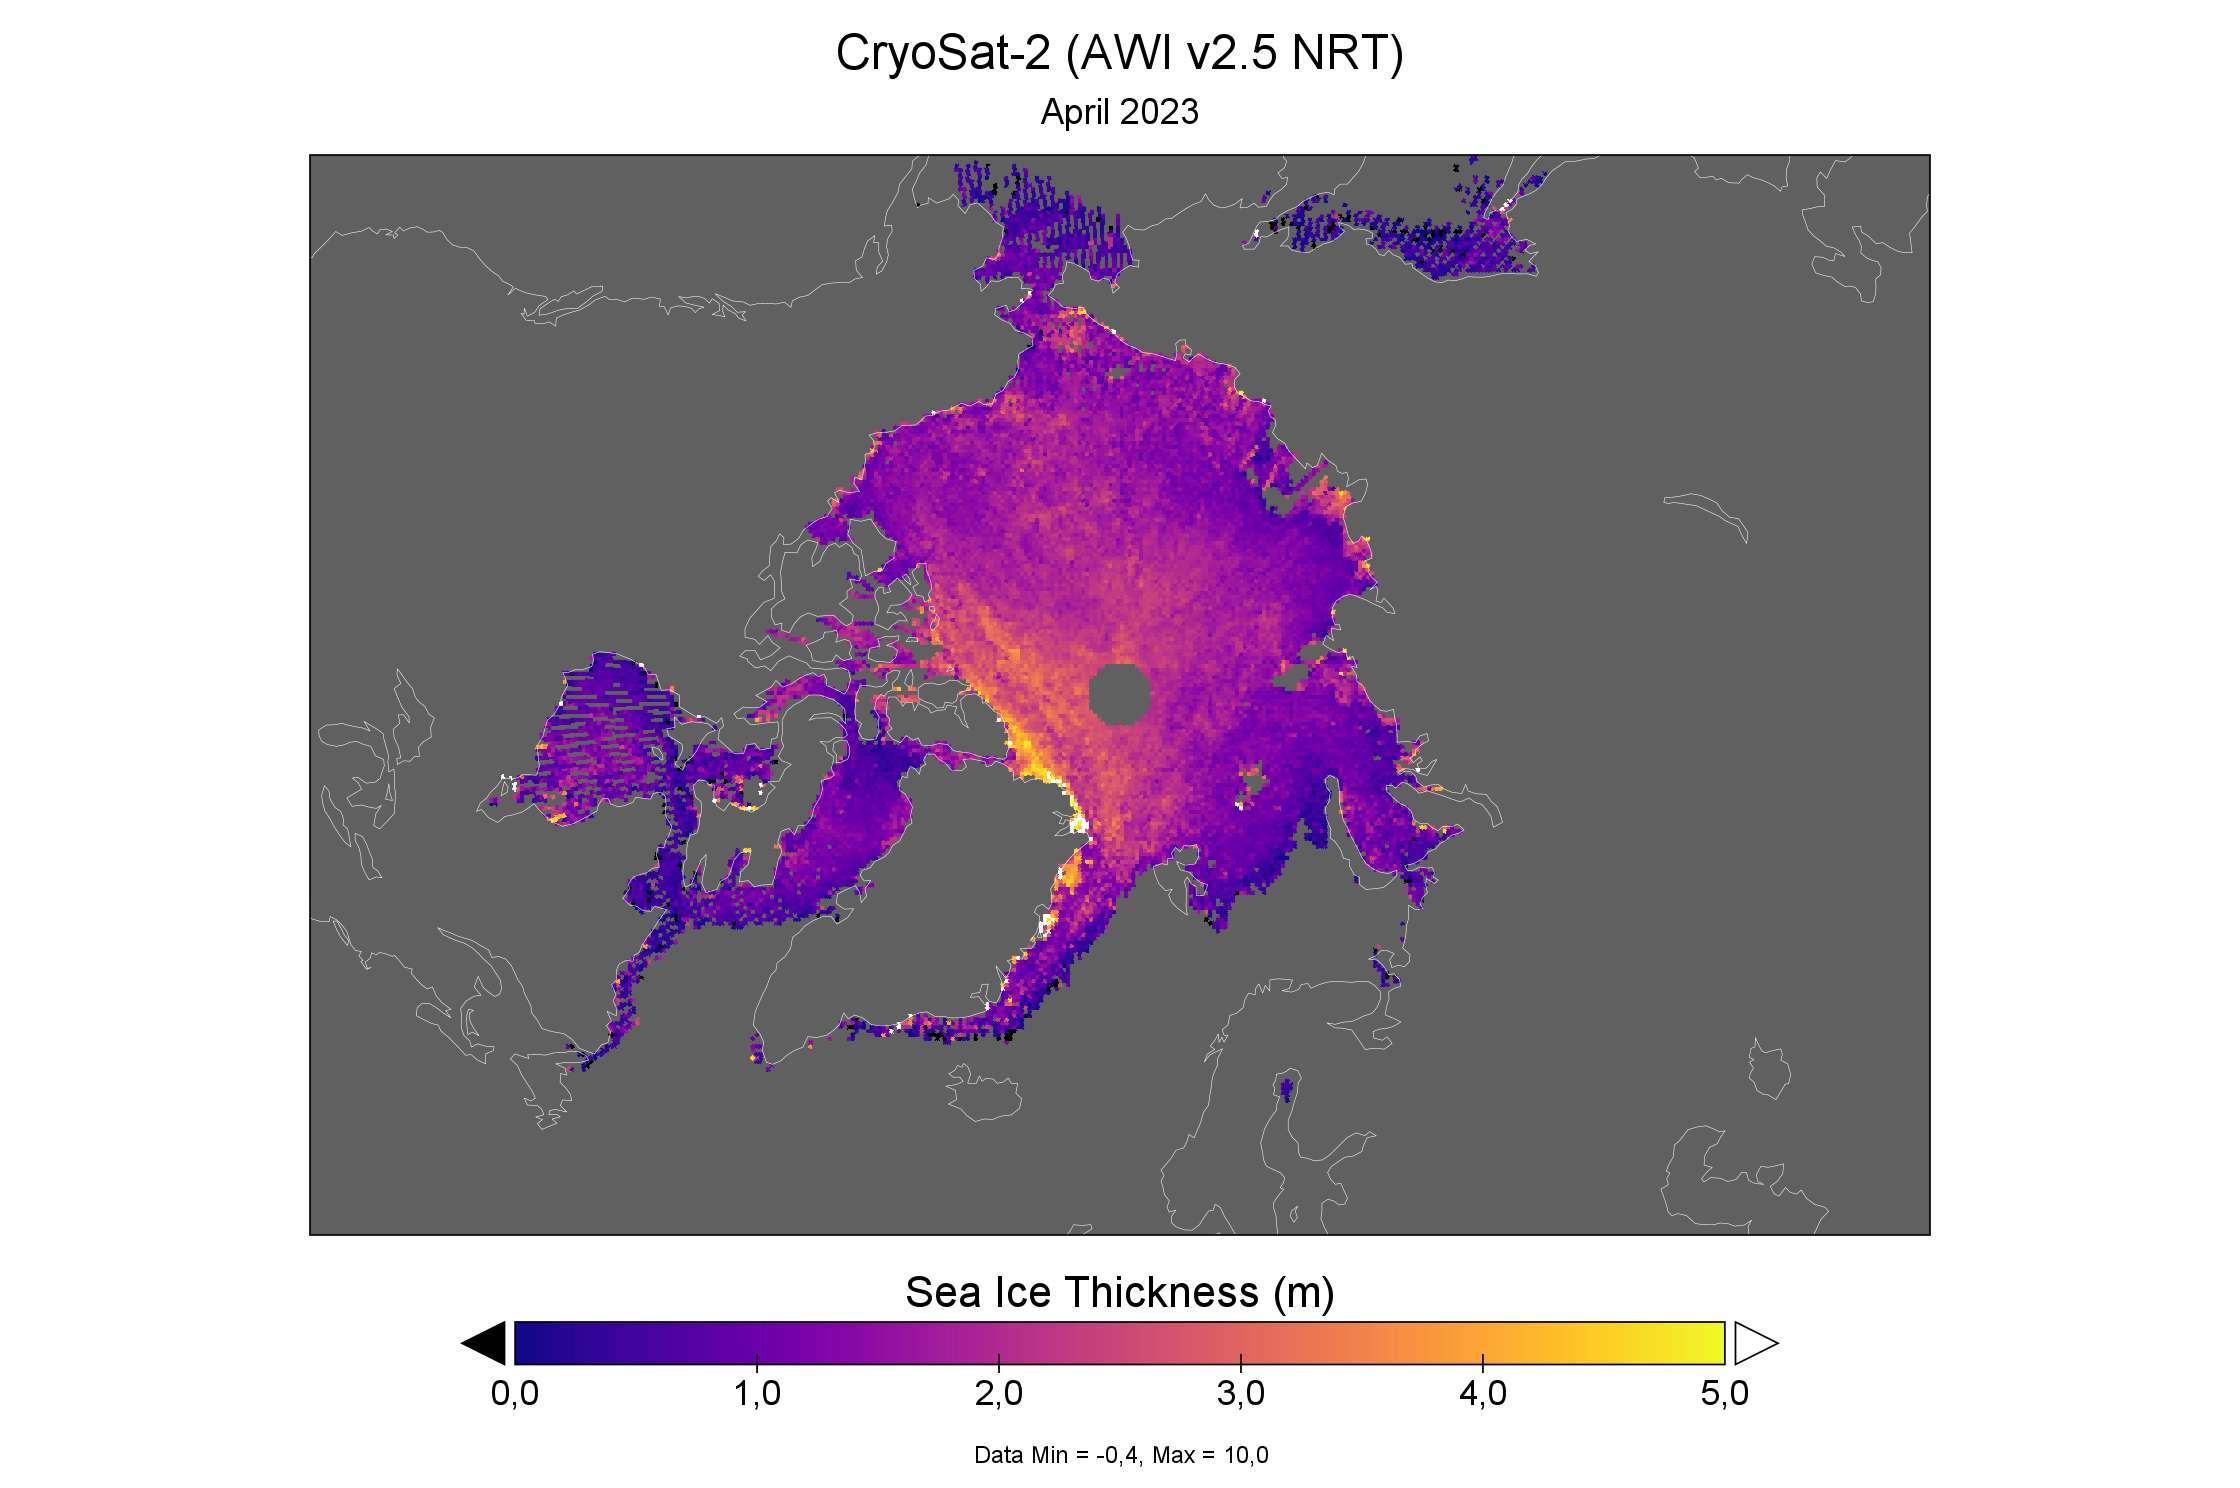 Final Arctic sea ice thickness grid (April 2023) from CryoSat-2 nea real-time data
Sea Ice Concentration data from OSI-SAF is (OSI-401-b) is currently not available due to missing DMSP SSMIS Level-1 input data:
https://osi-saf.eumetsat.int/community/list-of-service-messages
Daily sea ice concentration data from OSI-401-b is critical input to the CryoSat-2 sea ice product and data from the following dates is missing:
- CryoSat-2 l2p
The most recent version of the AWI CryoSat-2 sea ice product has been published on the AWI ftp:
ftp://ftp.awi.de/sea_ice/product/cryosat2/v2p5/nh/
The data release includes a full mission reprocessing from November 2010 and April 2022 and operational processing (including near real-time) from October 2022 onwards.
| Reprocessed (33 days delay) | Near-real time (2 days delay) | |
|---|---|---|
| Daily Trajectory | l2p_trajectory | l2p_trajectory/Latest |
| Weekly Gridded | l3c_grid/isoweek | l3c_grid/isoweek/Latest |
| Monthly Gridded | l3c_grid/month | l3c_grid/month/Latest |
The change log of version 2.5 can be found here.
Data from version 2.5 should not be directly compared to data from previous versions.
Production of the near real-time AWI CryoSat-2 sea ice thickness product will start shortly.
Preliminary list of updates compared in v2.5:
- New surface type classification (sea ice / lead / open ocean discrimination). The new surface type classification increases the number of waveforms for sea ice freeboard/thickness evaluation.
- New flag indicating surface wave influence in the marginal ice zone. Surface waves that penetrate into the sea ice lead to a roughening of the surface and a freeboard bias. This bias is now detected based on waveform properties and the distance to open water from sea ice concentration data.
- Update region code to 2021 NSIDC regional mask for Arctic sea ice trends and climatologies (credit J. Scott Stewart and Walter N. Meier, NSIDC)
- Open Ocean data from CryoSat-2 pulse-limited radar mode (LRM) is included, but not yet used for estimation of sea surface height
- Fixed issue with connecting data from the same orbit that was distributed over different files. The issue has caused data loss and degraded sea surface height information (see https://github.com/pysiral/pysiral/issues/91)
- Fixed issue with computing pulse peakiness for noisy waveforms. This issue has caused incorrect surface type classifications (https://github.com/pysiral/pysiral/issues/89)
The release of the baseline-E of CryoSat-2 L1b data (See ESA announcement) has provided a fix to missing orbits in the near real-time NRT data (See CryoSat-2 NRT issues remain for a description). The orbit coverage of the CryoSat-2 v2.4 NRT data from October 2021 and later has again the same coverage as the following reprocessed data.
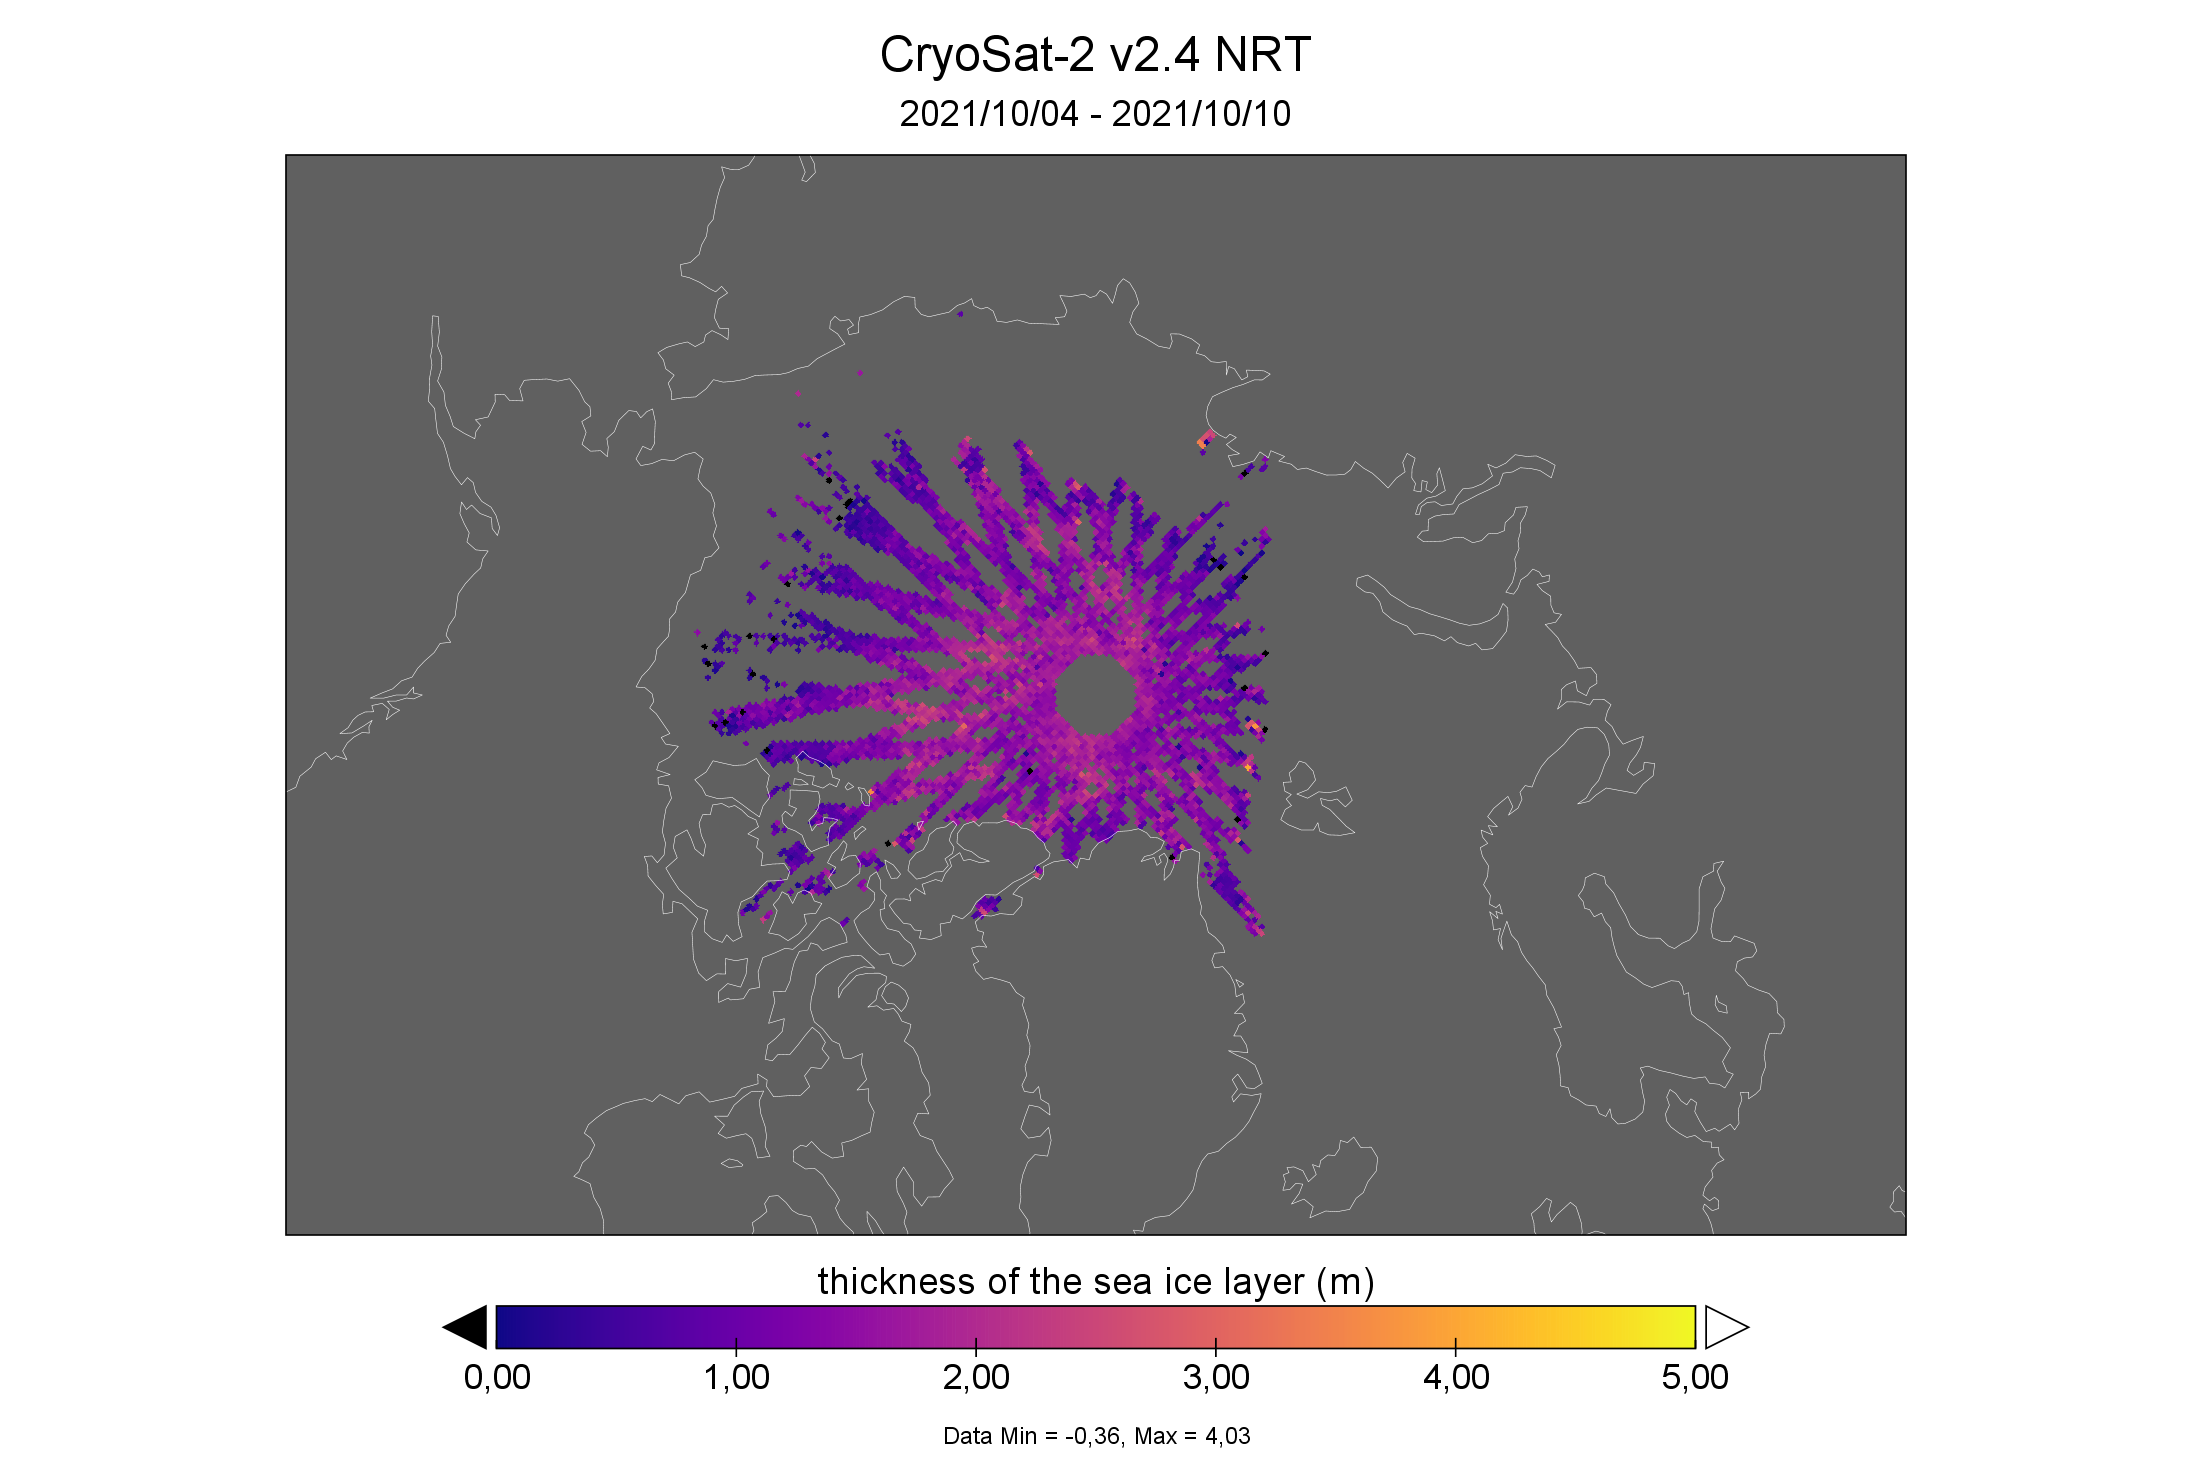
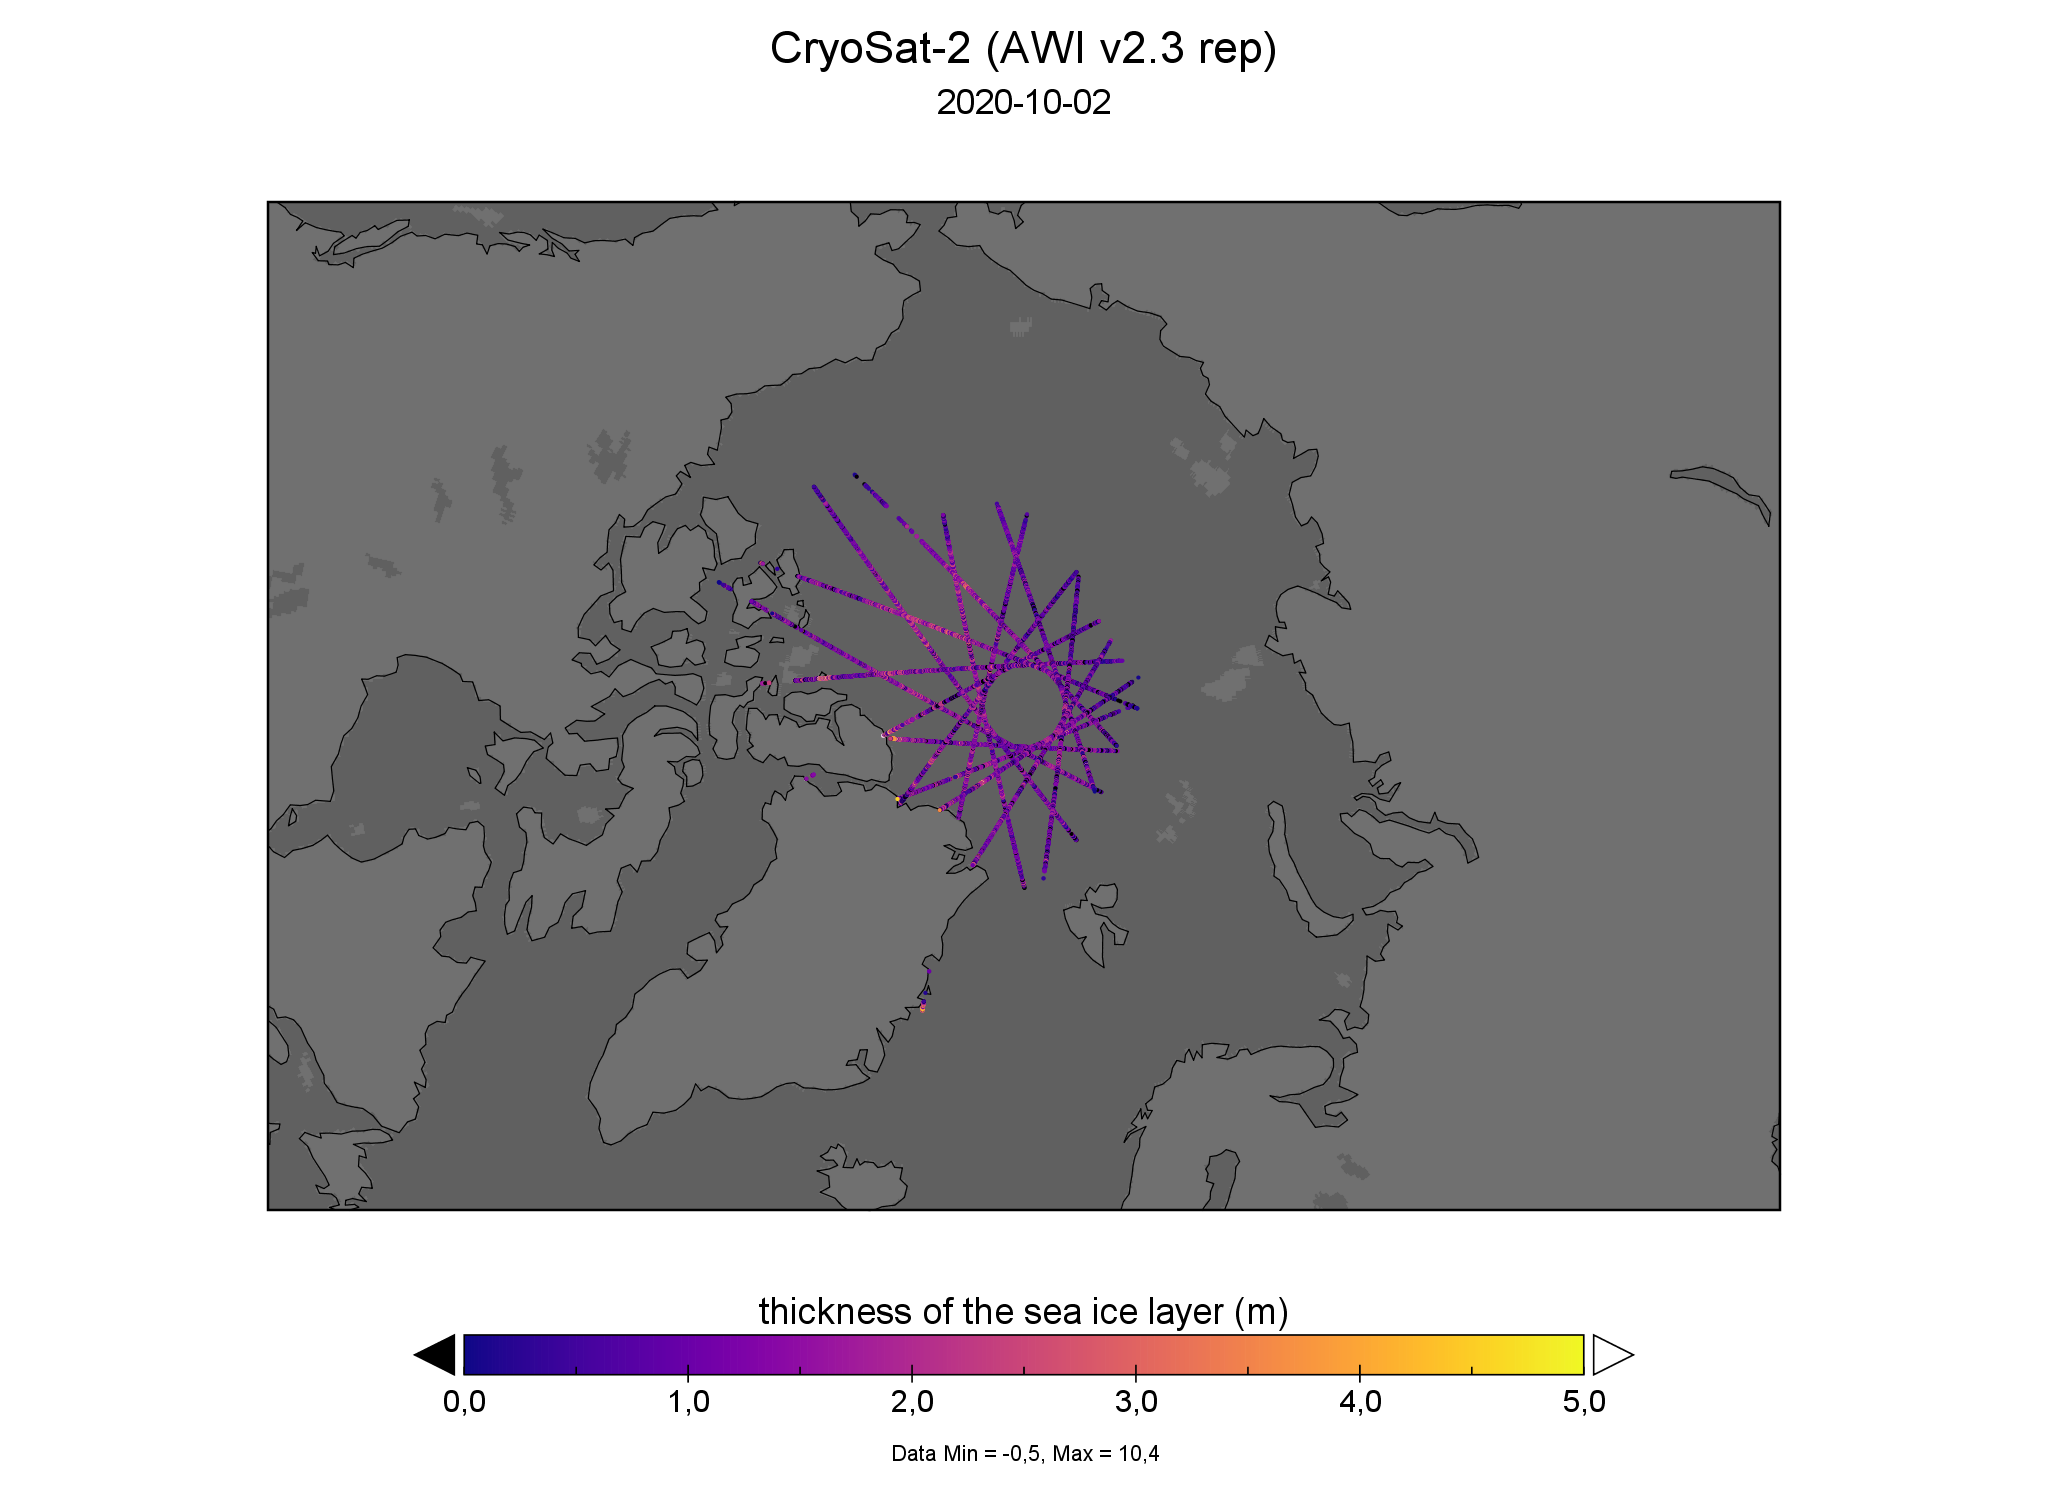
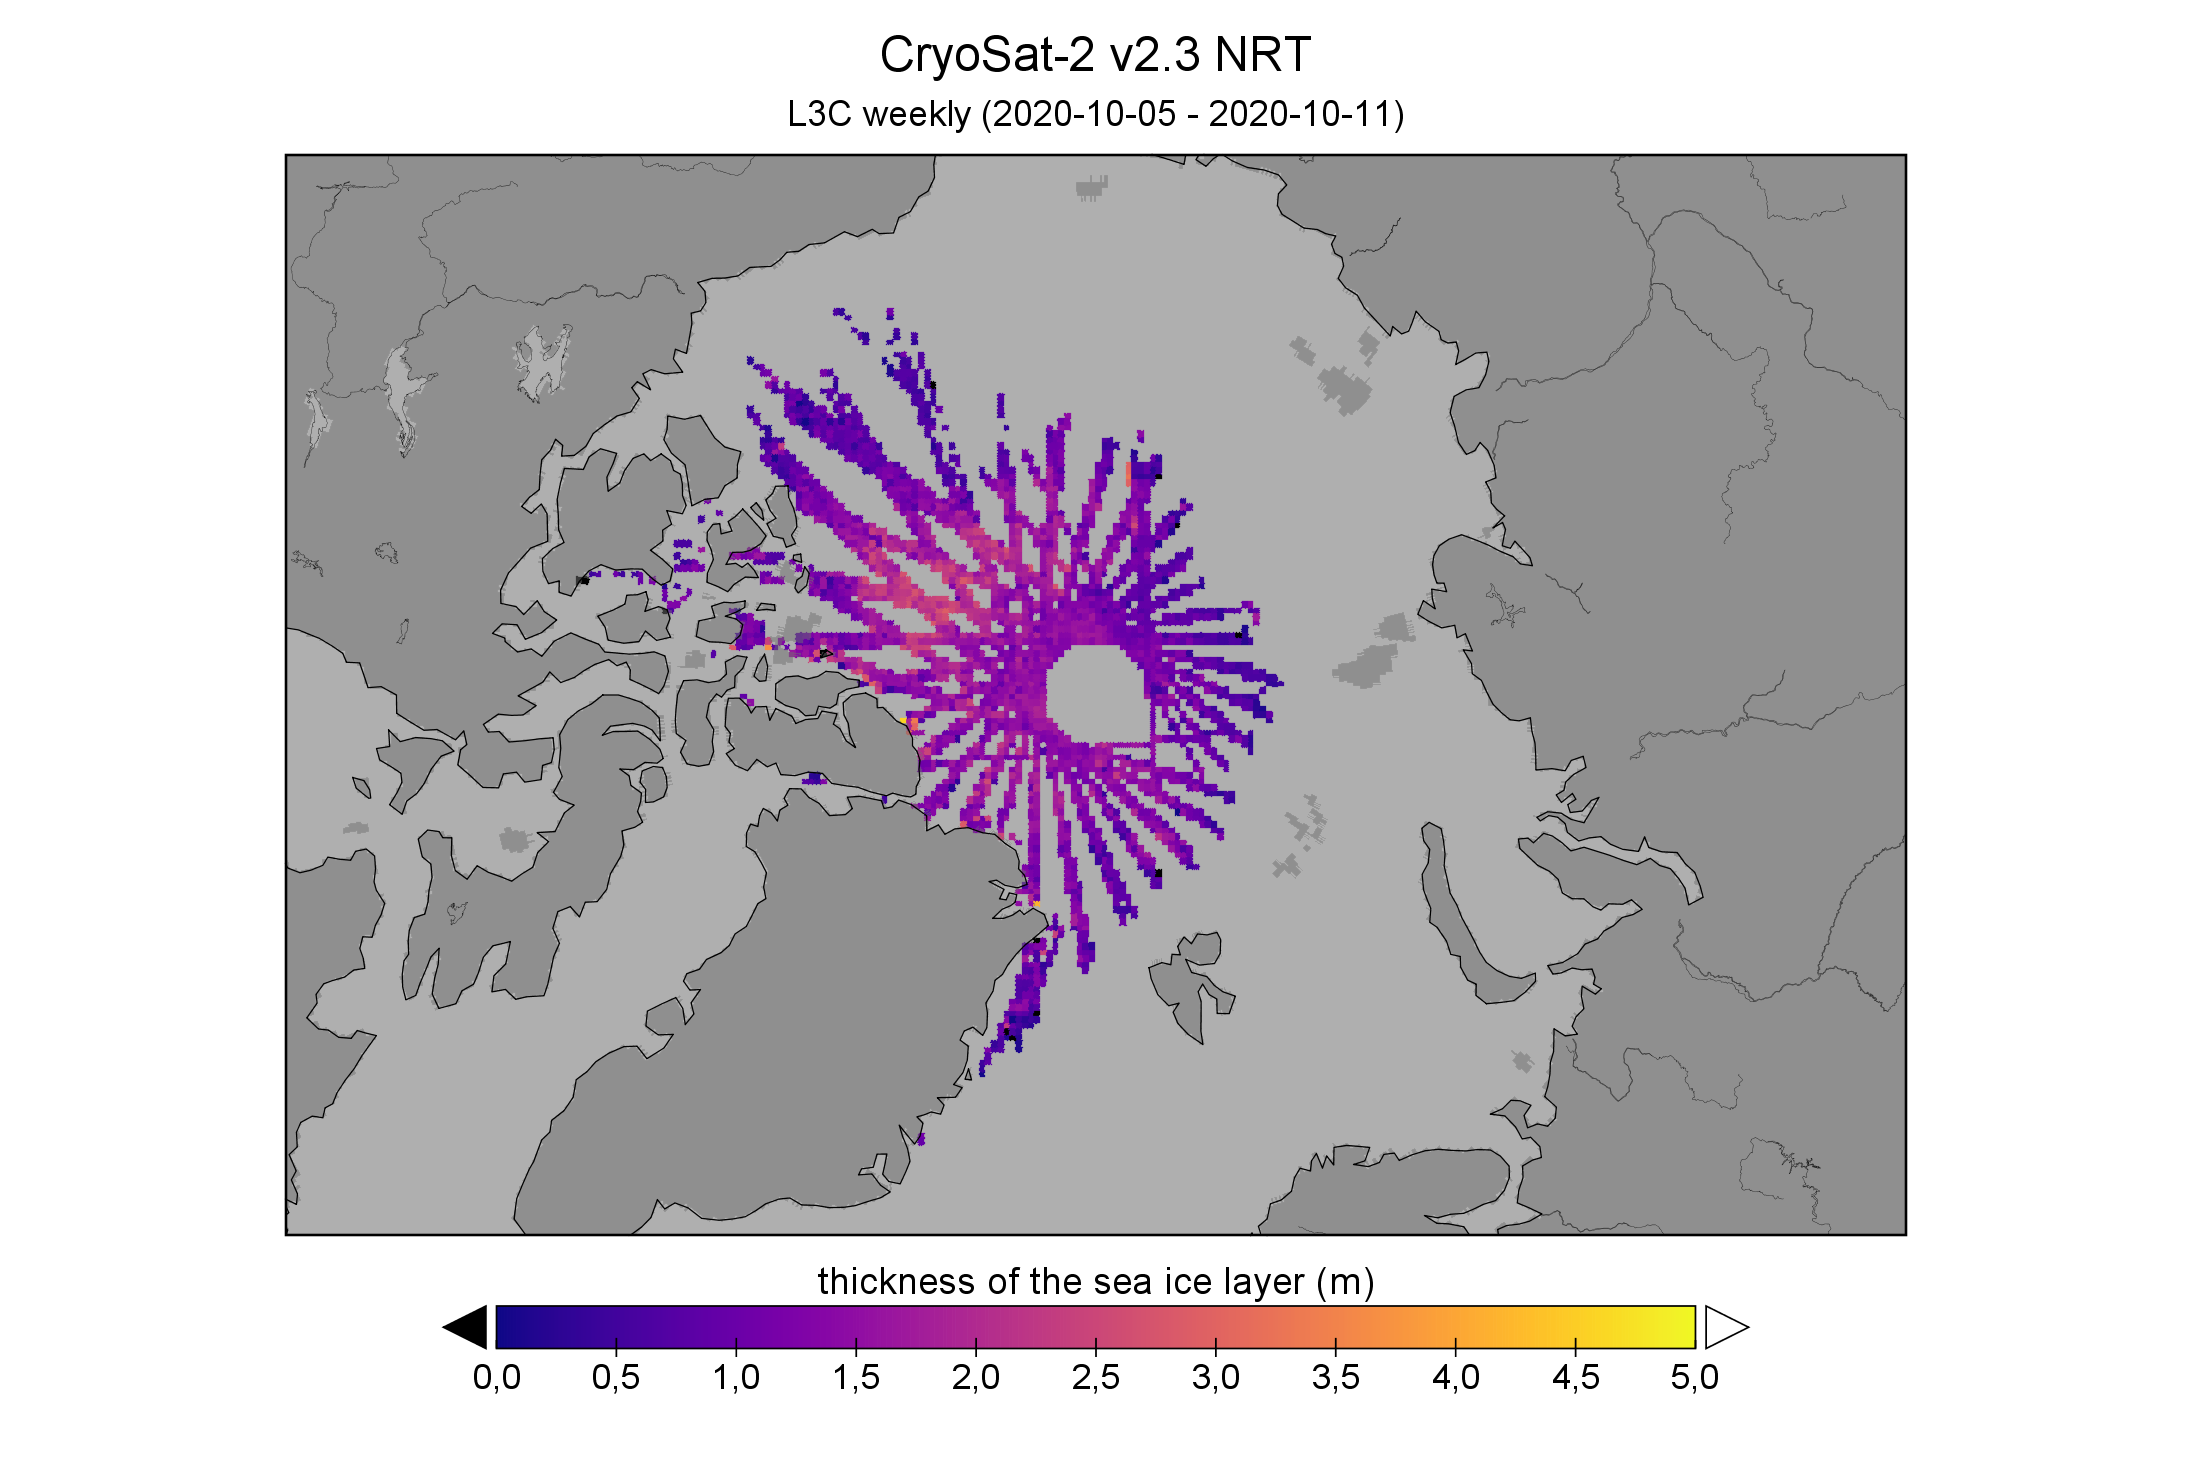
Gridded sea-ice thickness from near-real time CryoSat-2 data in October displays a few orbits with large thickness values in the Russian Arctic (see figure below). These are the result of an anomaly in the processing chain/input data and are under investigation. A temporary solution is to omit the orbits entirely from the daily orbit data until a fix has been developed.
The offline reprocessed (rep) CryoSat-2 data is not affected.
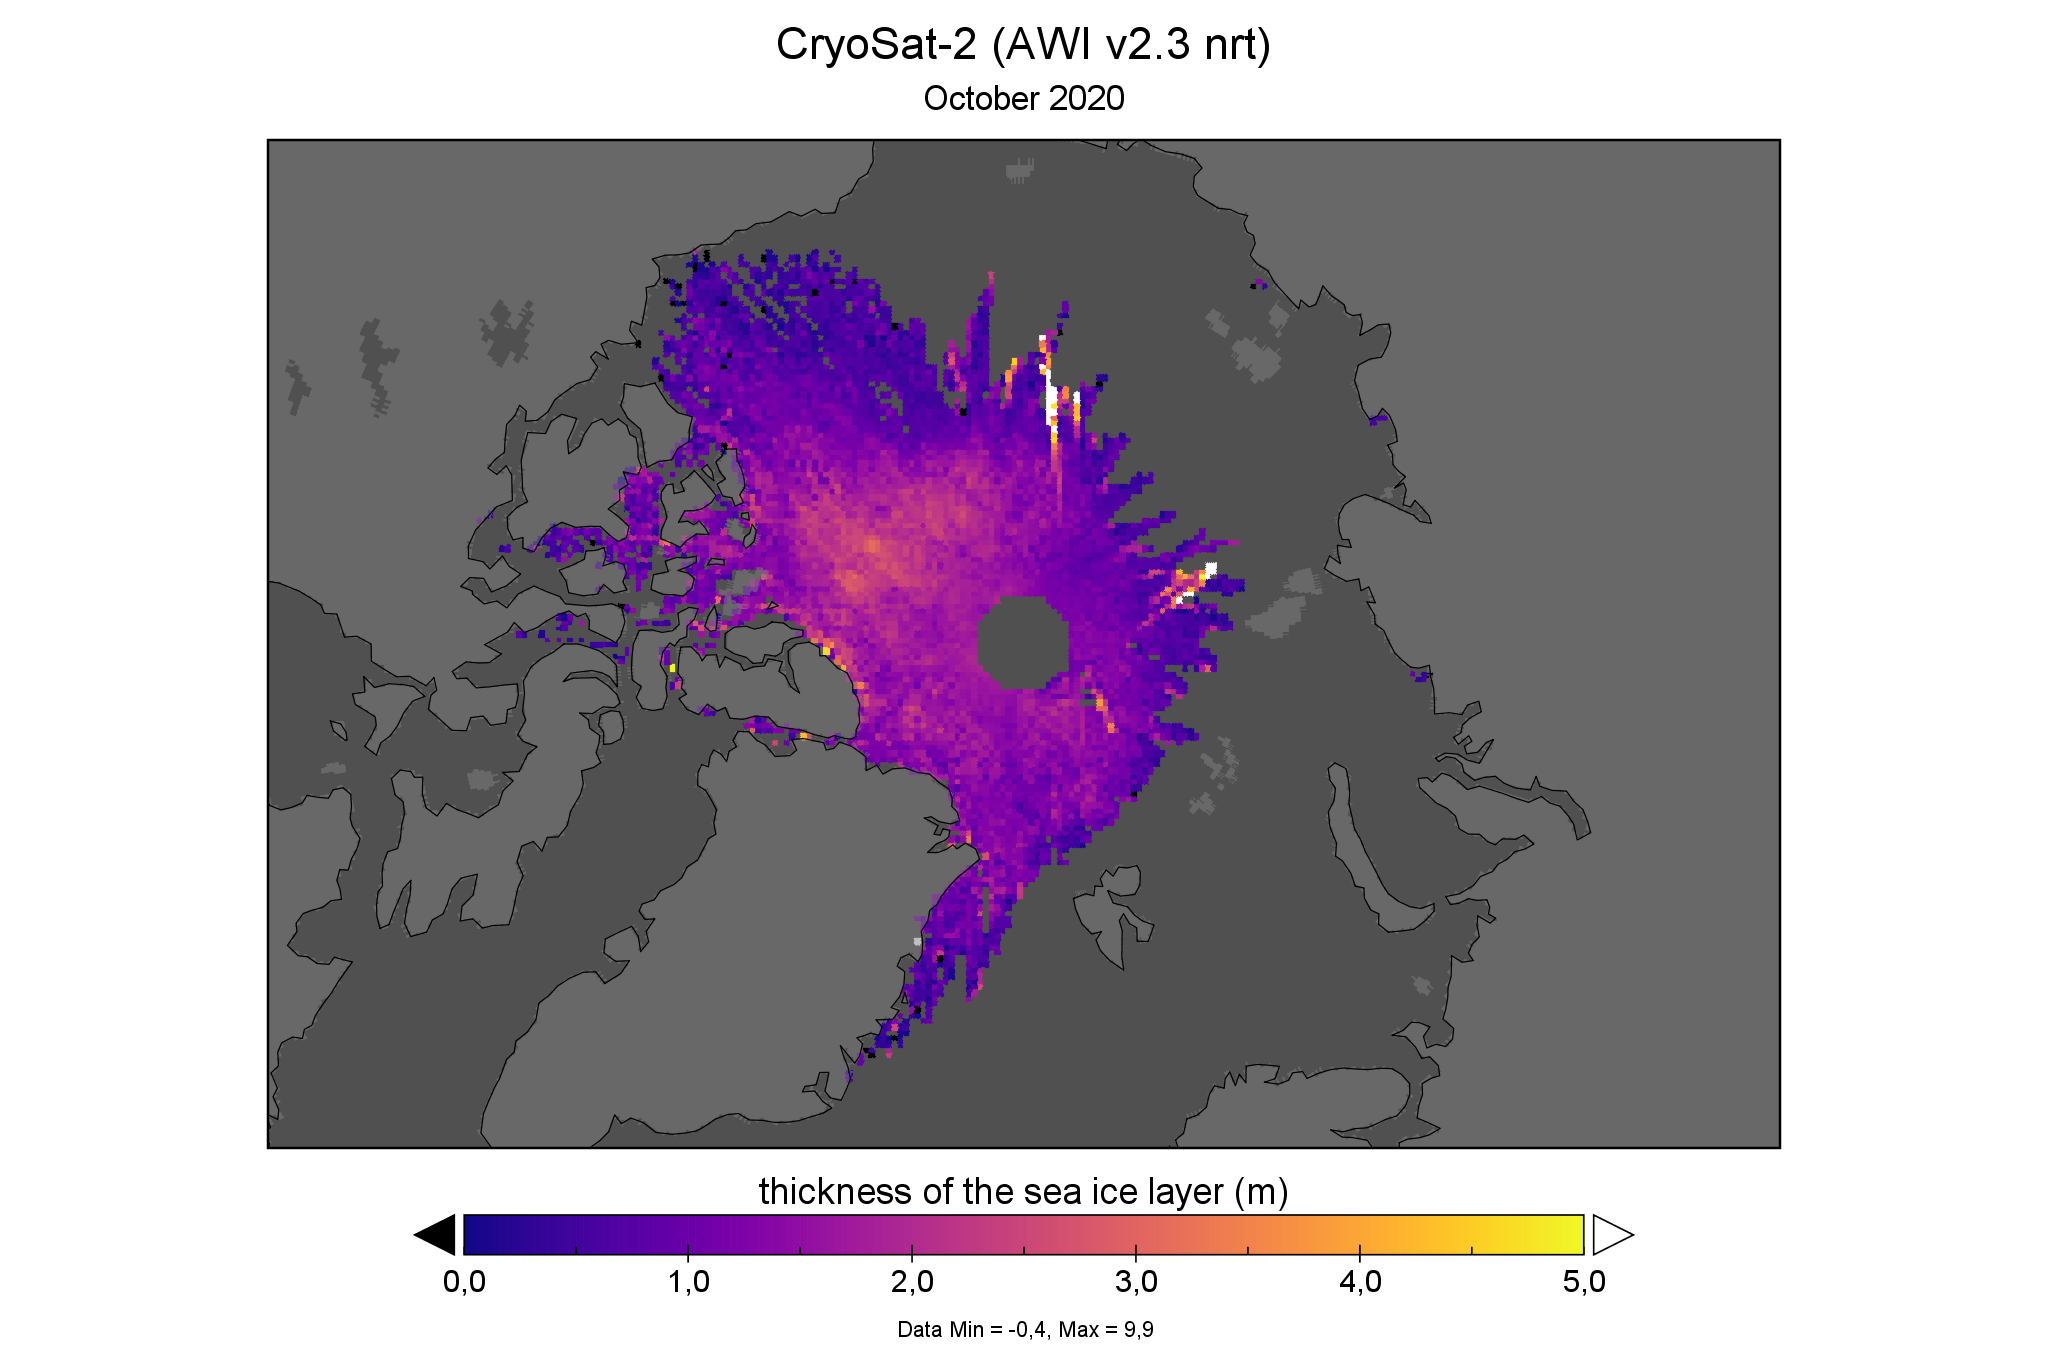
Gridded CryoSat-2 near-real time data from October 2020. Individual orbits in the Russian Arctic stand out with unrealistically high thicknesses
 Daily (incomplete and partially errornous) orbit data from CryoSat-2 near-real time (NRT) data
 Daily (complete) orbit data from CryoSat-2 offline reprocessed (REP) data
Update
The source of the issue has been identified as imprecise satellite altitude values (l1b parameter `alt_20_ku`) since some orbits rely on the predicted orbits (`vector_source: fos predicted`) instead of observed (`vector_source: doris_navigator`). Both orbit solutions differ from the final solution in the offline reprocessed L1b data (`vector_source: doris_precise`), but the altitude of the predicted orbit may vary in the orders of several meters with respect to the final solution. For some orbits this effect is non-linear and negatively effects the estimation of the sea-level anomaly which in turn impacts freeboard and thickness.
As a fix, orbit data with (`vector_source: fos predicted`) will be excluded from the processing leading to reduced data availability in the Russian Arctic.
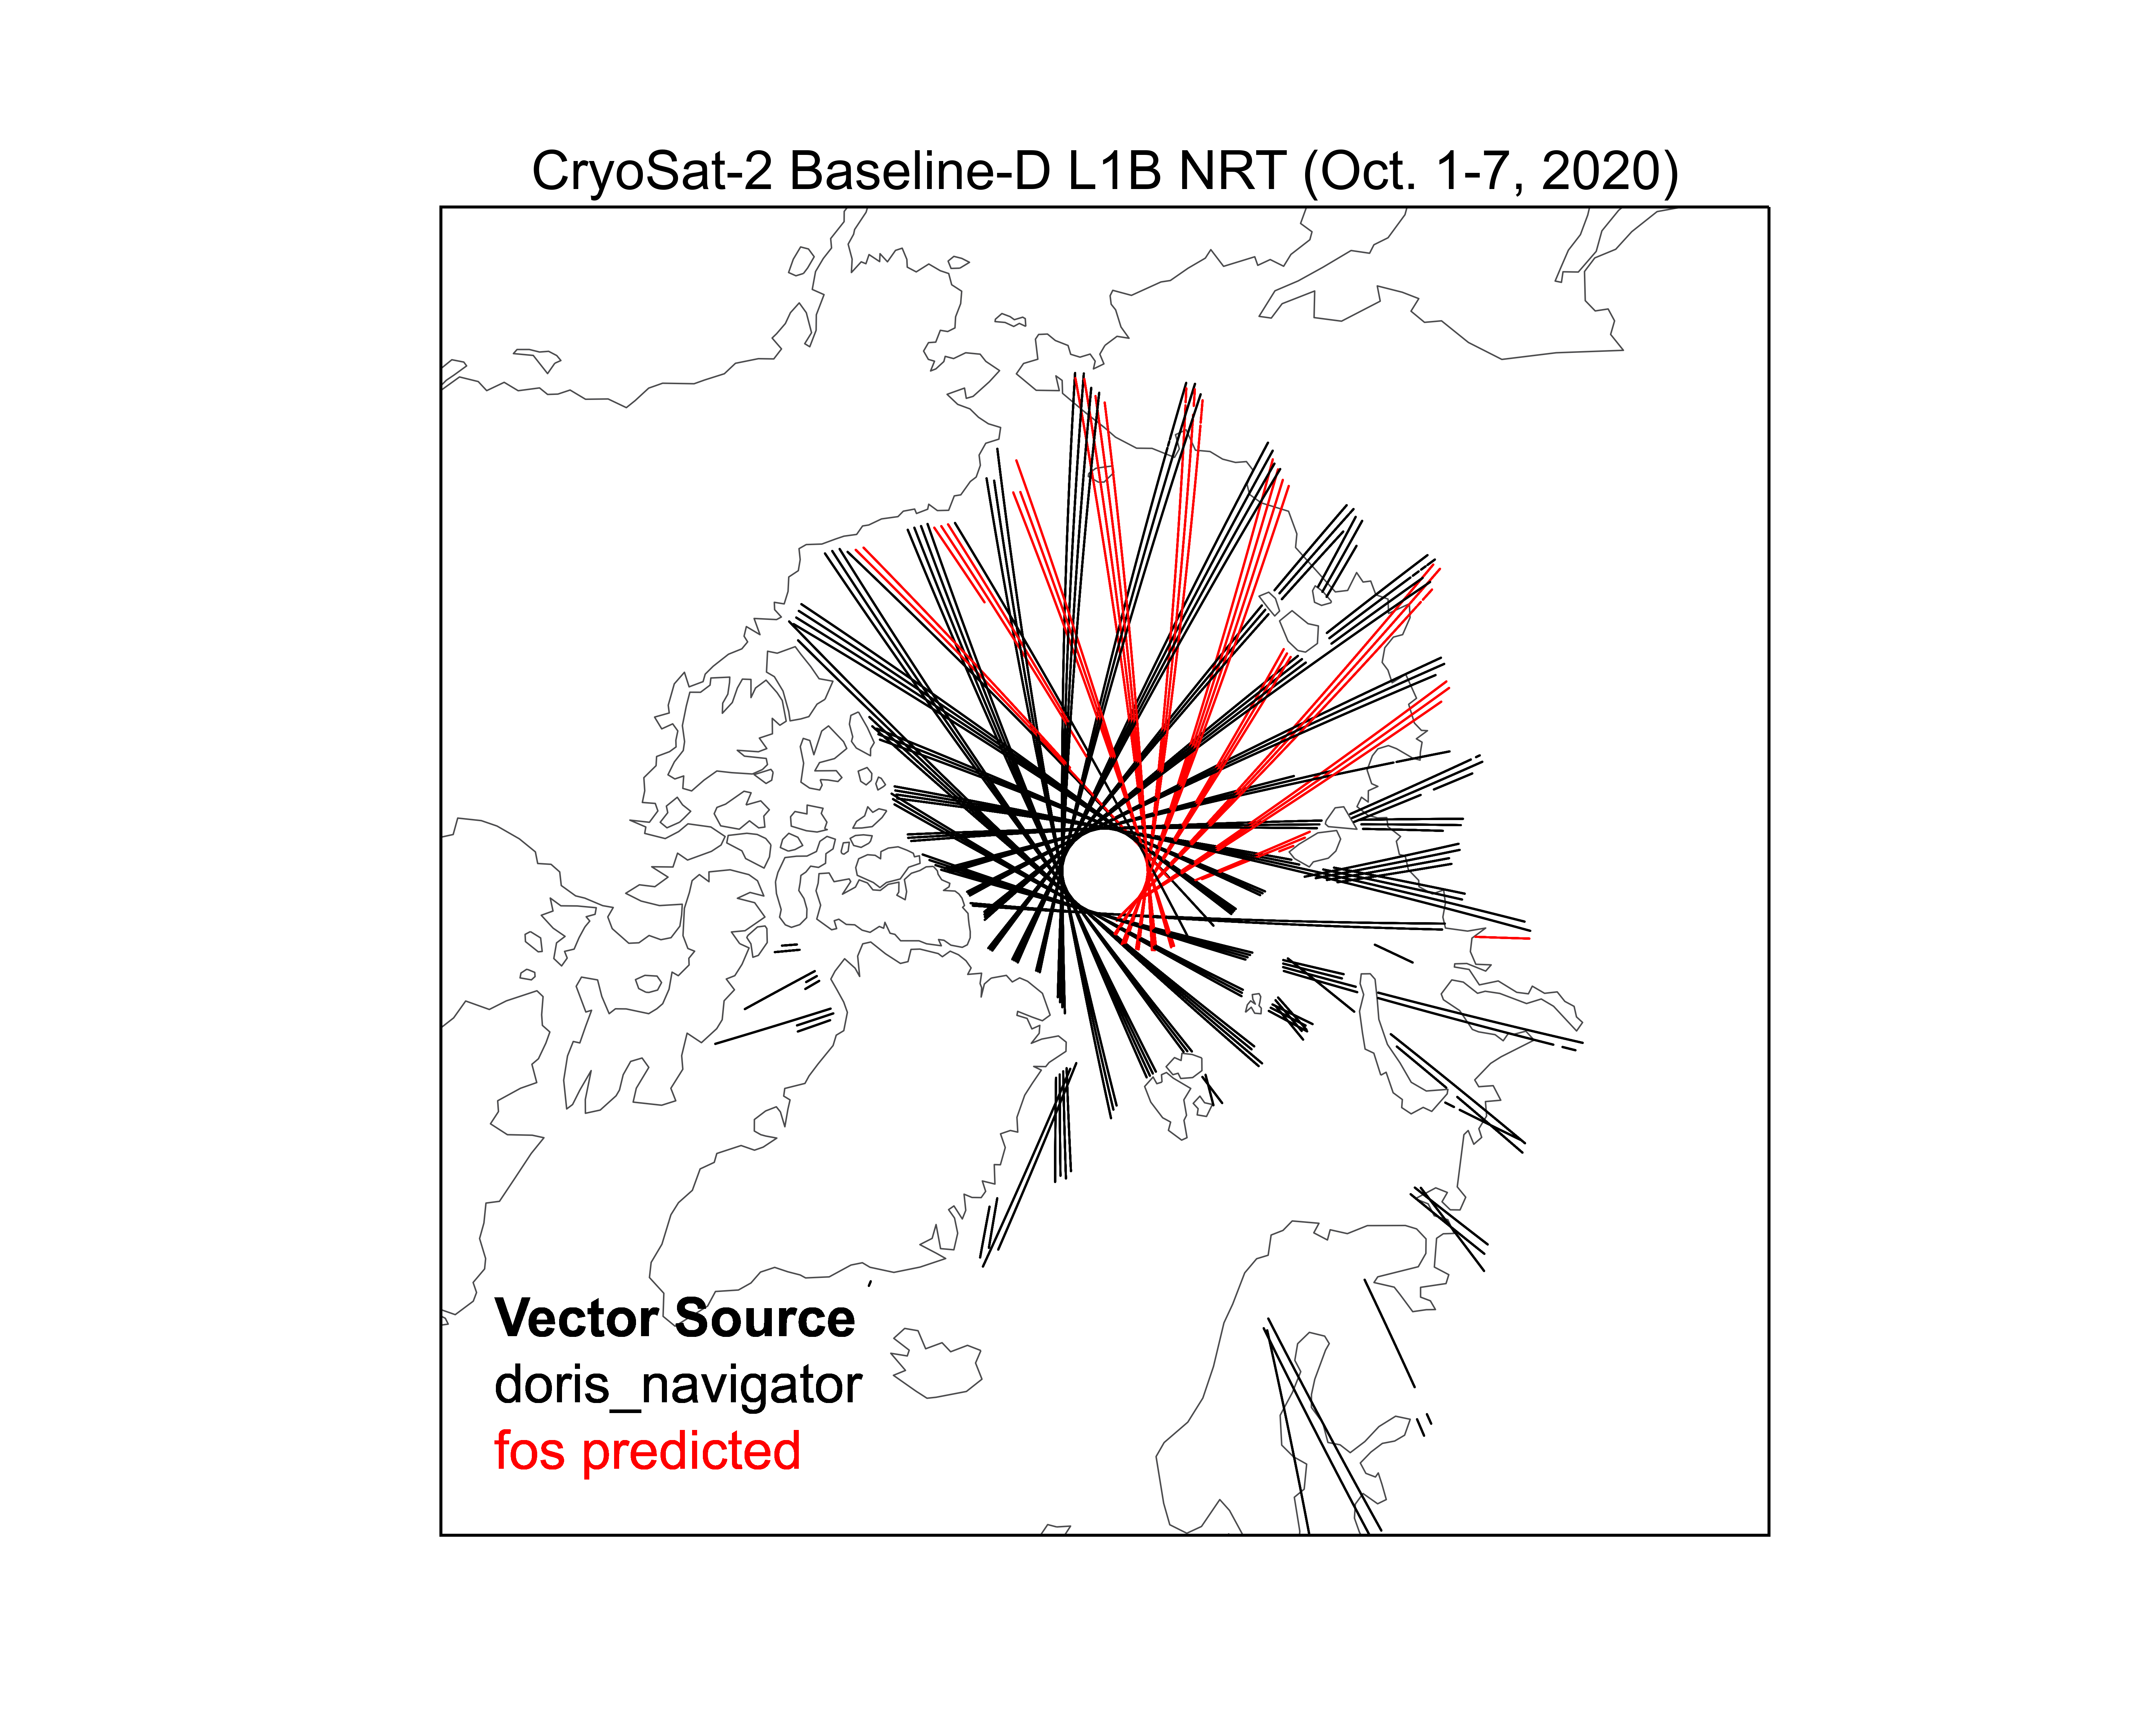 CryoSat-2 NRT L1b orbit trajectory color-coded with source of orbit solution (global attribute `vector_source` in netCDF files)
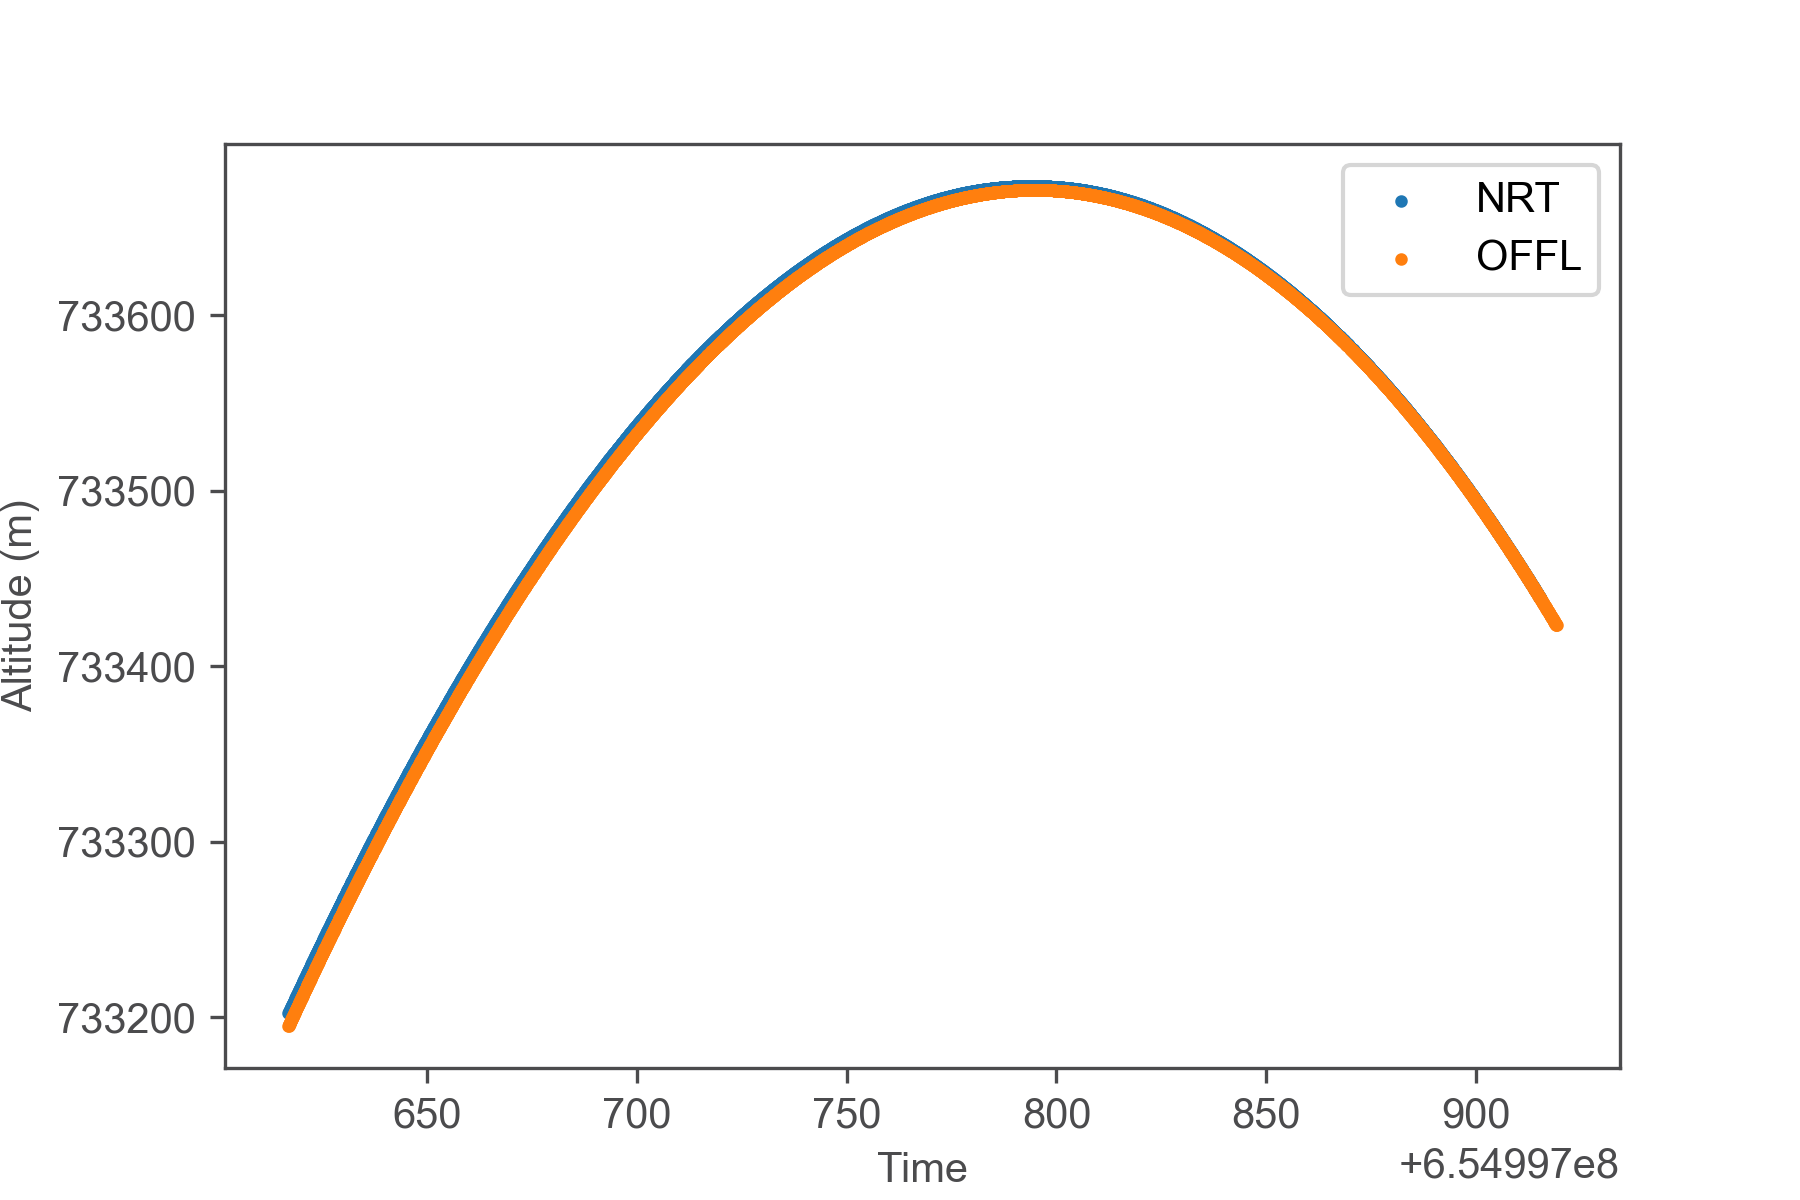
Altitude field (alt_20_ku) vs. time (time_20_ku) for one orbit (absolute orbit number: 55588) compared for NRT and OFFL products. The orbit corresponds to the anomalous freeboard values in the figures above.
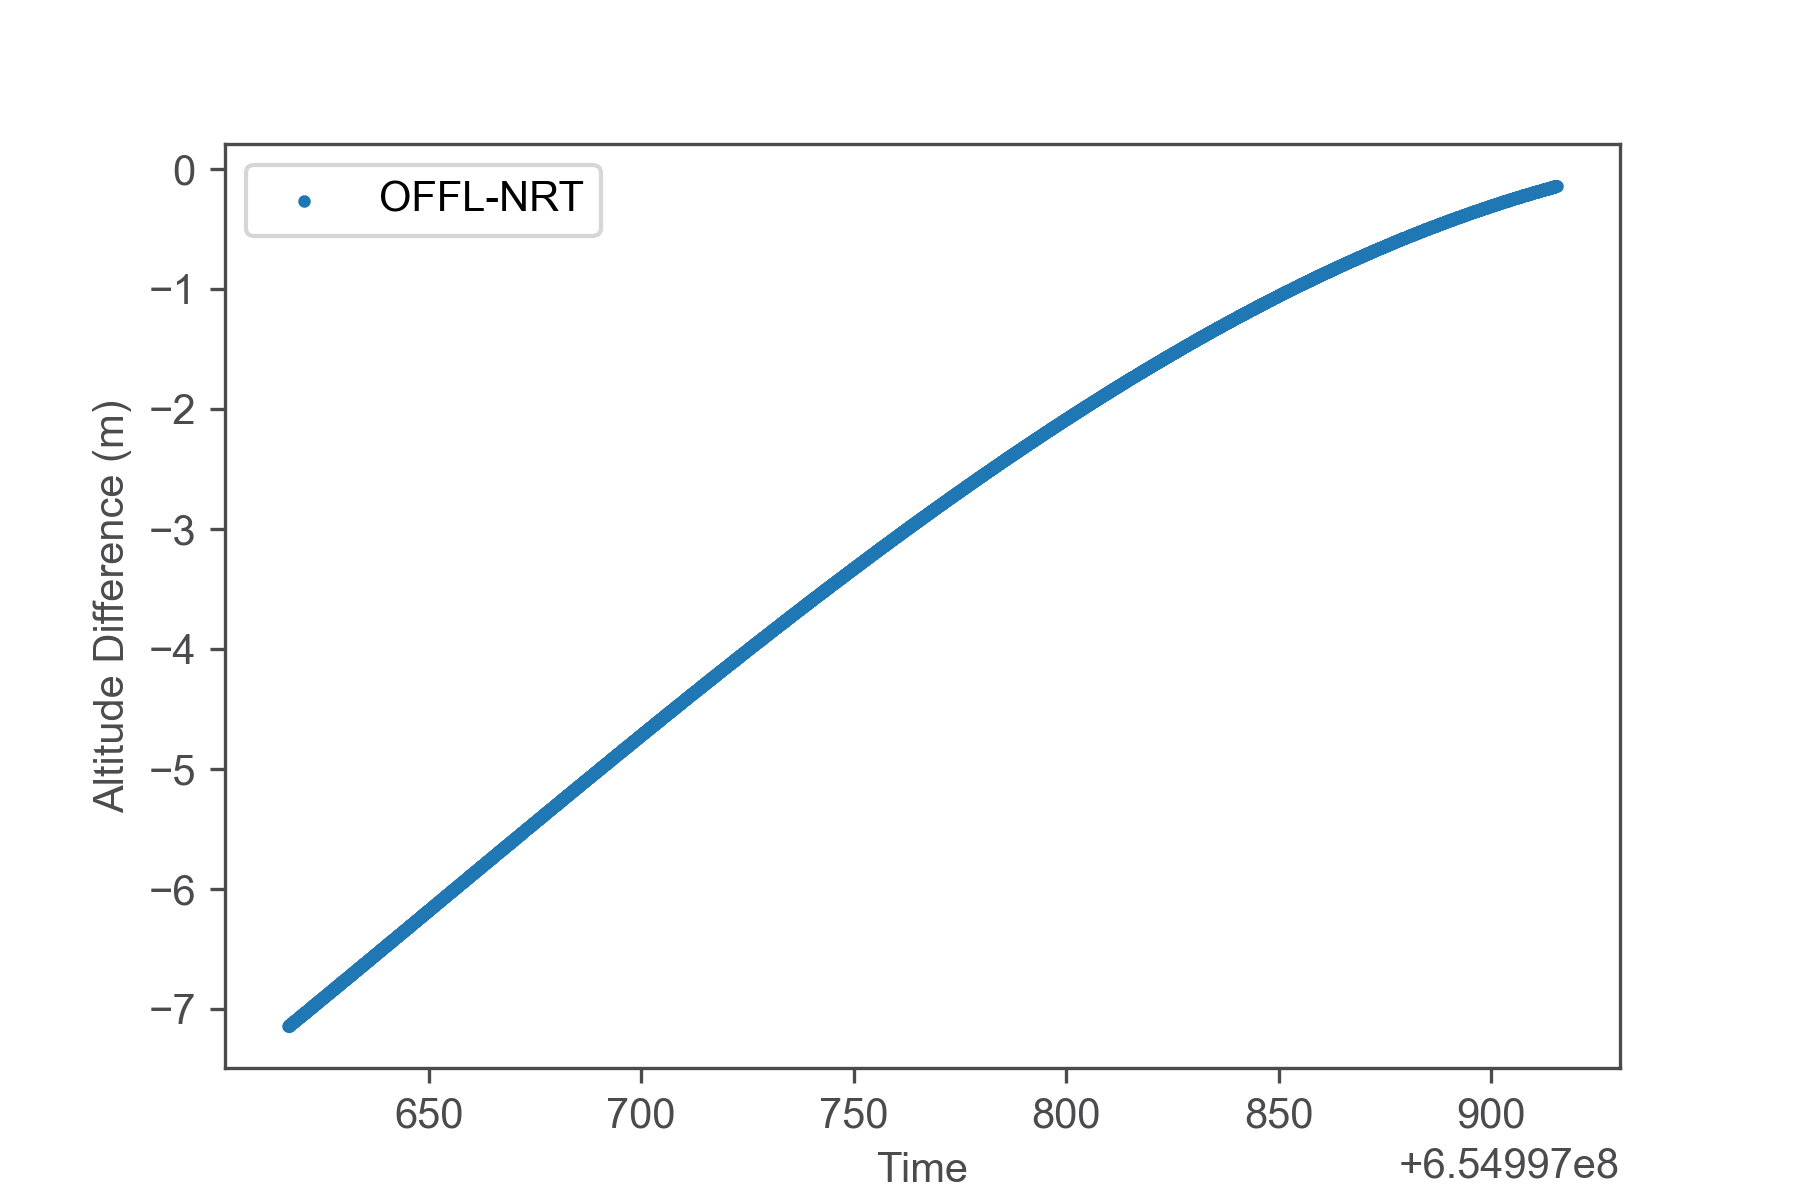 Difference (OFFL-NRT) between both orbit altitude solutions
*Used data files:
- CS_NRT__SIR_SARN1B_20201002T234620_20201002T235118_D001.nc
- CS_OFFL_SIR_SAR_1B_20201002T234620_20201002T235122_D001.nc
The production of operational sea-ice thickness information from near real-time CryoSat-2 data has resumed:
| Near-real time (2 days delay) | |
| Daily Trajectory | l2p_trajectory/Latest (updated daily) |
| Weekly Gridded | l3c_grid/weekly/Latest (updated on Tuesday) |
| Monthly Gridded | l3c_grid/monthly/Latest (Updated on 2nd day of following month) |
Please note that gaps in the NRT input data (see previous blog post) still exist. The production team is in contact with ESA and the investigation is ongoing.
Reprocessed CryoSat-2 data from October will start to become available in the beginning of November.
The start of the AWI CryoSat-2 v2.3 near real-time processing is delayed due to ongoing work on a software issue.
Algorithm Updates
The AWI CryoSat-2 sea-ice product is updated annually and the new version is reprocessed every year in fall and operationally generated from October on. The product version from October 2020 on is v2.3 and it contains the following changes compared to v2.2:
Auxiliary Data
- Switched C3S sea-ice concentration (interim) climate data record from v1.2 to v2.0
- Reverted mean sea surface from DTU18 to DTU15
- Optimized sea-ice type information near coasts and in the Canadian Archipelago
Algorithm
- Updated computation of wavespeed correction in the snow layer according to Mallett et al., 2020
- Used hemisphere-wide snow density values according to Mallett et al., 2020
- Snow depth and density values are updated daily instead of monthly to avoid freeboard and thickness discontinuities at a change of month
- Optimizations in the estimation of along-track sea-level anomaly
Product format and content
- sea level anomaly is now named
sea_level_anomalyinstead ofsea_surface_height_anomaly
Bugfixes
- Fixed an issue that resulted in loss of data for the SARin radar mode (most severe in the Canadian Archipelago)
An update of the Product User guide will be published shortly.
Download Location
The new version of the AWI CryoSat-2 sea ice product can be accessed shortly via the ftp server of the Alfred Wegener Institute:
ftp://ftp.awi.de/sea_ice/product/cryosat2/v2p3/nh/
| Reprocessed (33 days delay) | Near-real time (2 days delay) | |
| Daily Trajectory | l2p_trajectory | l2p_trajectory/Latest |
| Weekly Gridded | l3c_grid/weekly | l3c_grid/weekly/Latest |
| Monthly Gridded | l3c_grid/monthly | l3c_grid/monthly/Latest |
After release, older version are considered deprecated and public access is removed.
The Copernicus Climate Change Services (C3S) interim climate data (ICDR) record for sea-ice concentration has been discontinued in anticipation of a version update from January 1st, 2020 onwards. This affects the production the CryoSat-2 sea-ice thickness data product with the reprocessed timeliness (+31 days). The source for sea-ice concentration in the data processor has been changed to the designated successor of the C3S sea-ice concentration ICDR: OSI-SAF sea-ice concentration ICDR (OSI-430-b). This presents a minor change of the algorithm, as the new ICDR has a lower resolution (25km) than the C3S ICDR (10km). All sea-ice thickness products based on reprocessed CryoSat-2 data from January 1, 2020 are therefore of version 2.2.1. The near-real time sea-ice thickness product is not affected, as it uses OSI-SAF operational sea-ice concentration and type input.
An issue has been identified with CryoSat-2 near-realtime (NRT) data for algorithm baseline-D: The NRT Level-1 data to the CryoSat-2 sea ice product is missing several orbits, mostly in the Russian Arctic as can be seen in the figure below. The offline reprocessed data, which trails the NRT data by one month is not affected by this issue. ESA is aware of the problem and in the process of developing a fix that will be implemented at a later stage.
NRT data is available with a delay (timeliness) of 2 days, offline-reprocessed with a delay of 31 days. All users should be aware that any of data products or analysis based on CryoSat-2 NRT sea ice data (tag `nrt` in filename) are currently degraded and should use the reprocessed data stream (tag `rep` in filename) instead.
The merged CryoSat-2/SMOS sea ice data set is also uses CryoSat-2 NRT data and is affected by this issue. The impact on data quality is under investigation as the merging algorithm is forgiving in terms of data gaps.
Any update will be posted on this blog.
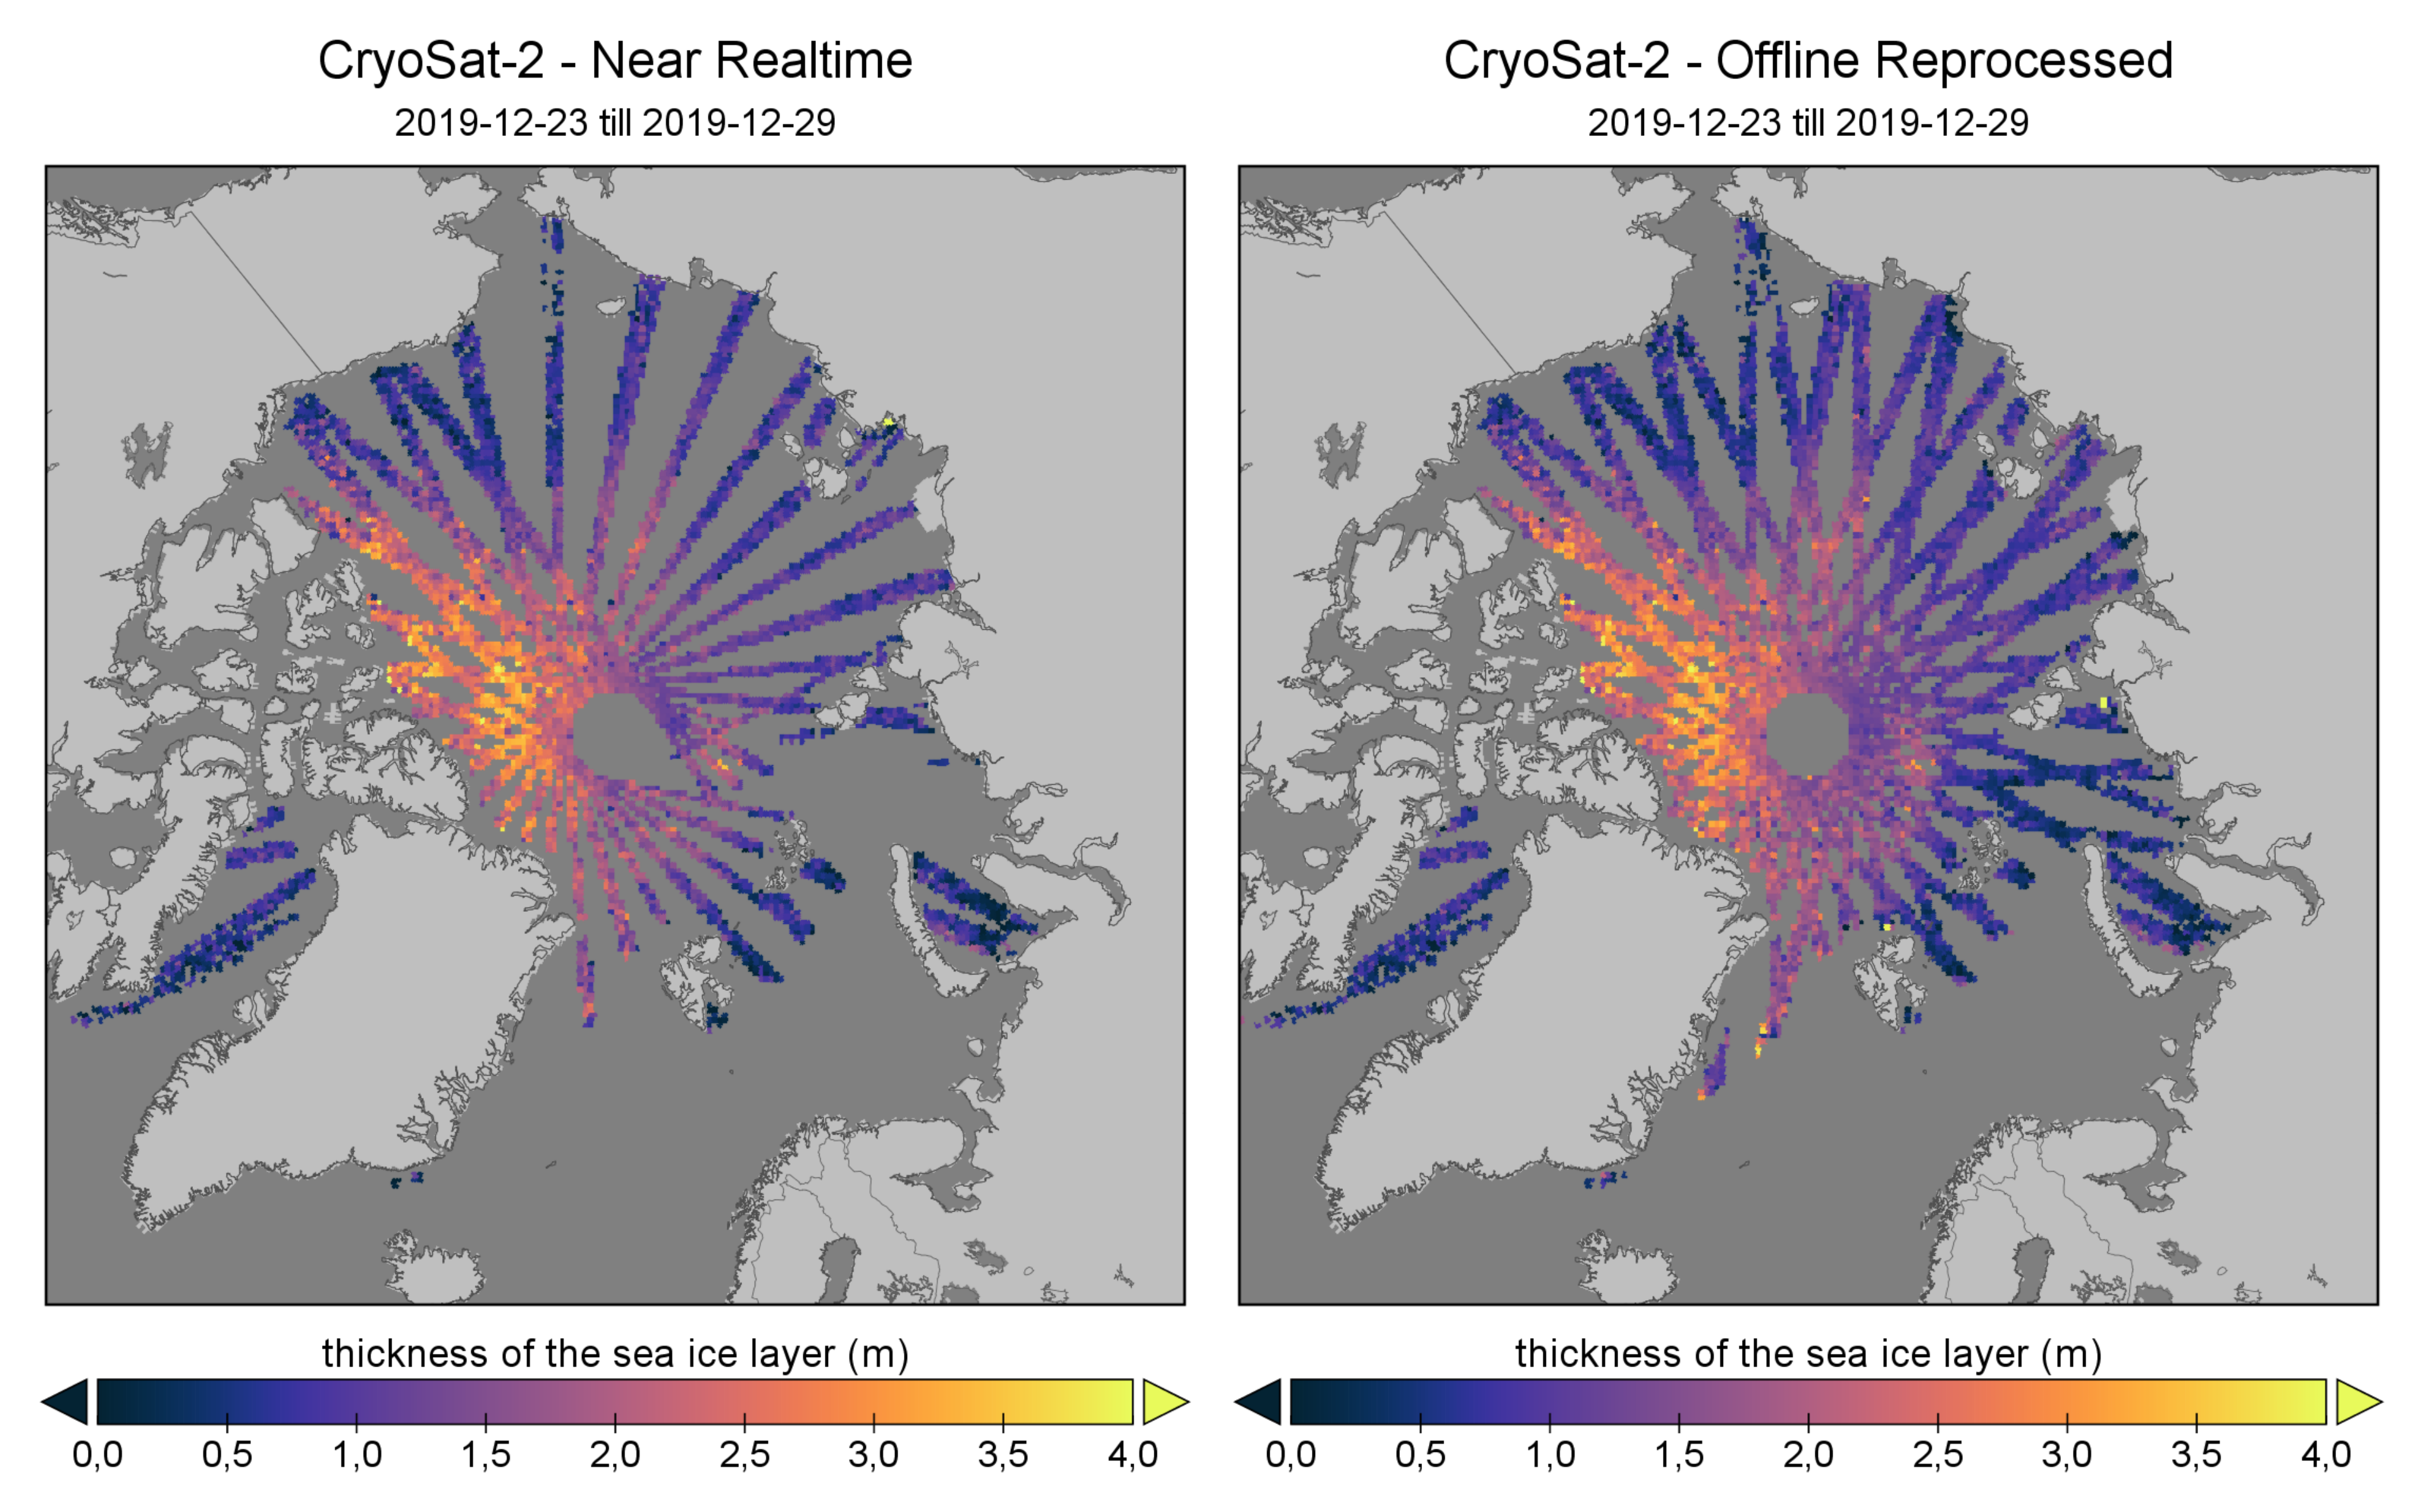 Data coverage of the week between December 23 and 29, 2019 for near-real time data with a timeliness of 2 days (left) and offline reprocessed data with a timeliness of 31 days (right). Data coverage of the offline reprocessed data is nominal, while several orbits are missing in the near-realtime data.
See Data Access for access of NRT and reprocessed CryoSat-2 sea ice data
The reprocessed data record for the AWI CryoSat-2 sea ice product (version 2.2) is now available on the AWI ftp (Nov 2010 - April 2019). The previous version is deprecated and has been remove. Updates of the reprocessed data stream will start with a delay of 33 days in early November and with 2 day delay for the near-real time data stream in early October.
Main Features of new Release
- Update of algorithm and file content
- Sea Ice Thickness GeotTiffs for all weekly and monthly grids
Links:
- FTP link: ftp://ftp.awi.de/sea_ice/product/cryosat2/v2p2/
- AWI CryoSat-2 v2.2 Product User Guide: https://epic.awi.de/id/eprint/50033/
- Changelog for CryoSat-2 algorithm v2.2
The generation of sea-ice thickness from CryoSat-2 will resume in October 2019 with an update of the retrieval algorithm and product content. The changes are listed below:
Altimeter Input Data
- CryoSat-2 baseline-D data as primary altimeter data since April 28, 2019. NOTE: In v2.2 the reprocessed grid products consist of a mix between baseline-C and baseline-D
Auxiliary Data
- Use C3S (interim) climate data records of sea ice concentration as auxiliary data for the reprocessed data stream. This fixes an issue with evolving land masks in the OSI-SAF operational products, which will not be reprocessed to a consistent standard. The C3S sea ice type is also known to be more precise in the marginal ice zone
Level-1 Pre-Processor
- Added support for the new ESA baseline-D netCDF format
- Increased the regional subset from 50N – 88N in version 2.1 to 45N – 88N
Level-2 Processor
- Split algorithm between near-real time and reprocessed with timeliness dependent choice of validation data
- Removed requirement of having a minimum of 3 leads in each orbits.
- Added sea ice draft and sea ice draft uncertainty as output variables
- Renamed freeboard to sea ice freeboard to be in line with the variables standard name
Level-3 Processor
- Added sea ice draft and sea ice draft uncertainty as output variables
- Renamed freeboard to sea ice freeboard to be in line with the variables standard name
- Removed the average Level-2 orbit based uncertainty for radar freeboard, sea-ice freeboard and sea-ice thickness
- All statistical variables are now named with a “stat_” prefix in the variable name for clarity
- Added temporal statistics variables (see Temporal Coverage per grid cell5.2)
- Added the fraction of negative thicknesses per grid cell as statistical parameter
- Added geotiff output (variable sea-ice thickness only) for all gridded products
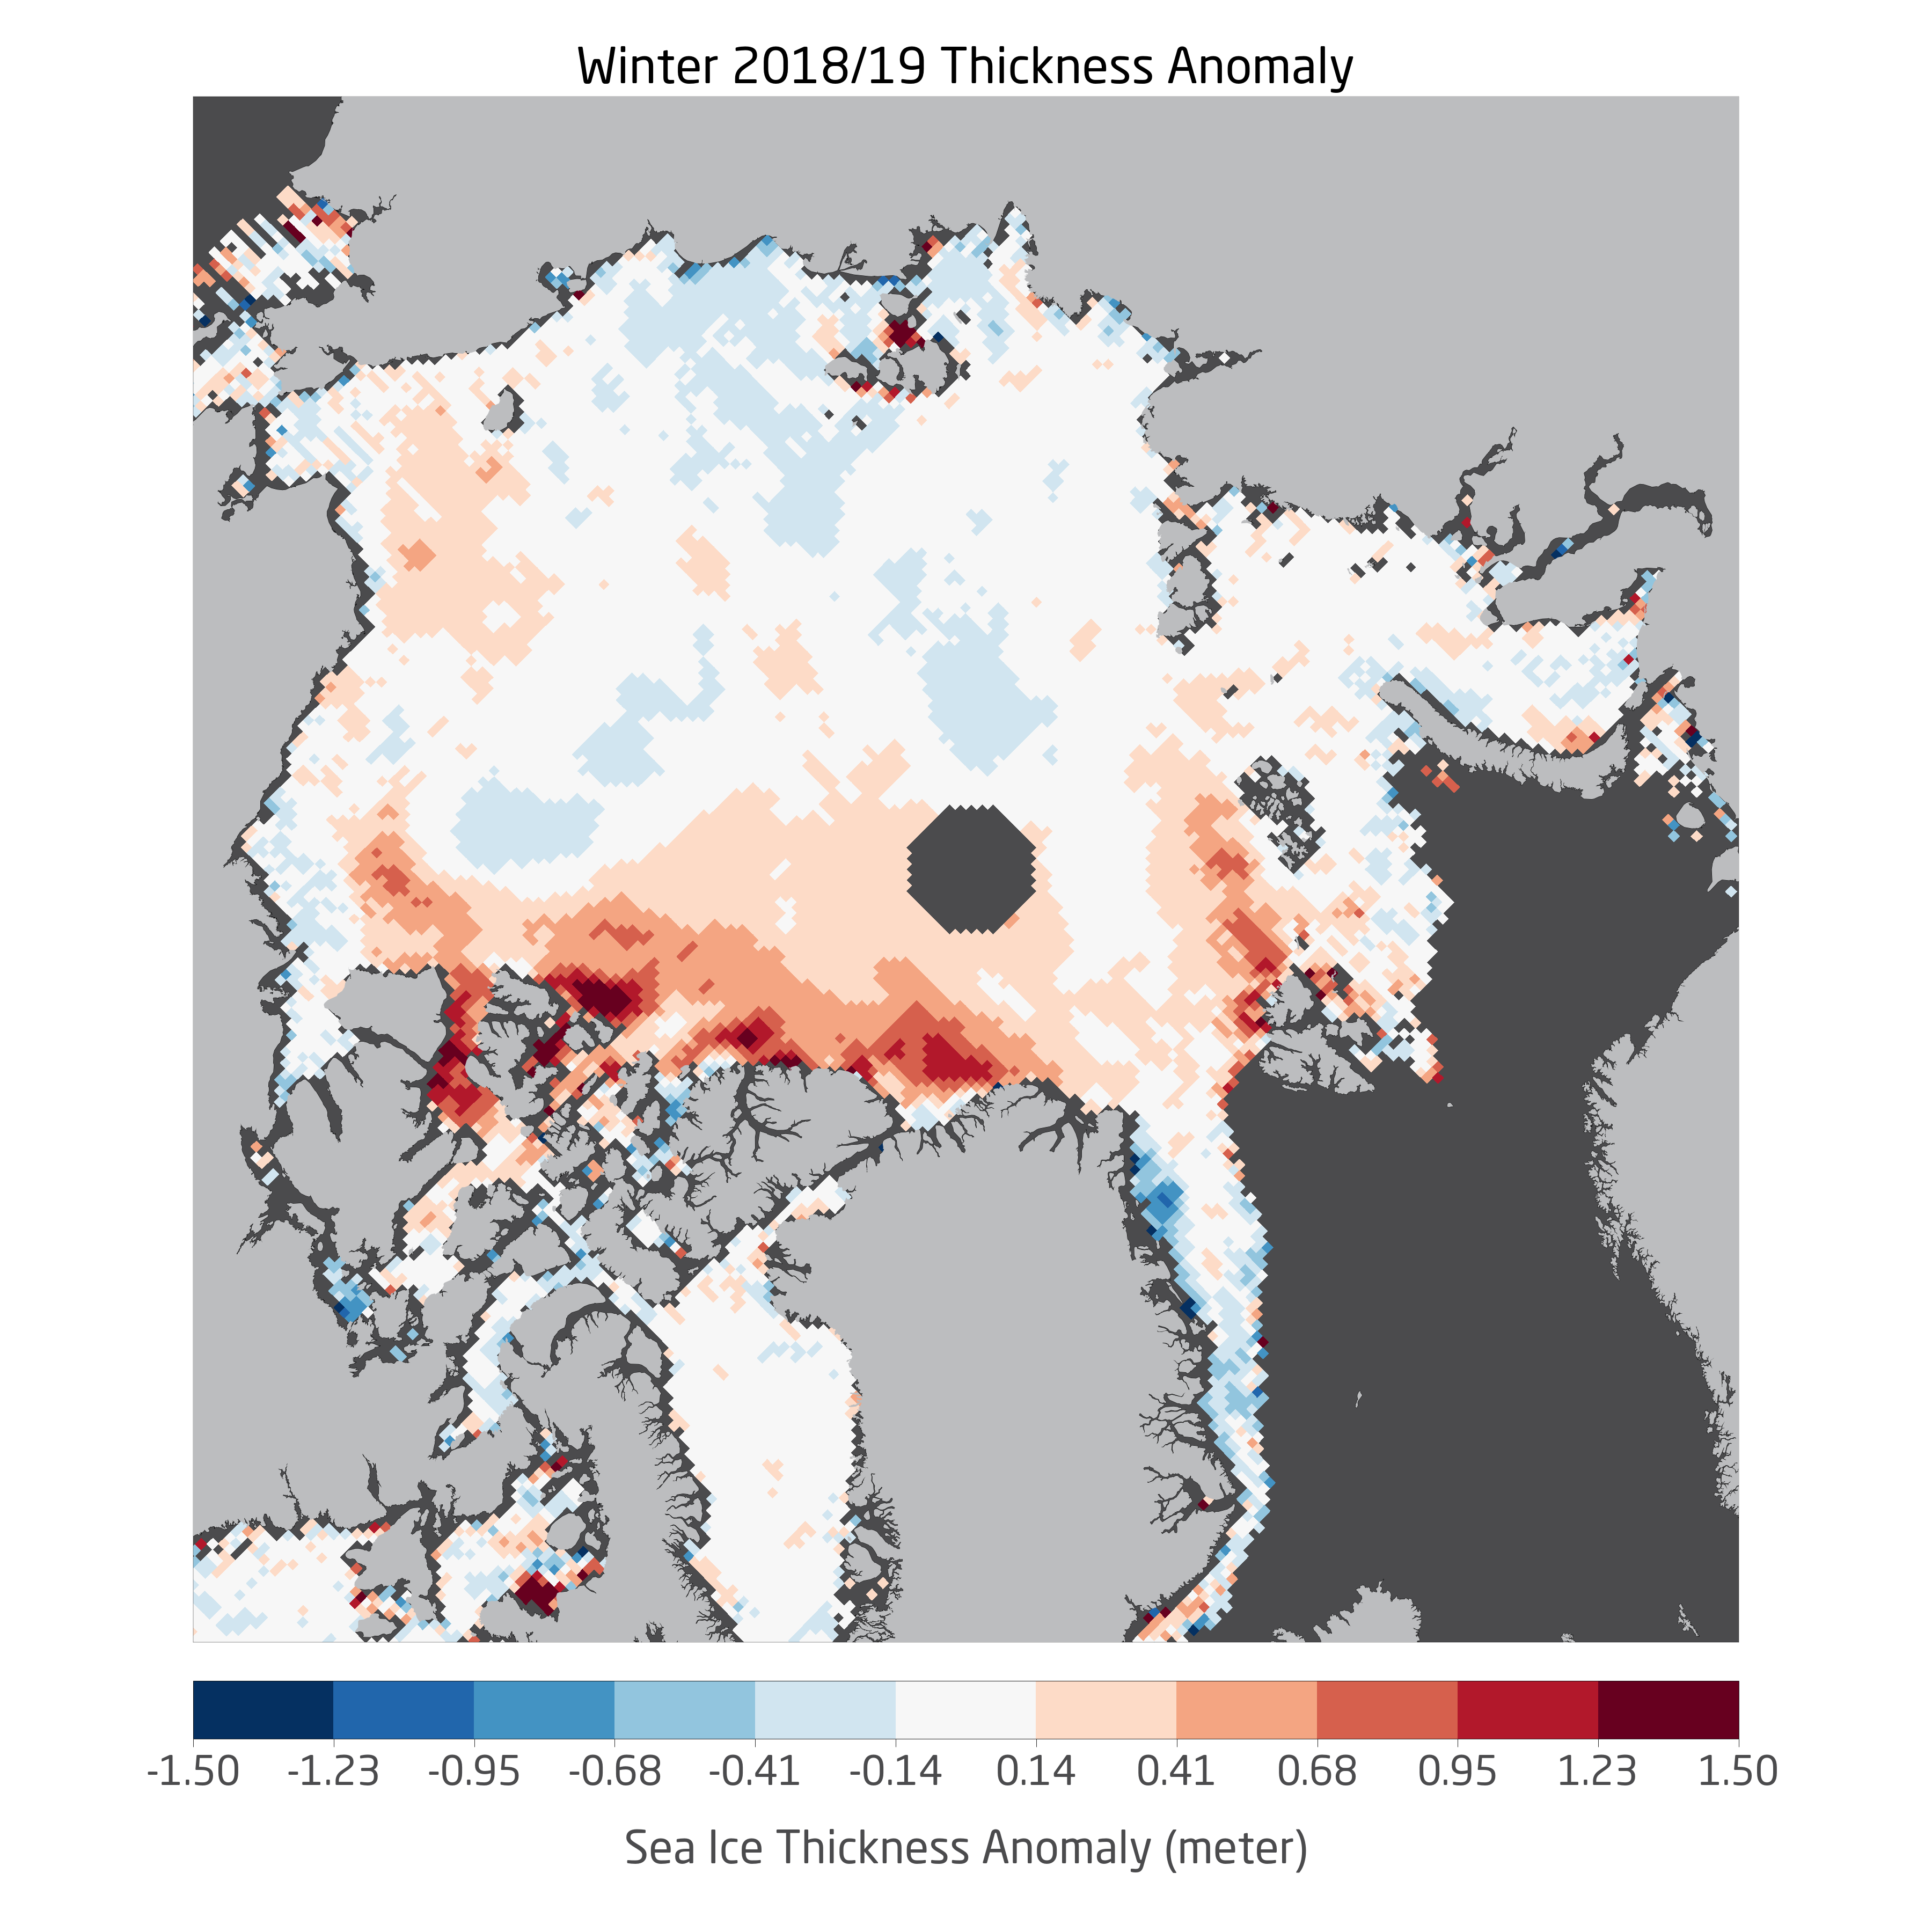
CryoSat-2 has now finished its 9th winter from October to April of Arctic sea ice thickness observations. No sea-ice thickness production is now paused for the month of May through September since the snow is warming and will soon start to melt. The impact of snow melt on the sea-ice thickness retrieval is poorly understood and the production will resume in October 2019 with the next version of CryoSat-2 data.
In resume, the winter season of 2018/2019 is characterized by above average sea ice thickness in the central Arctic basin. The main driver is a notable positive thickness anomaly of the multi-year ice in the Canadian part of the Arctic Ocean. But it is important to stress that the above average mean ice thickness does not directly translate into above average sea ice volume, as mean thickness is only a measure for the remaining sea ice. The extent of sea ice instead has been consistently low over the winter season might rank lower in the last 9 years than mean Arctic Basin thickness.
For the computation of sea ice volume with CryoSat-2 we need to fill in gaps in the data, e.g. near to the north pole above the orbit of the satellite and in other regions which are not covered by observations within a month. Such an interpolated product (data processing level 4) is planned for upcoming versions of the AWI CryoSat-2 sea ice product.
Data Access
See this page for data access
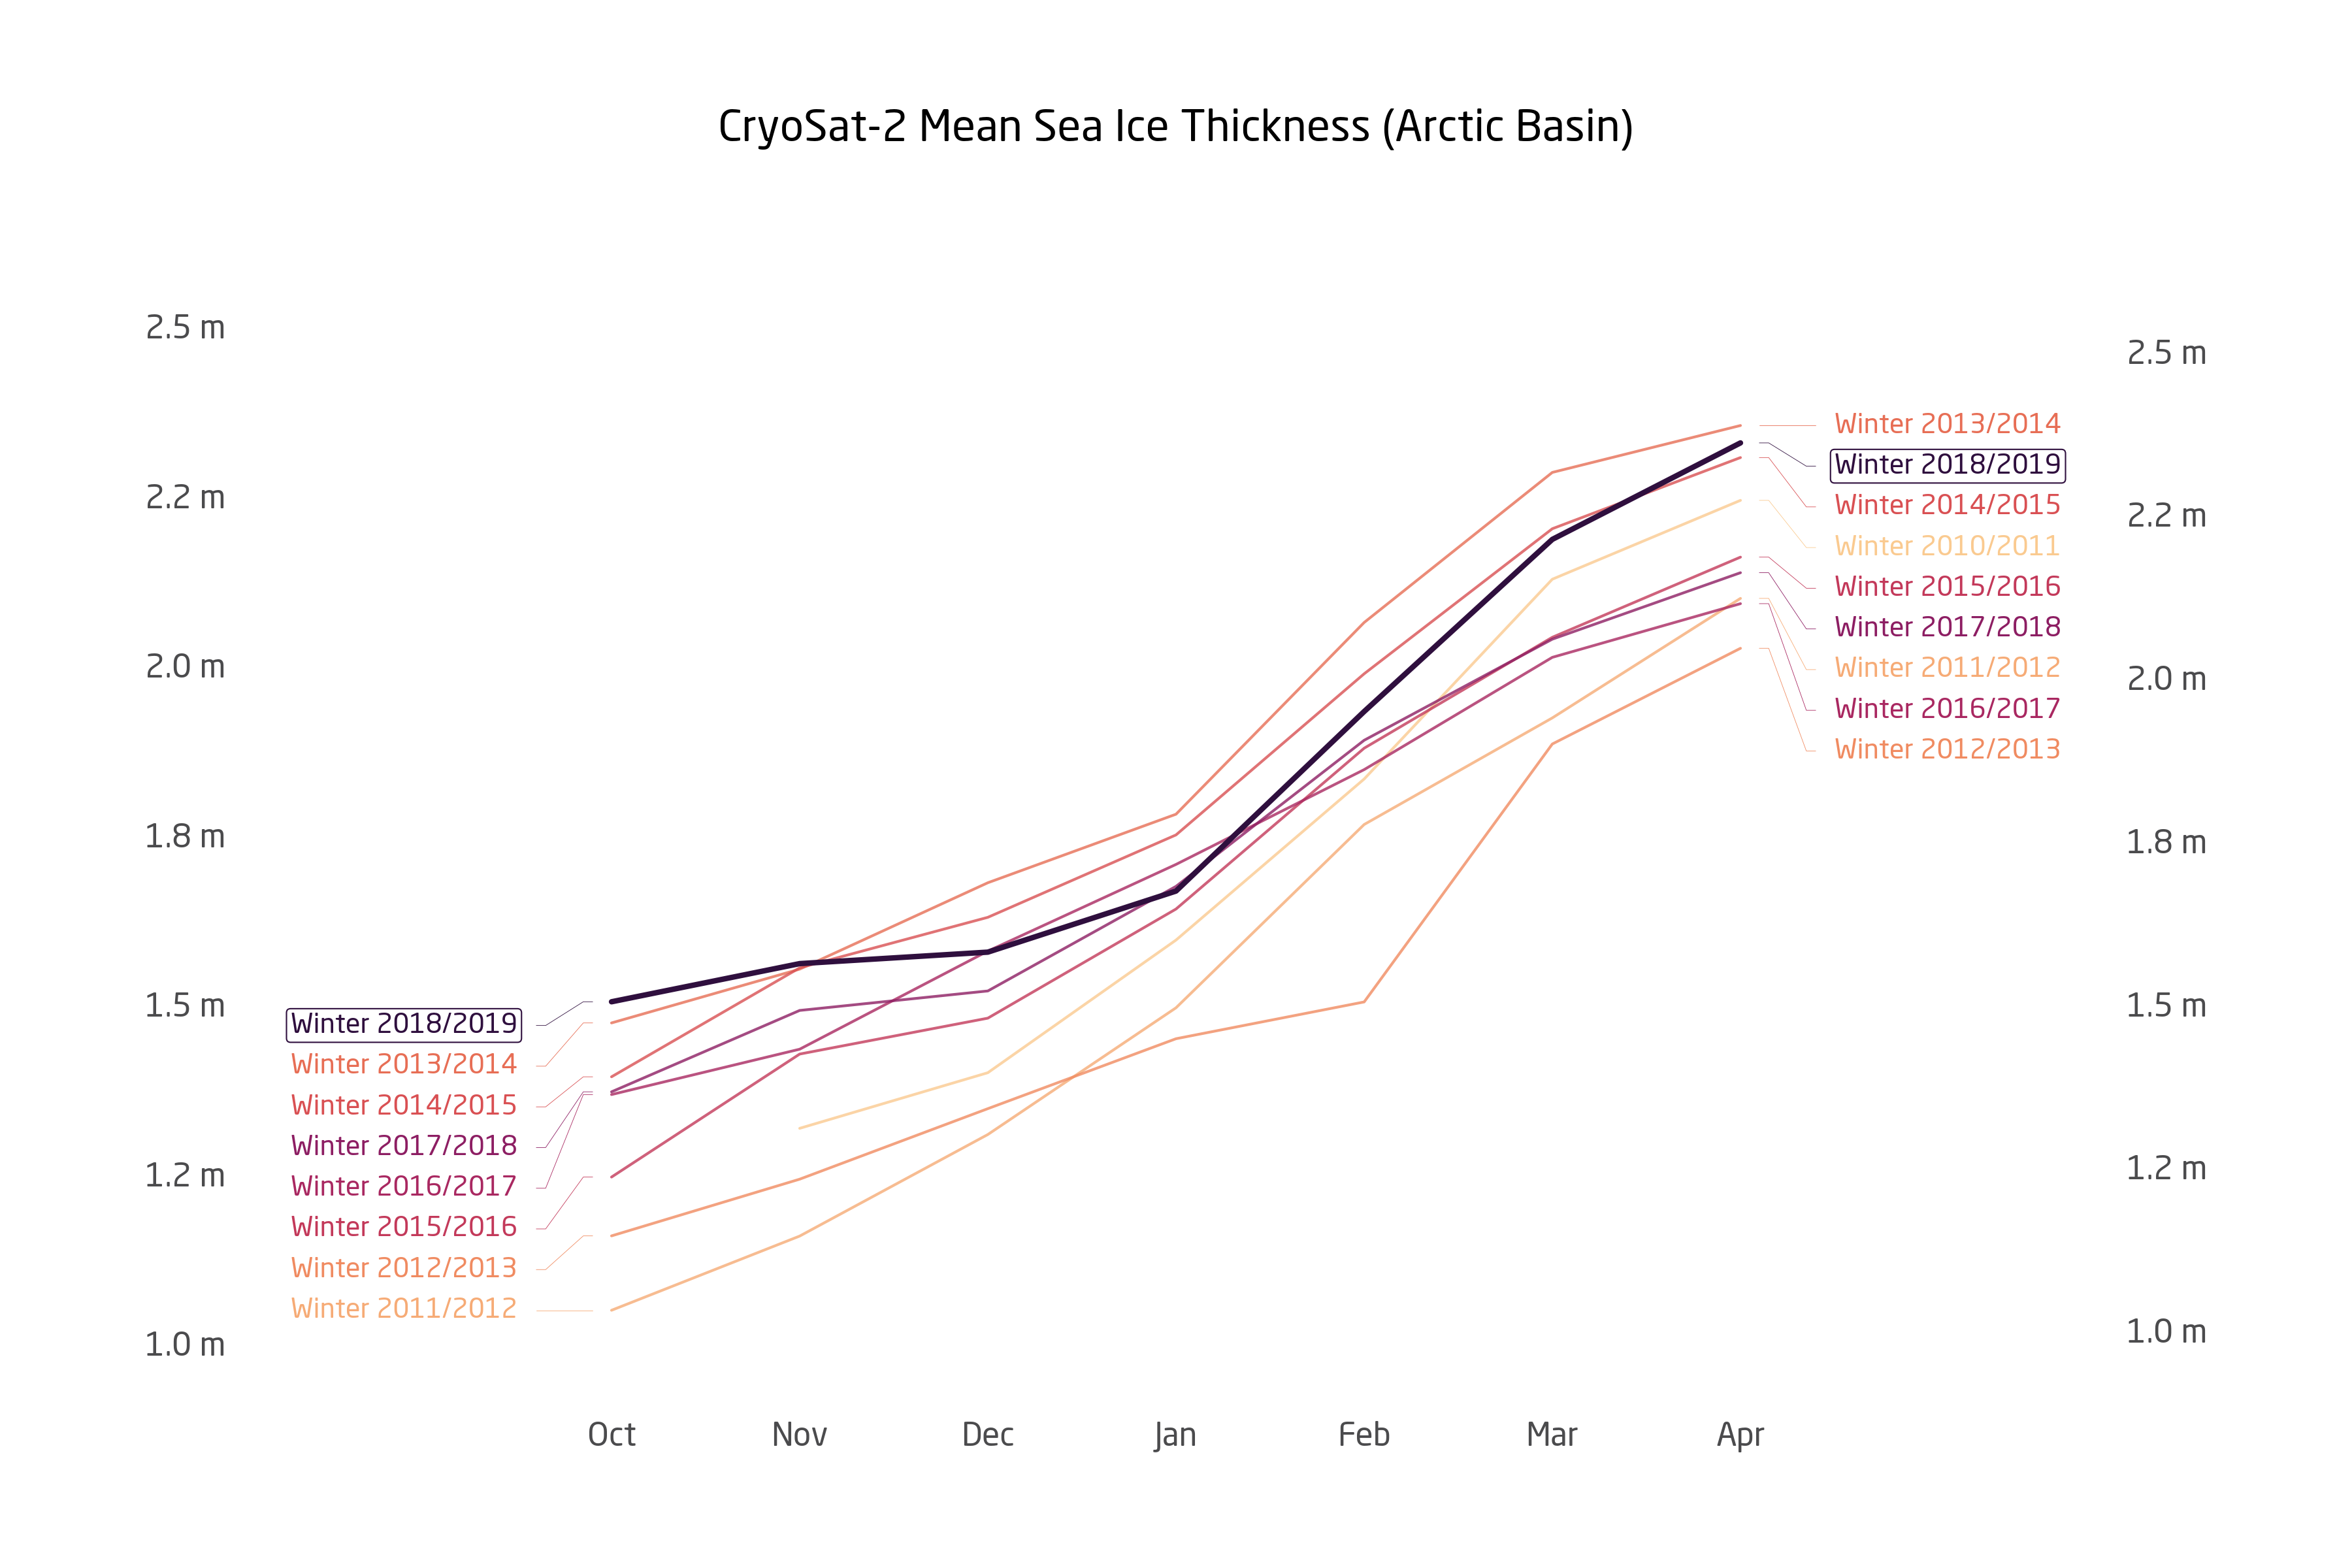
The latest results from CryoSat show that the latest extrema in winter sea ice maximum extent are not necessarily accompanied by a lower mean sea ice thickness of the remaining ice. One factor certainly is that sea ice thickness is a product of thermodynamic ice growth and the acummulated dynamic forces throughout the winter. As a first step in the investigation to what extent dynamic forces have played a role in the last winter, we compare winter mean anomalies of sea ice thickness and ice convergence derived from OSI-SAF data (figures below).
Visual inspection shows that there are two regions where above-average ice convergence and thickness seem to be correlated:
- East Siberian Sea
- Baffin Bay
It must be kept in mind that the convergence anomaly only shows which regions had higher rates of compression. In addition, the analysis is based on monthly mean convergence/divergence estimates, which might not provide an accurate representation on individual events. But the visual comparison can be a starting point for a more detailed physical analysis.
The winter mean thickness anomaly also indicates that regions that had anomalous low sea ice extent this winter (Fram Strait, Bering Sea) also have a negative ice thickness anomaly.
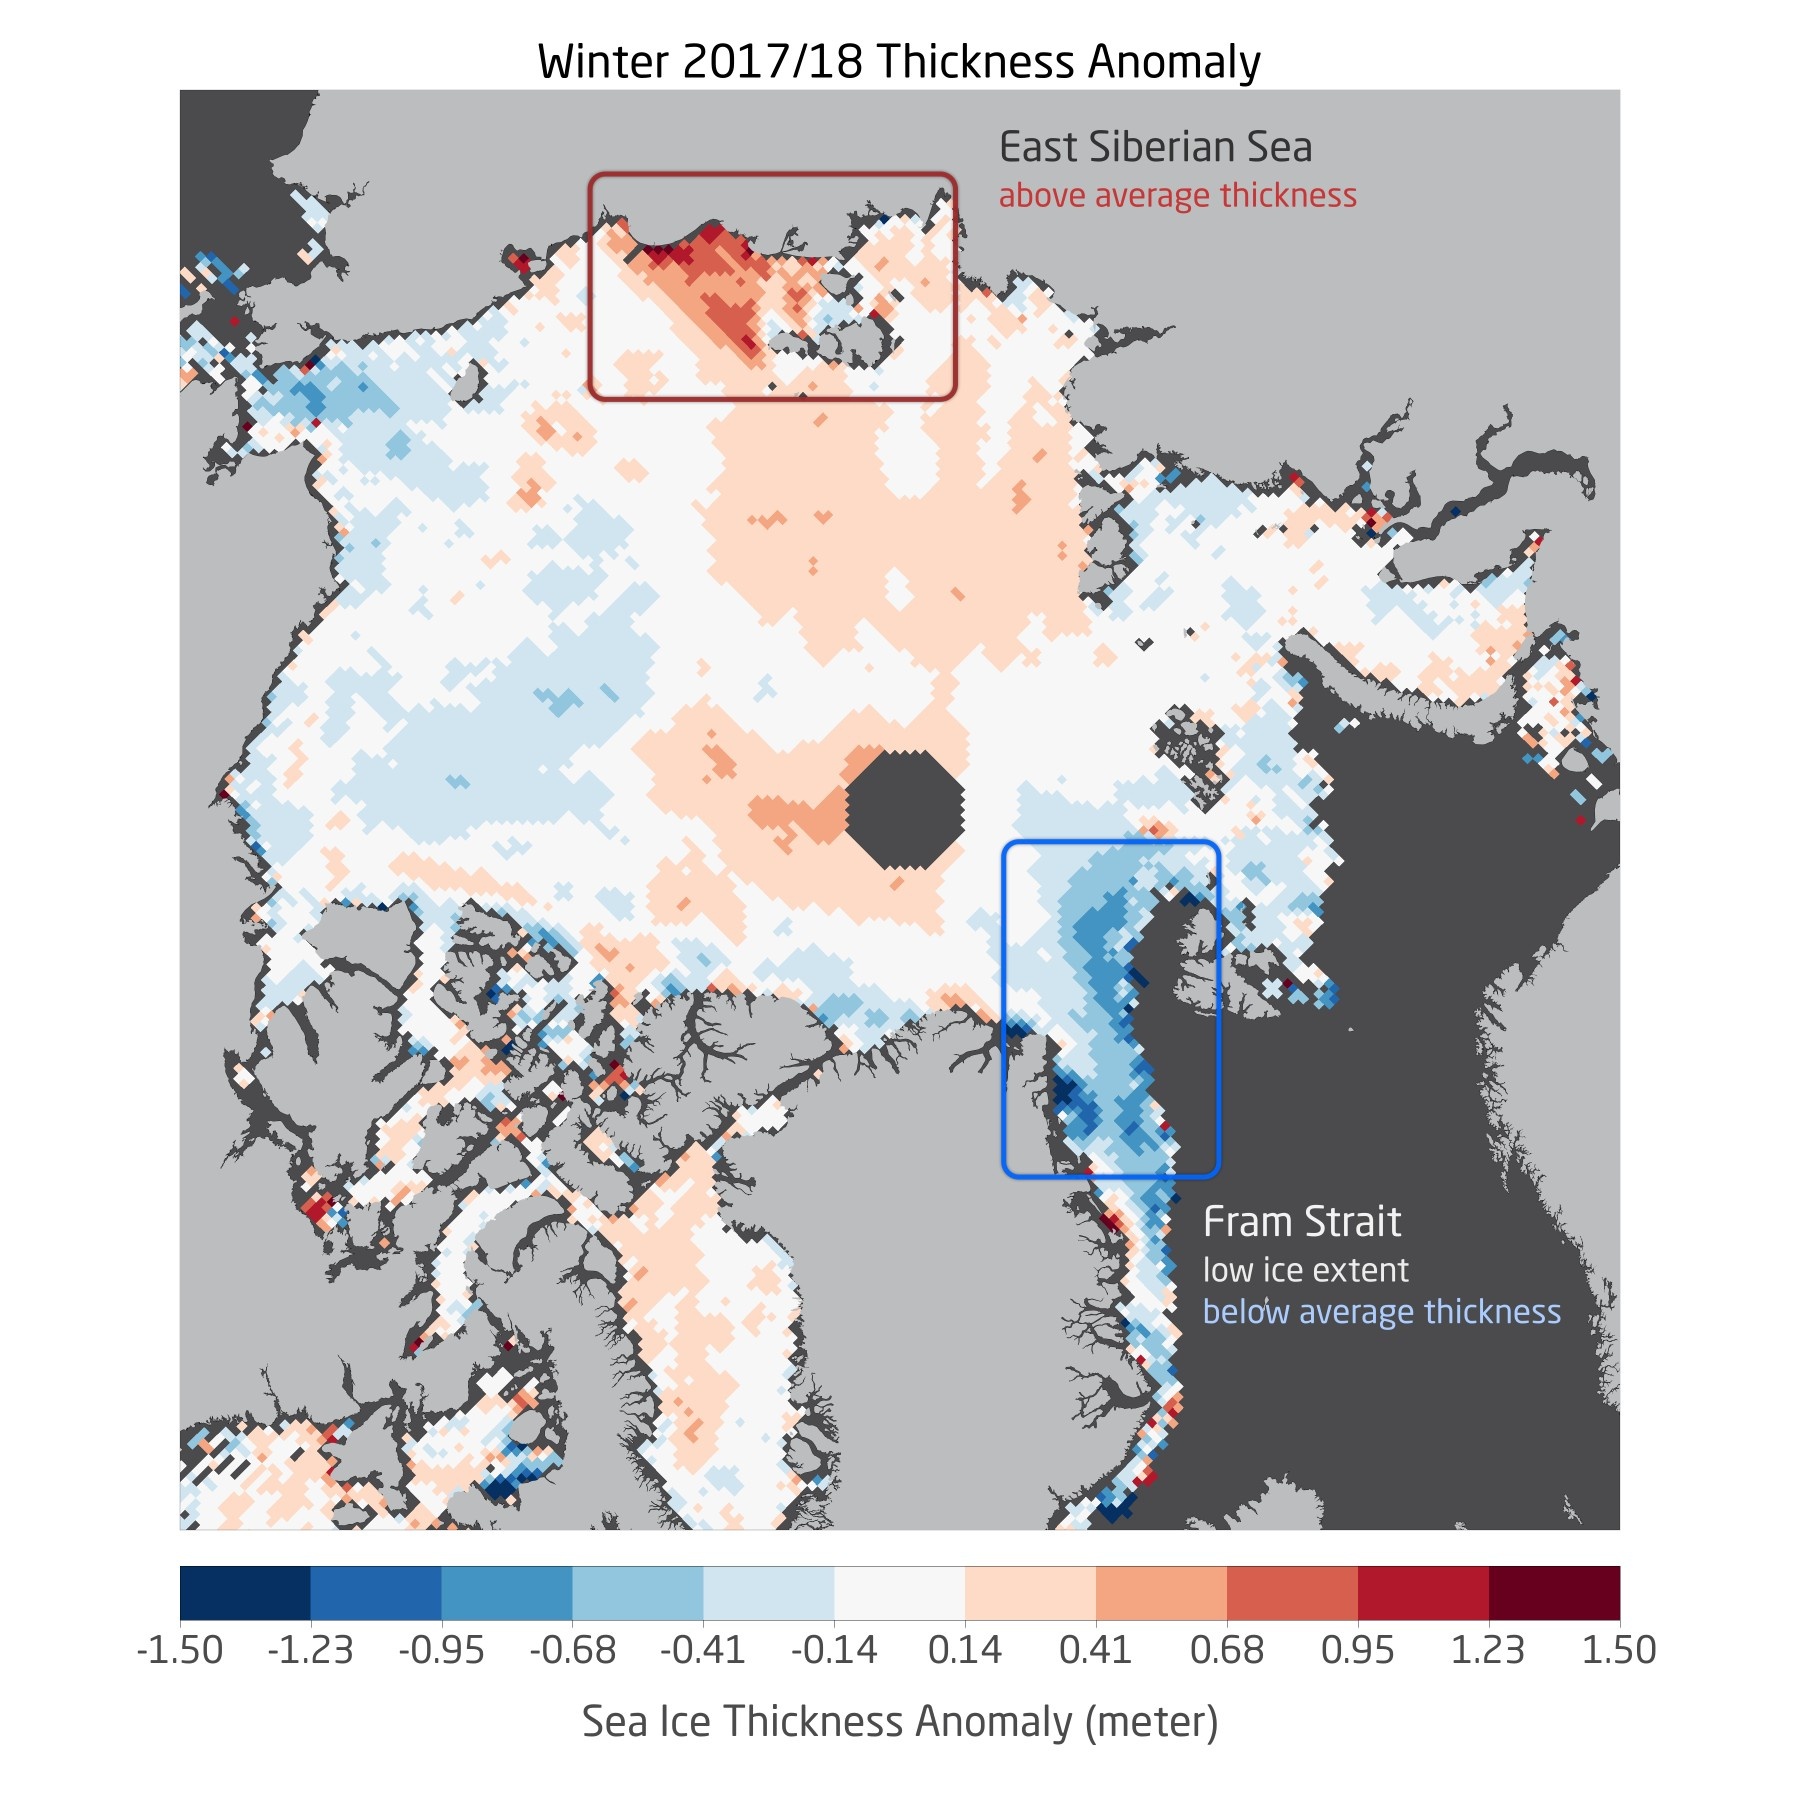
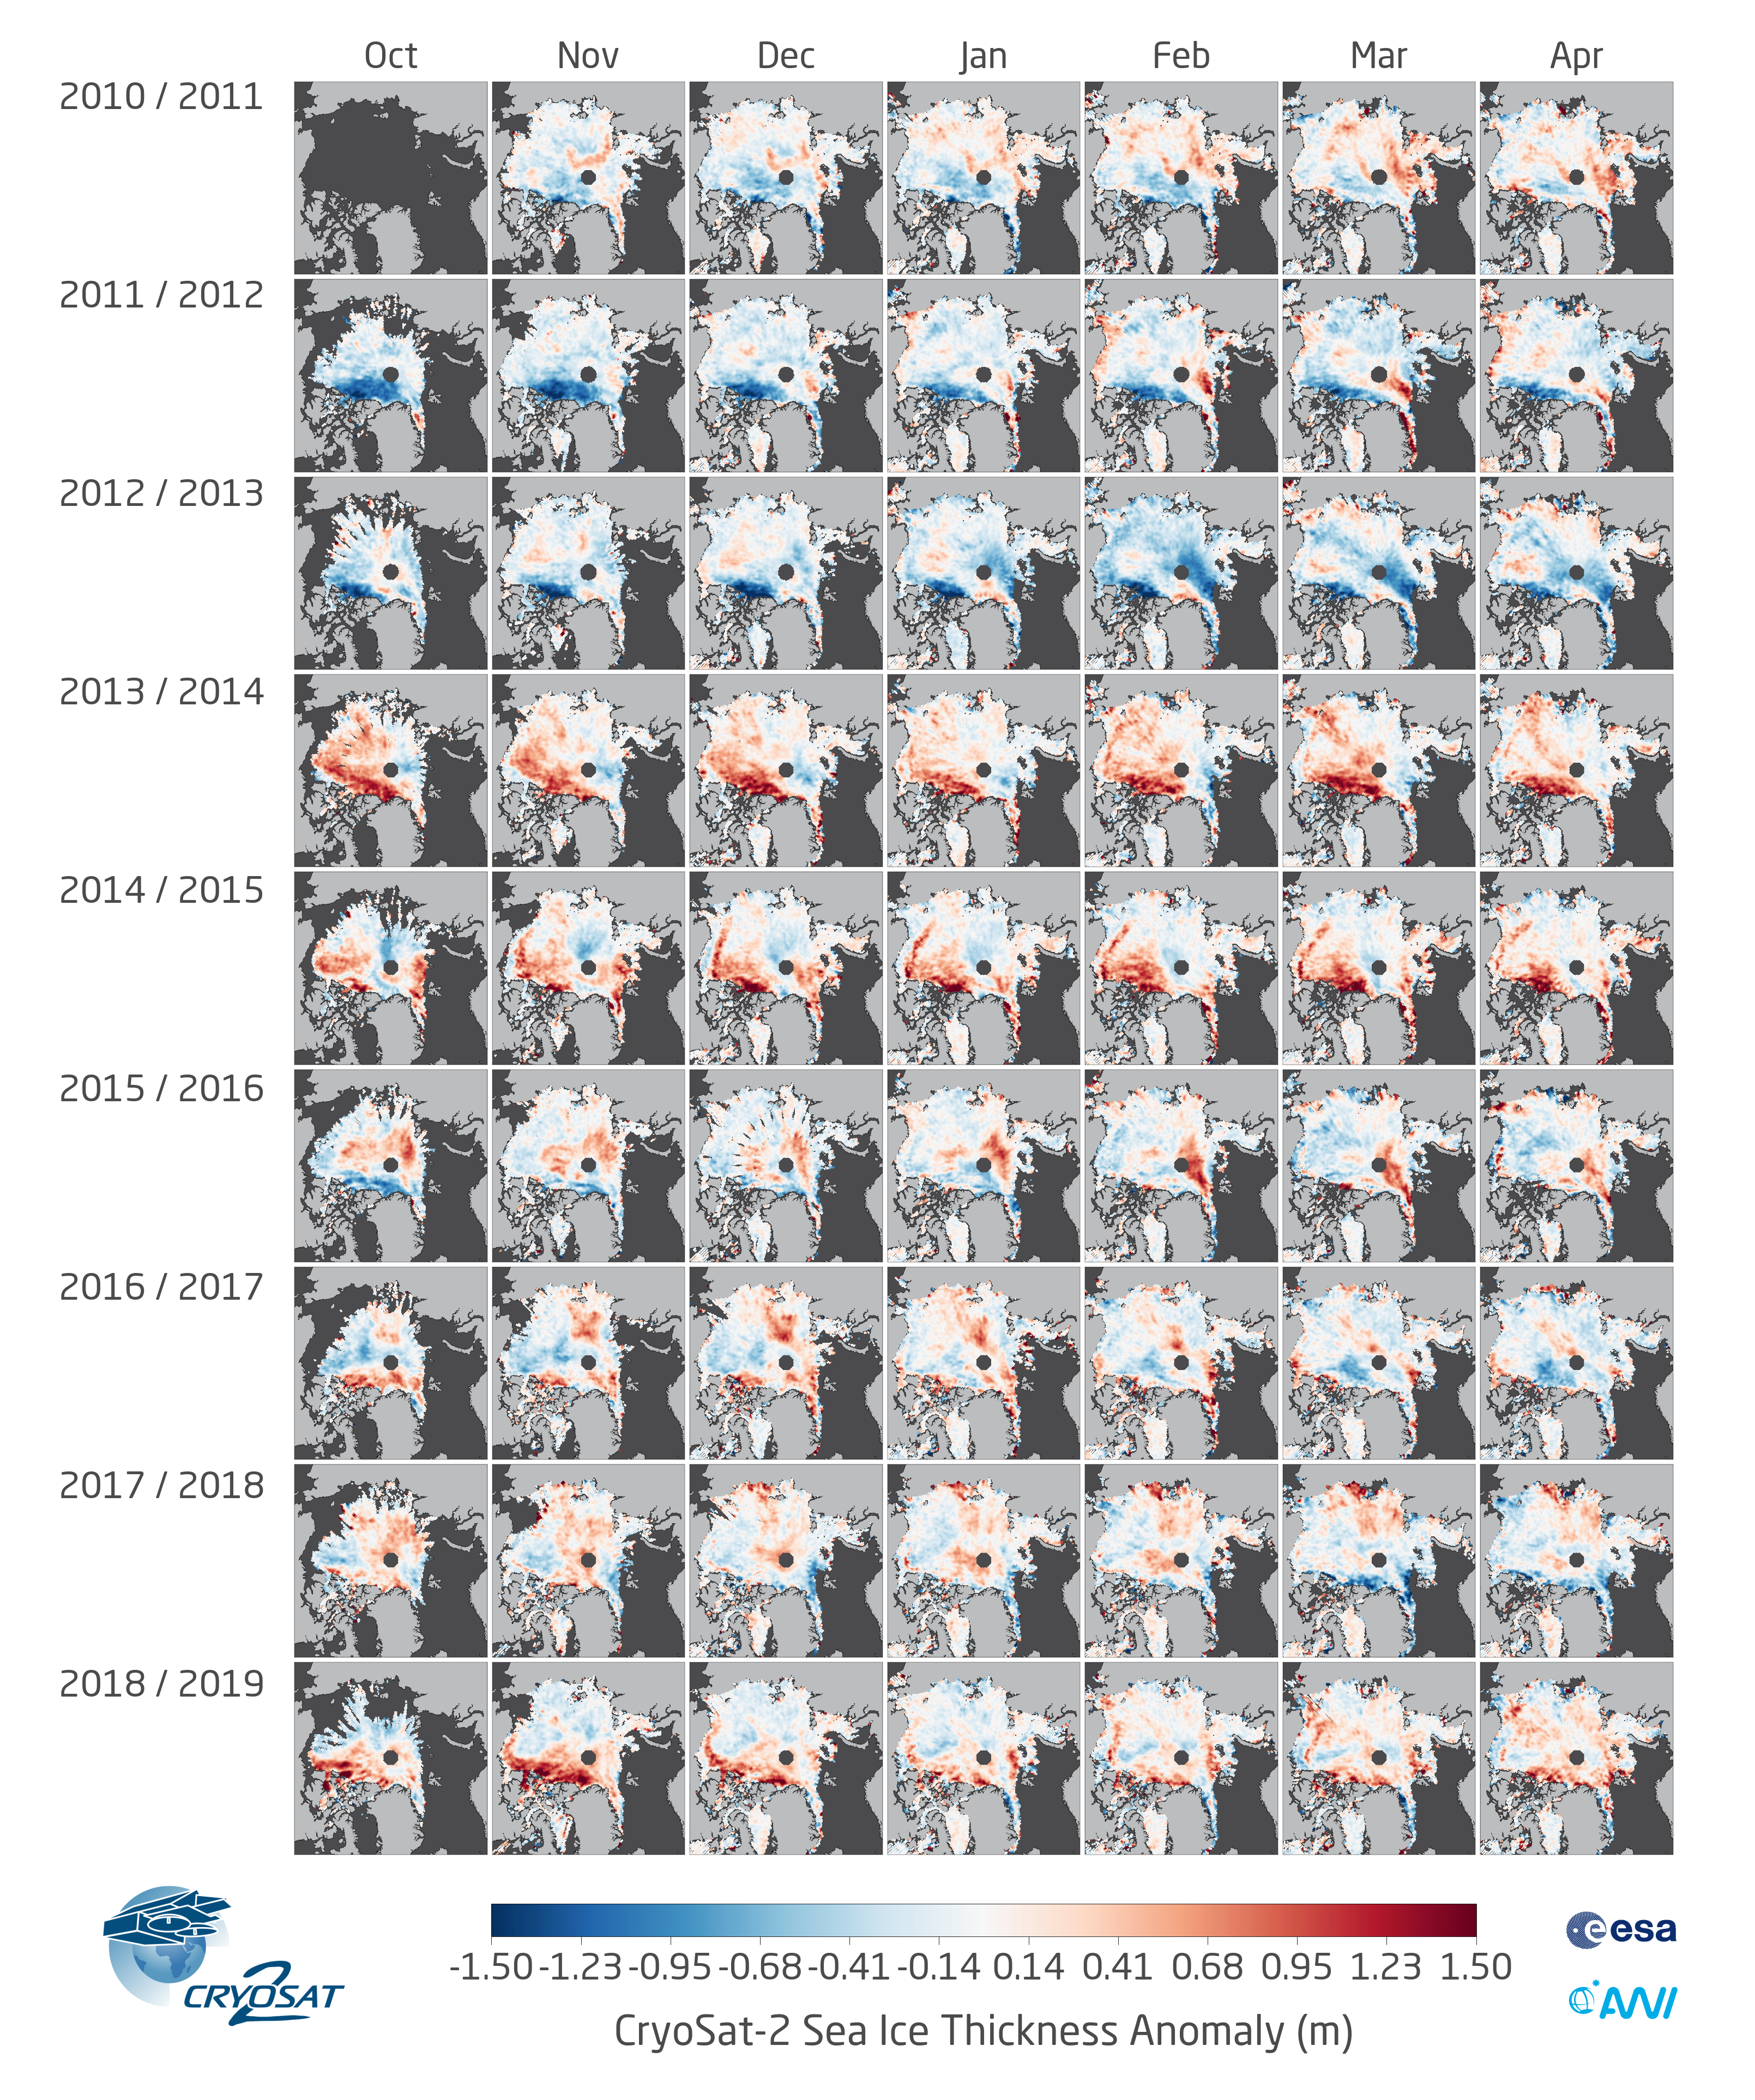
Winter mean sea ice thickness anomaly based on CryoSat-2 data from Oct. 2017 - Apr. 2018 compared to all previous winters (2010/11- 2016/17)
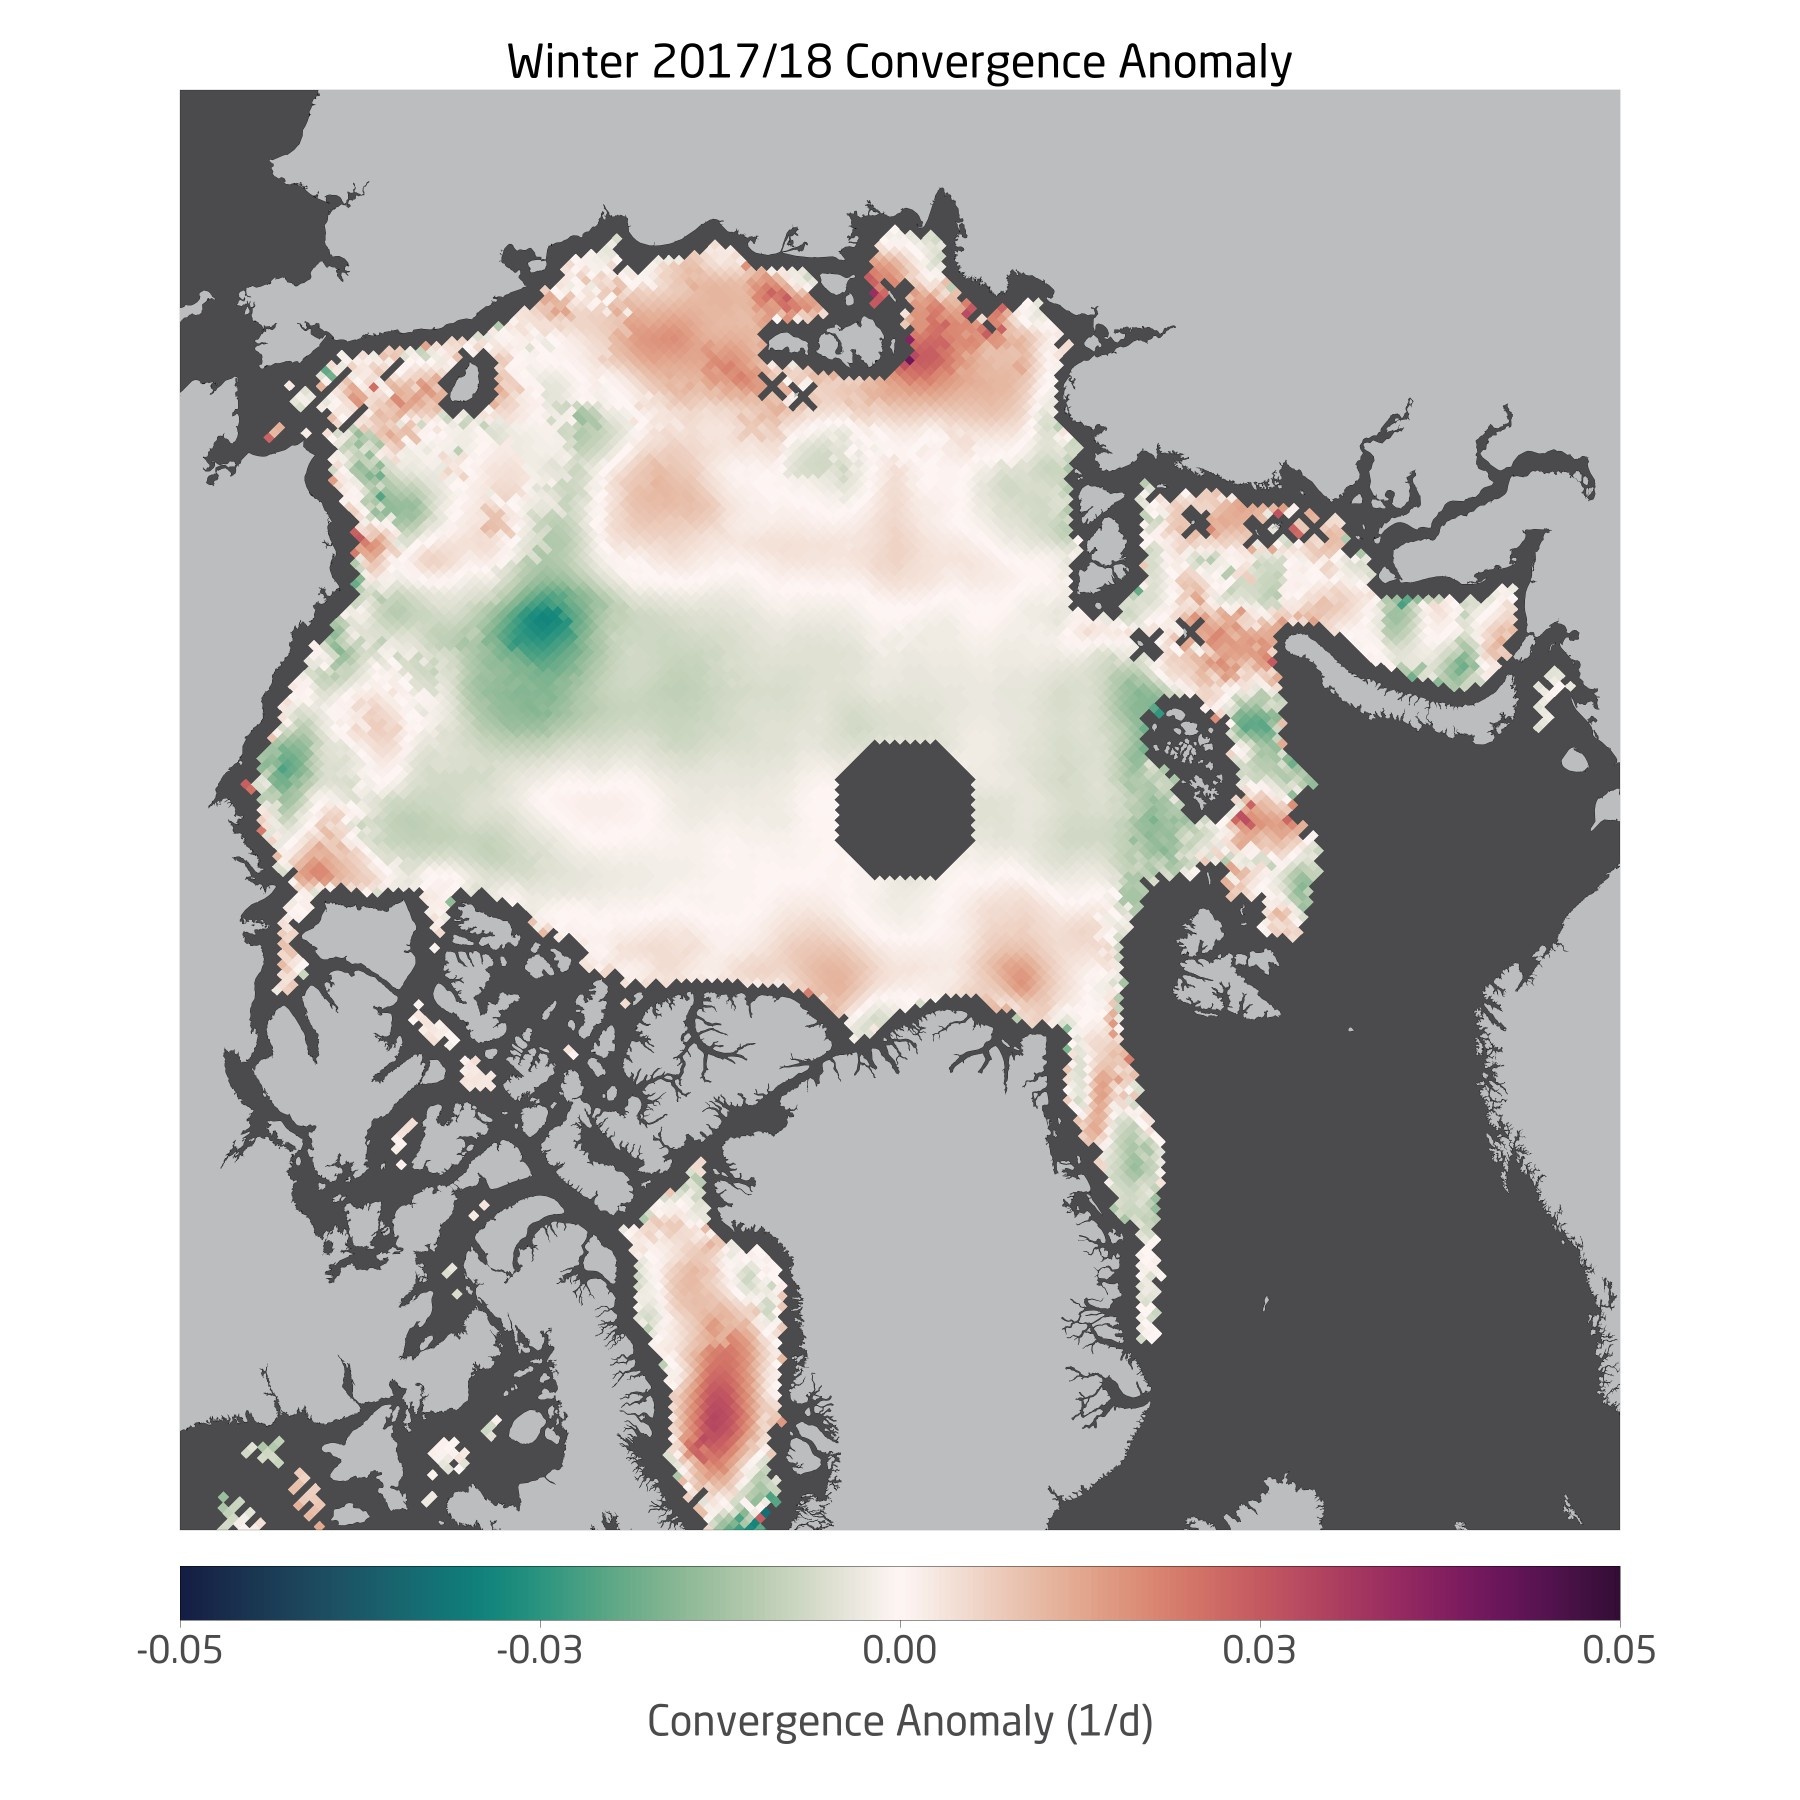
Corresponding ice convergence anomaly from OSI-SAF ice drift data
Production System
Under Construction
This page is under construction
Registration Required
Please apply for access email