The reprocessed data record for the AWI CryoSat-2 sea ice product (version 2.2) is now available on the AWI ftp (Nov 2010 - April 2019). The previous version is deprecated and has been remove. Updates of the reprocessed data stream will start with a delay of 33 days in early November and with 2 day delay for the near-real time data stream in early October.
Main Features of new Release
- Update of algorithm and file content
- Sea Ice Thickness GeotTiffs for all weekly and monthly grids
Links:
- FTP link: ftp://ftp.awi.de/sea_ice/product/cryosat2/v2p2/
- AWI CryoSat-2 v2.2 Product User Guide: https://epic.awi.de/id/eprint/50033/
- Changelog for CryoSat-2 algorithm v2.2
The generation of sea-ice thickness from CryoSat-2 will resume in October 2019 with an update of the retrieval algorithm and product content. The changes are listed below:
Altimeter Input Data
- CryoSat-2 baseline-D data as primary altimeter data since April 28, 2019. NOTE: In v2.2 the reprocessed grid products consist of a mix between baseline-C and baseline-D
Auxiliary Data
- Use C3S (interim) climate data records of sea ice concentration as auxiliary data for the reprocessed data stream. This fixes an issue with evolving land masks in the OSI-SAF operational products, which will not be reprocessed to a consistent standard. The C3S sea ice type is also known to be more precise in the marginal ice zone
Level-1 Pre-Processor
- Added support for the new ESA baseline-D netCDF format
- Increased the regional subset from 50N – 88N in version 2.1 to 45N – 88N
Level-2 Processor
- Split algorithm between near-real time and reprocessed with timeliness dependent choice of validation data
- Removed requirement of having a minimum of 3 leads in each orbits.
- Added sea ice draft and sea ice draft uncertainty as output variables
- Renamed freeboard to sea ice freeboard to be in line with the variables standard name
Level-3 Processor
- Added sea ice draft and sea ice draft uncertainty as output variables
- Renamed freeboard to sea ice freeboard to be in line with the variables standard name
- Removed the average Level-2 orbit based uncertainty for radar freeboard, sea-ice freeboard and sea-ice thickness
- All statistical variables are now named with a “stat_” prefix in the variable name for clarity
- Added temporal statistics variables (see Temporal Coverage per grid cell5.2)
- Added the fraction of negative thicknesses per grid cell as statistical parameter
- Added geotiff output (variable sea-ice thickness only) for all gridded products
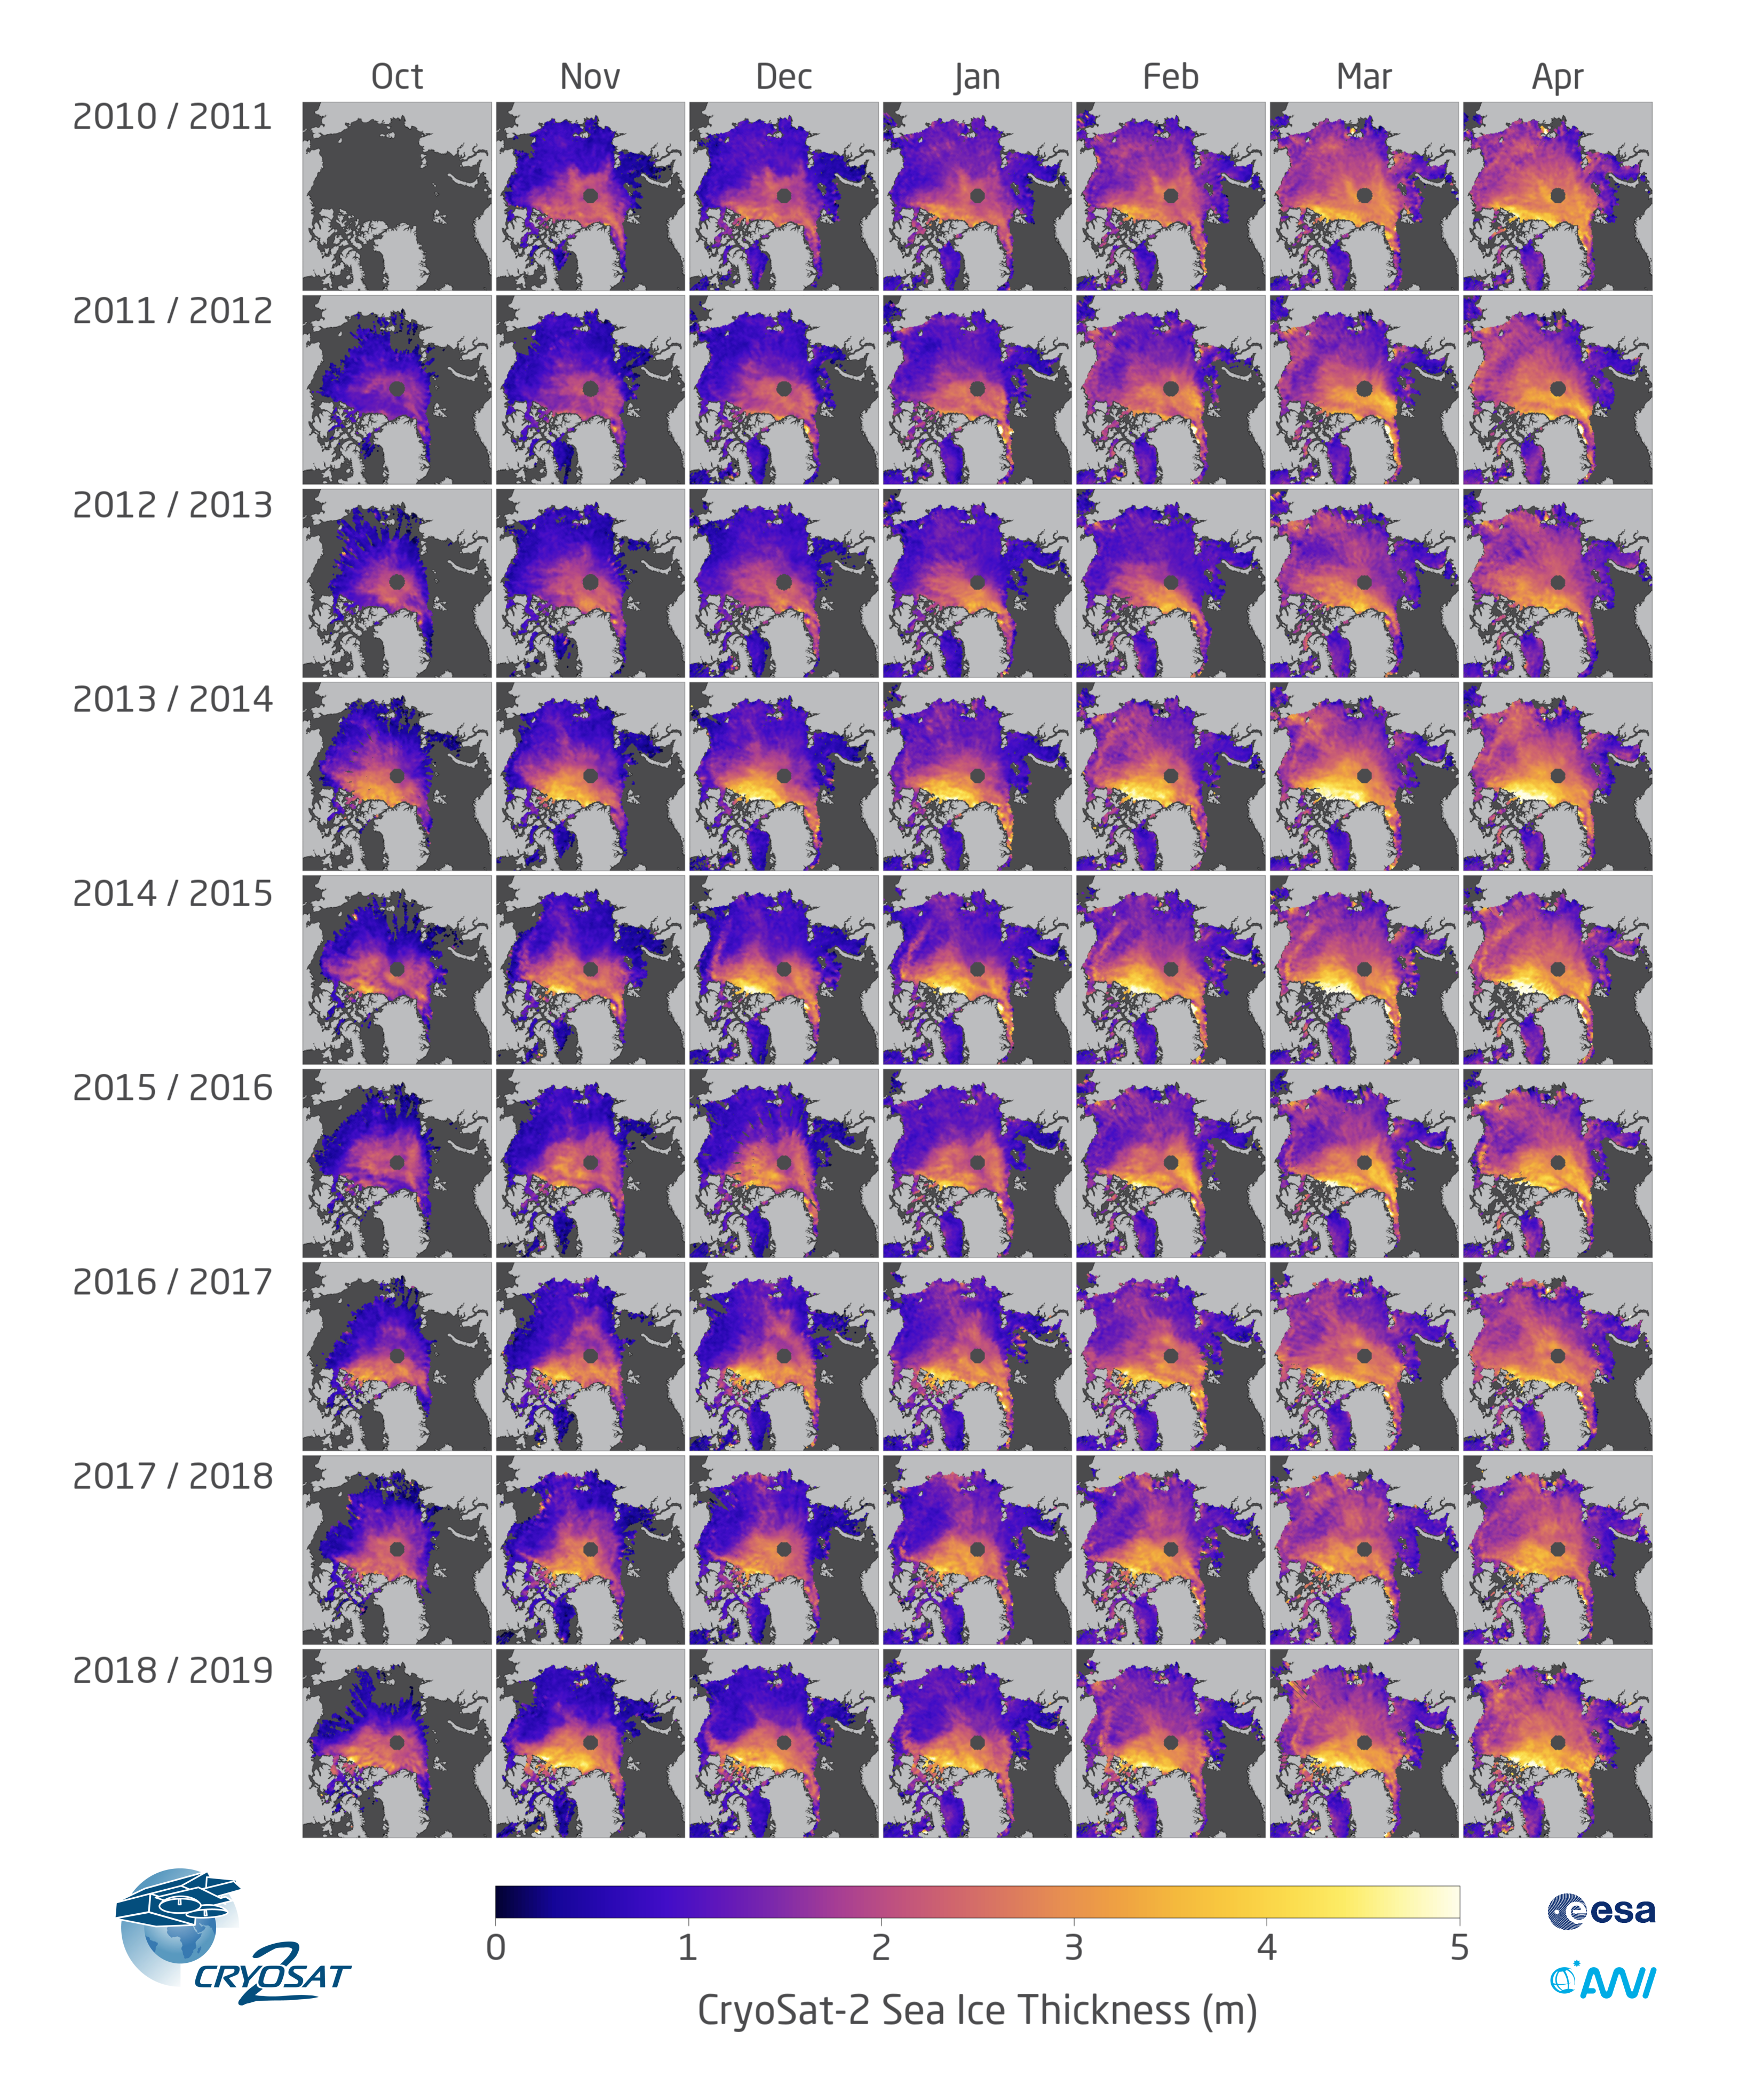
CryoSat-2 has now finished its 9th winter from October to April of Arctic sea ice thickness observations. No sea-ice thickness production is now paused for the month of May through September since the snow is warming and will soon start to melt. The impact of snow melt on the sea-ice thickness retrieval is poorly understood and the production will resume in October 2019 with the next version of CryoSat-2 data.
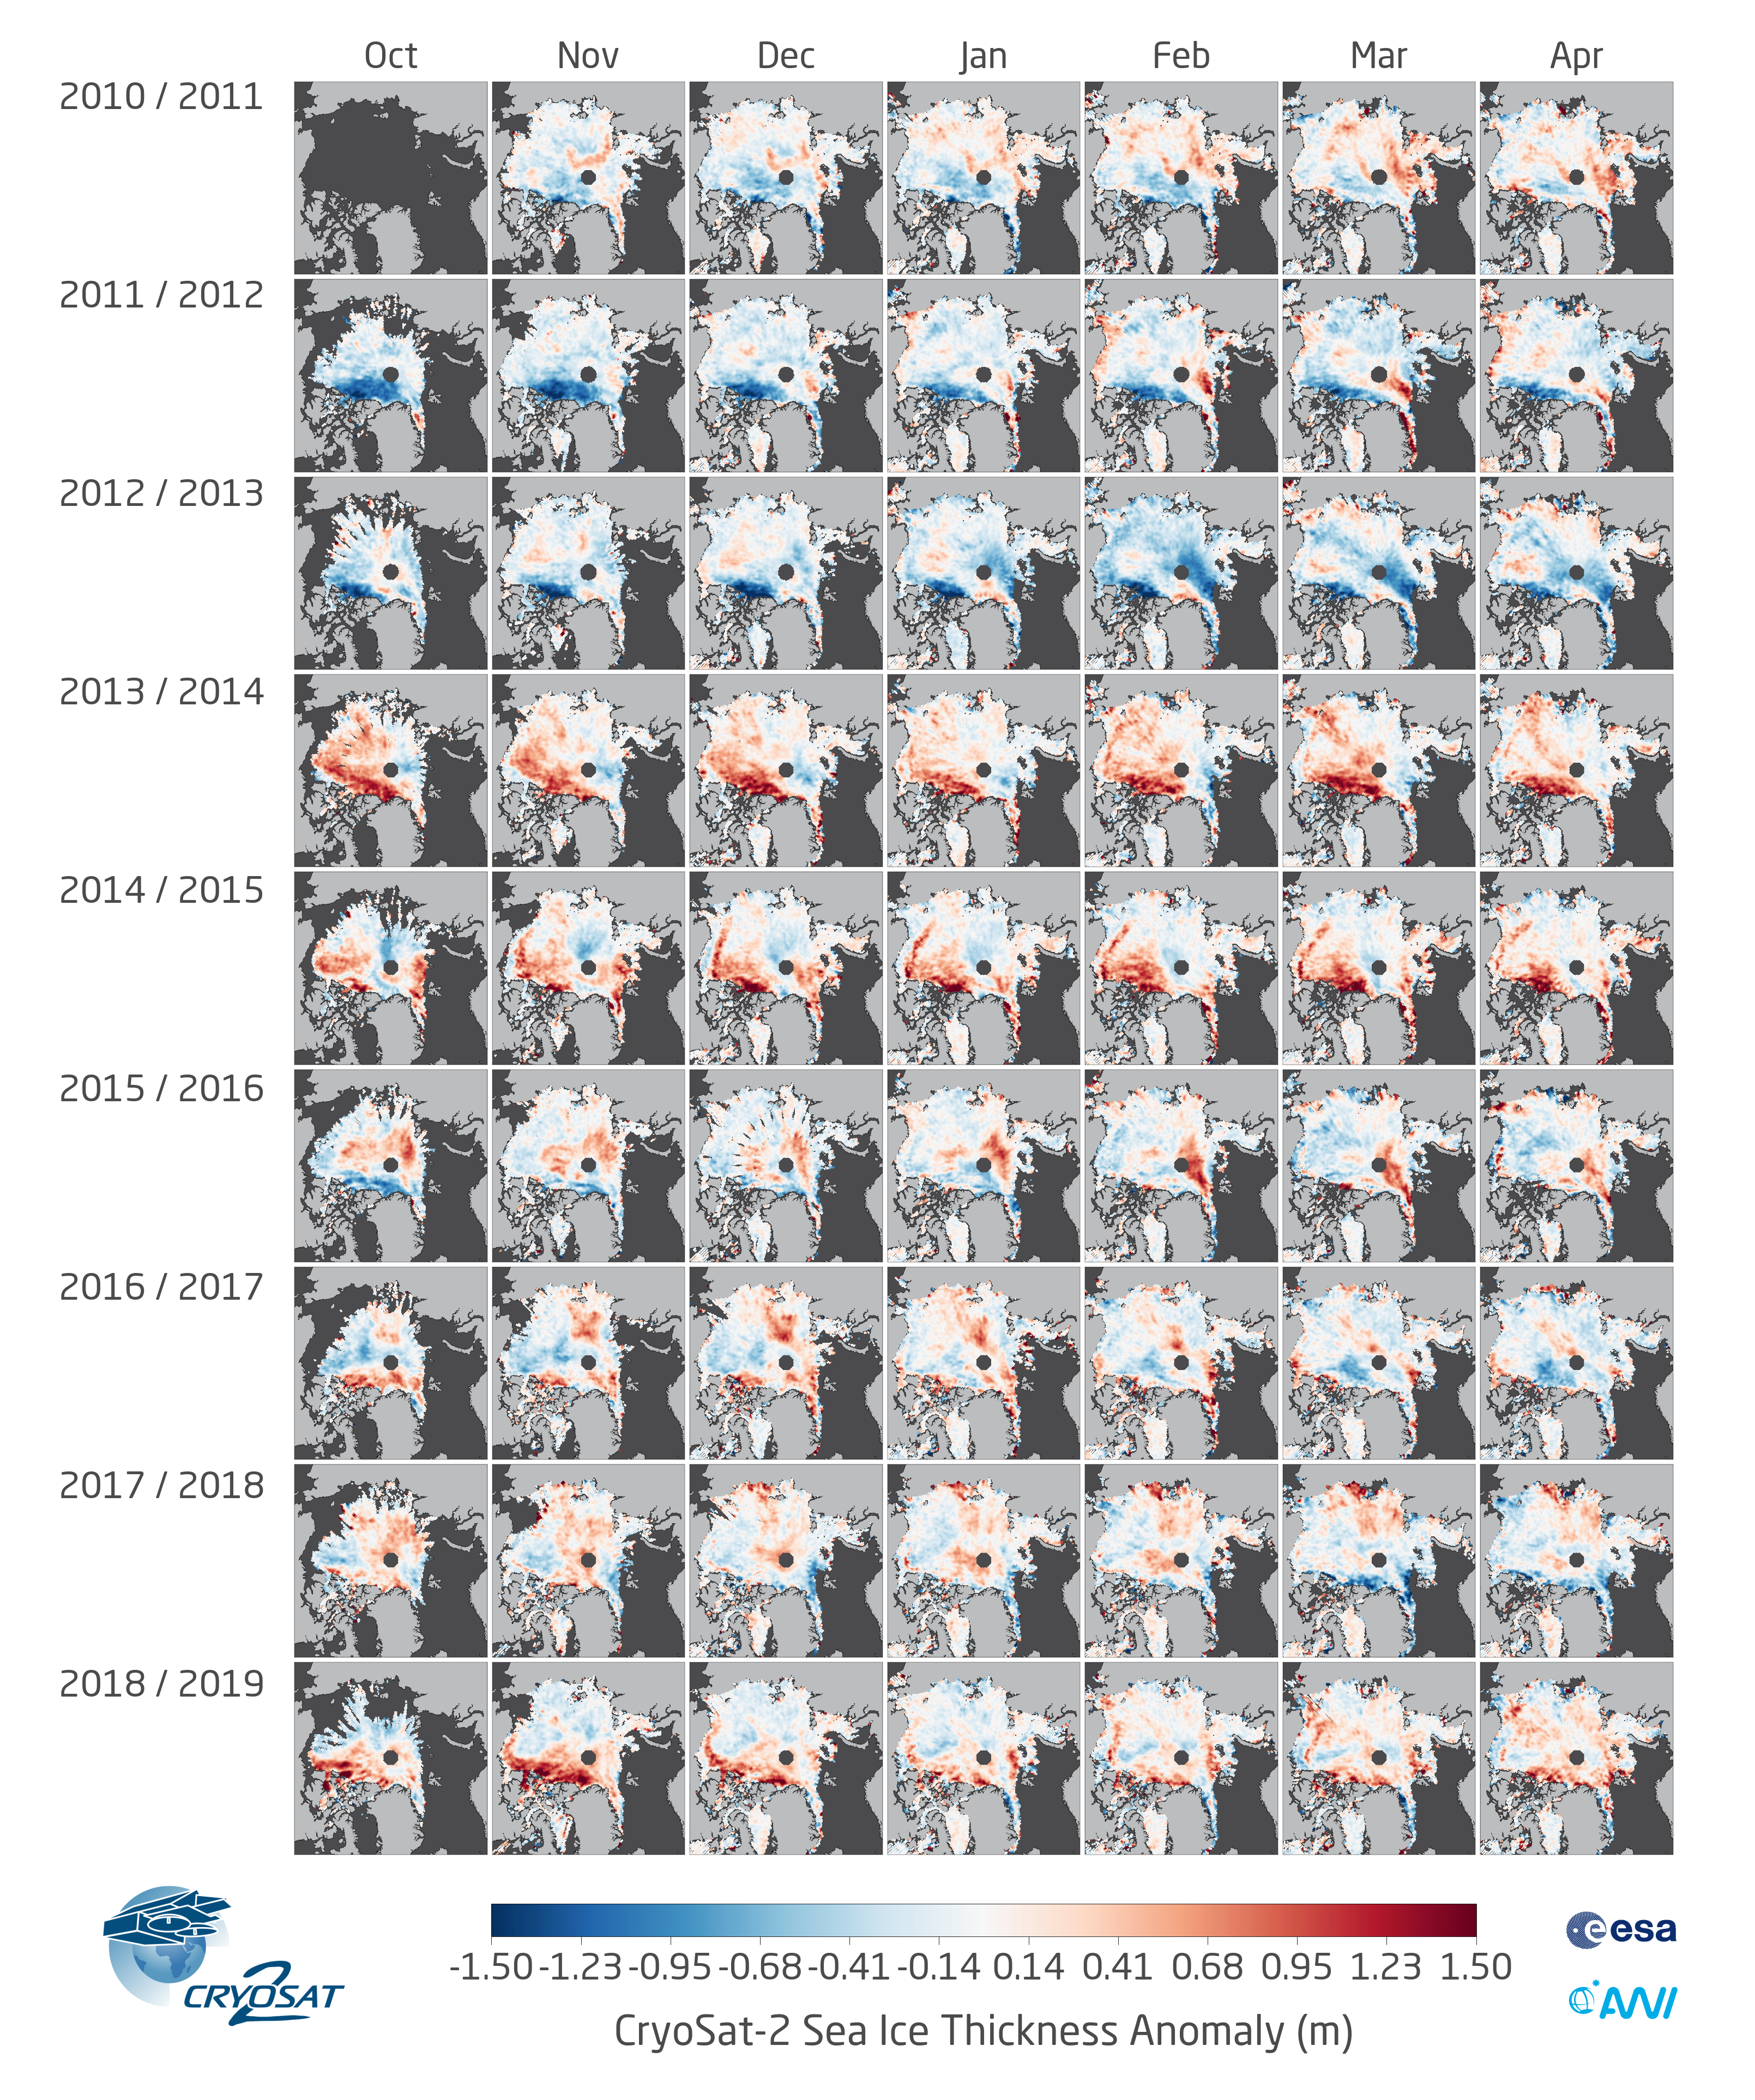
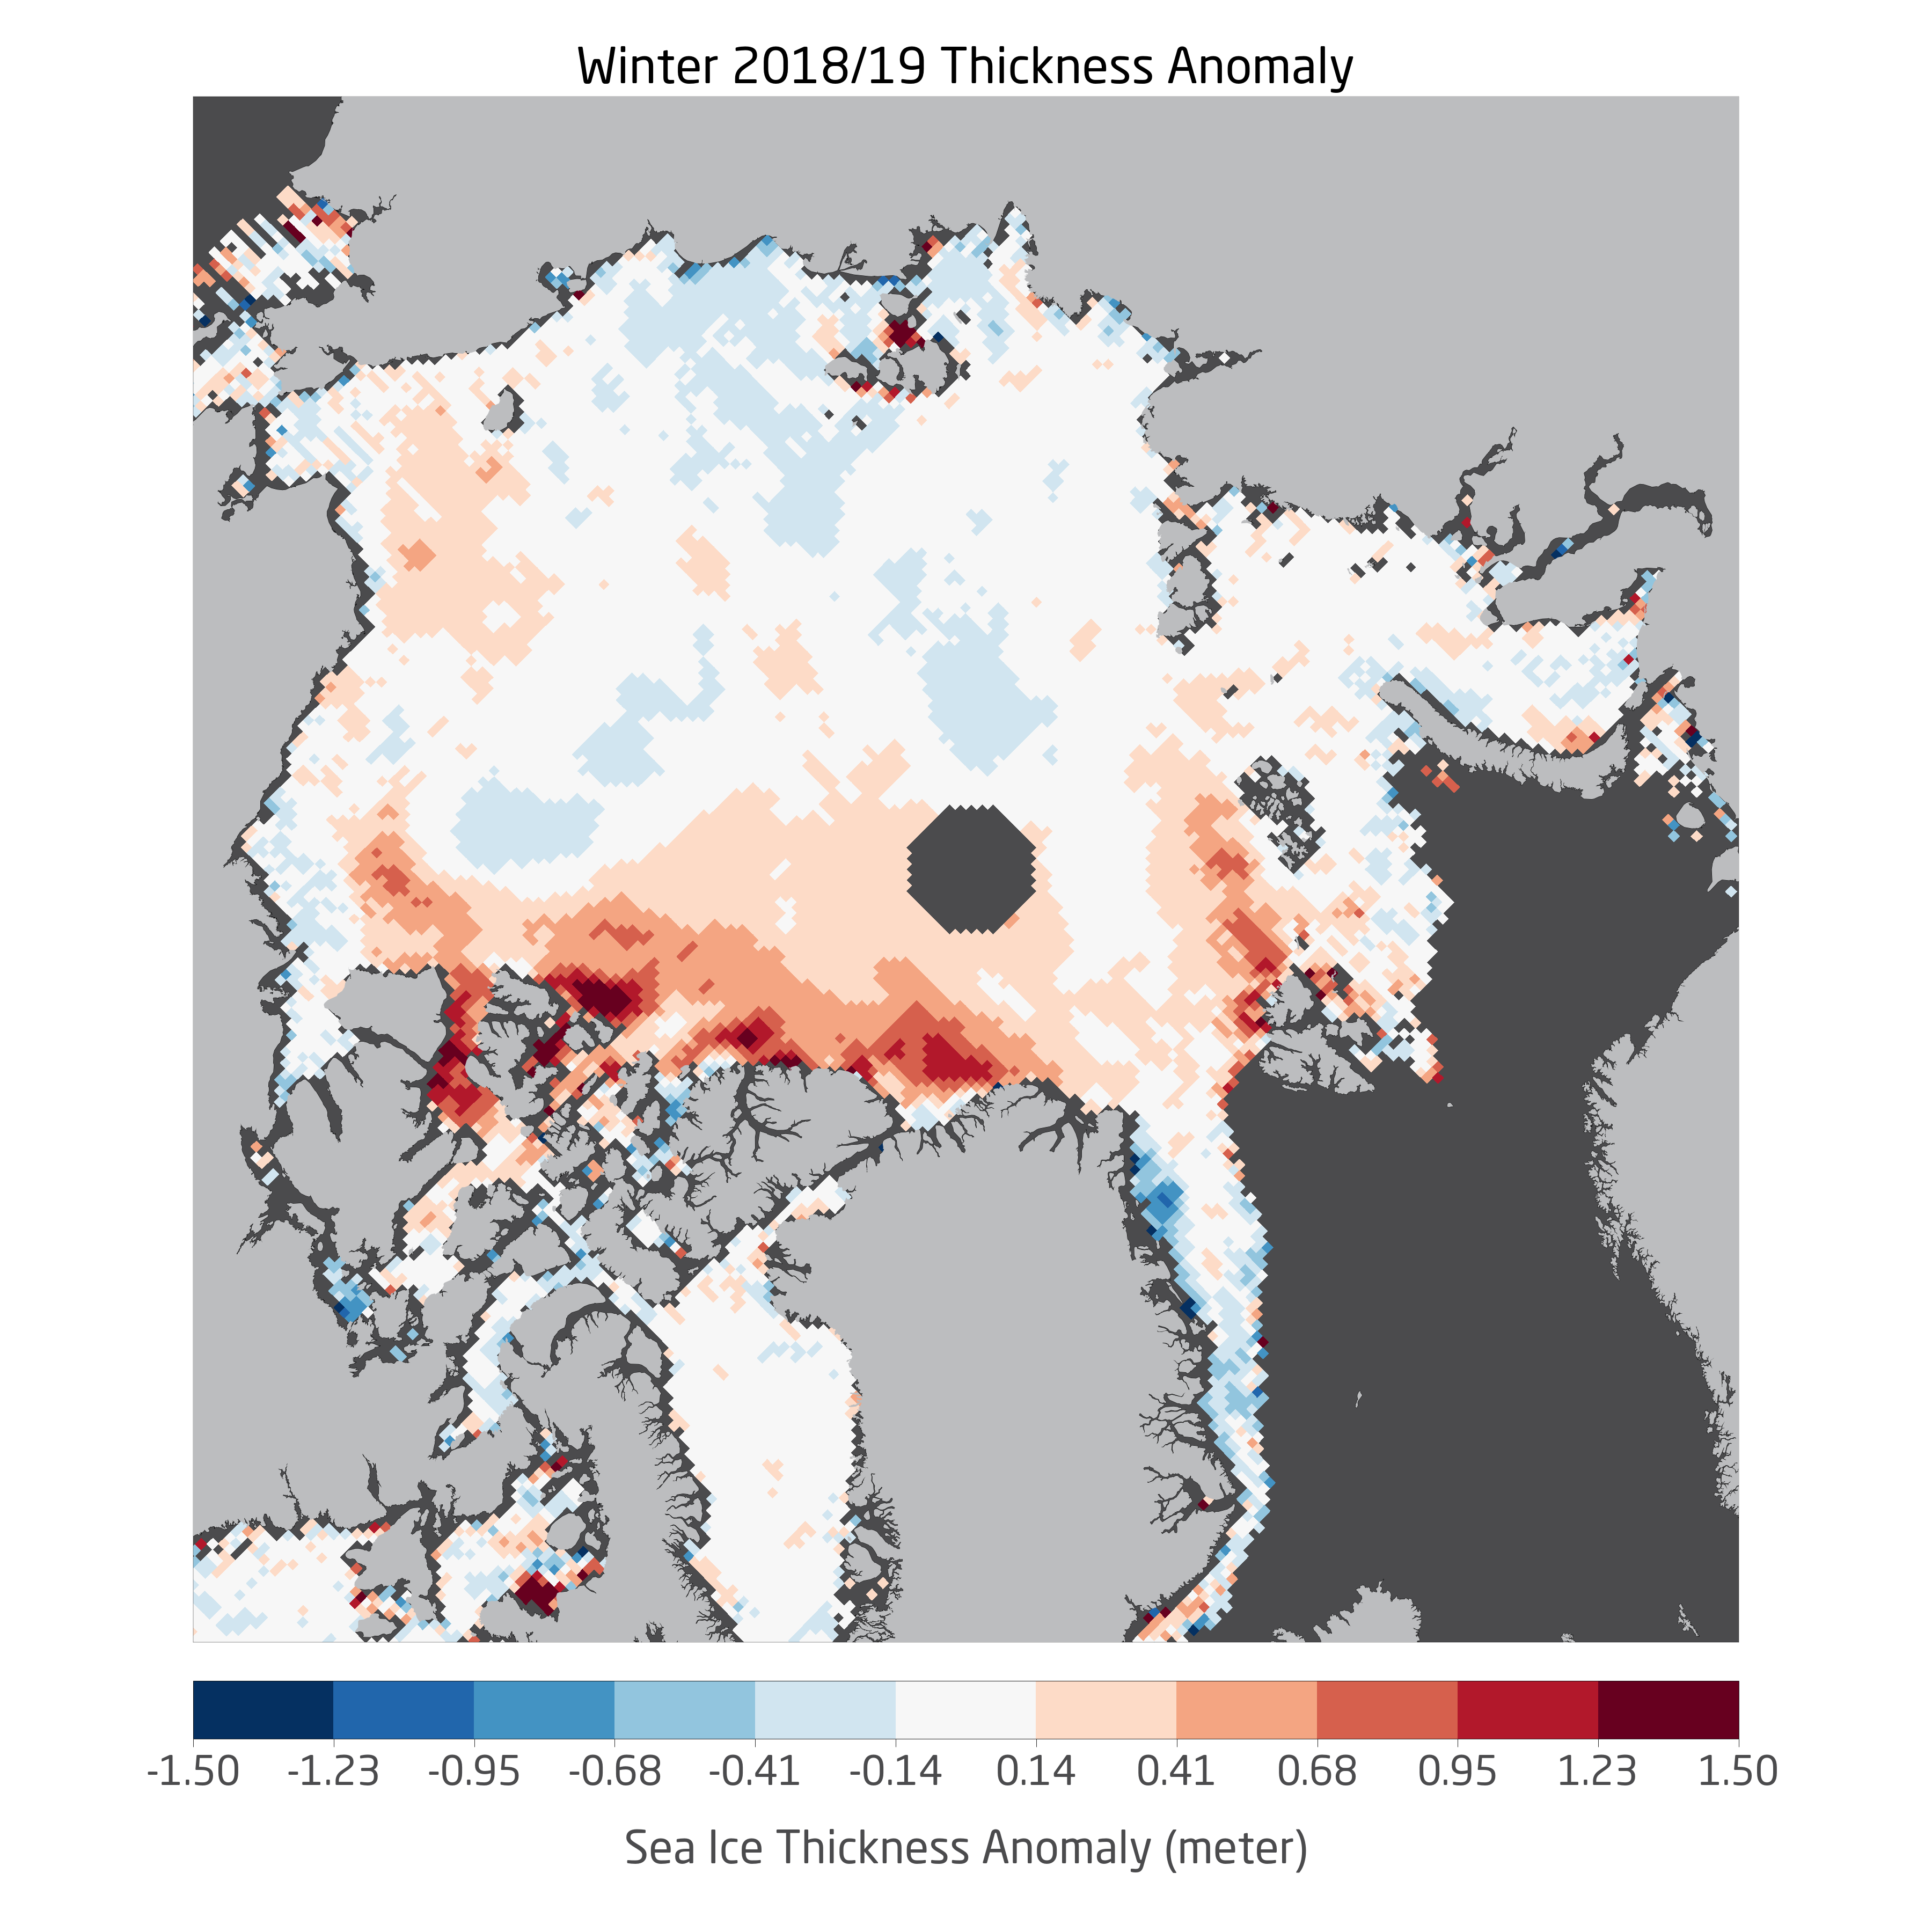
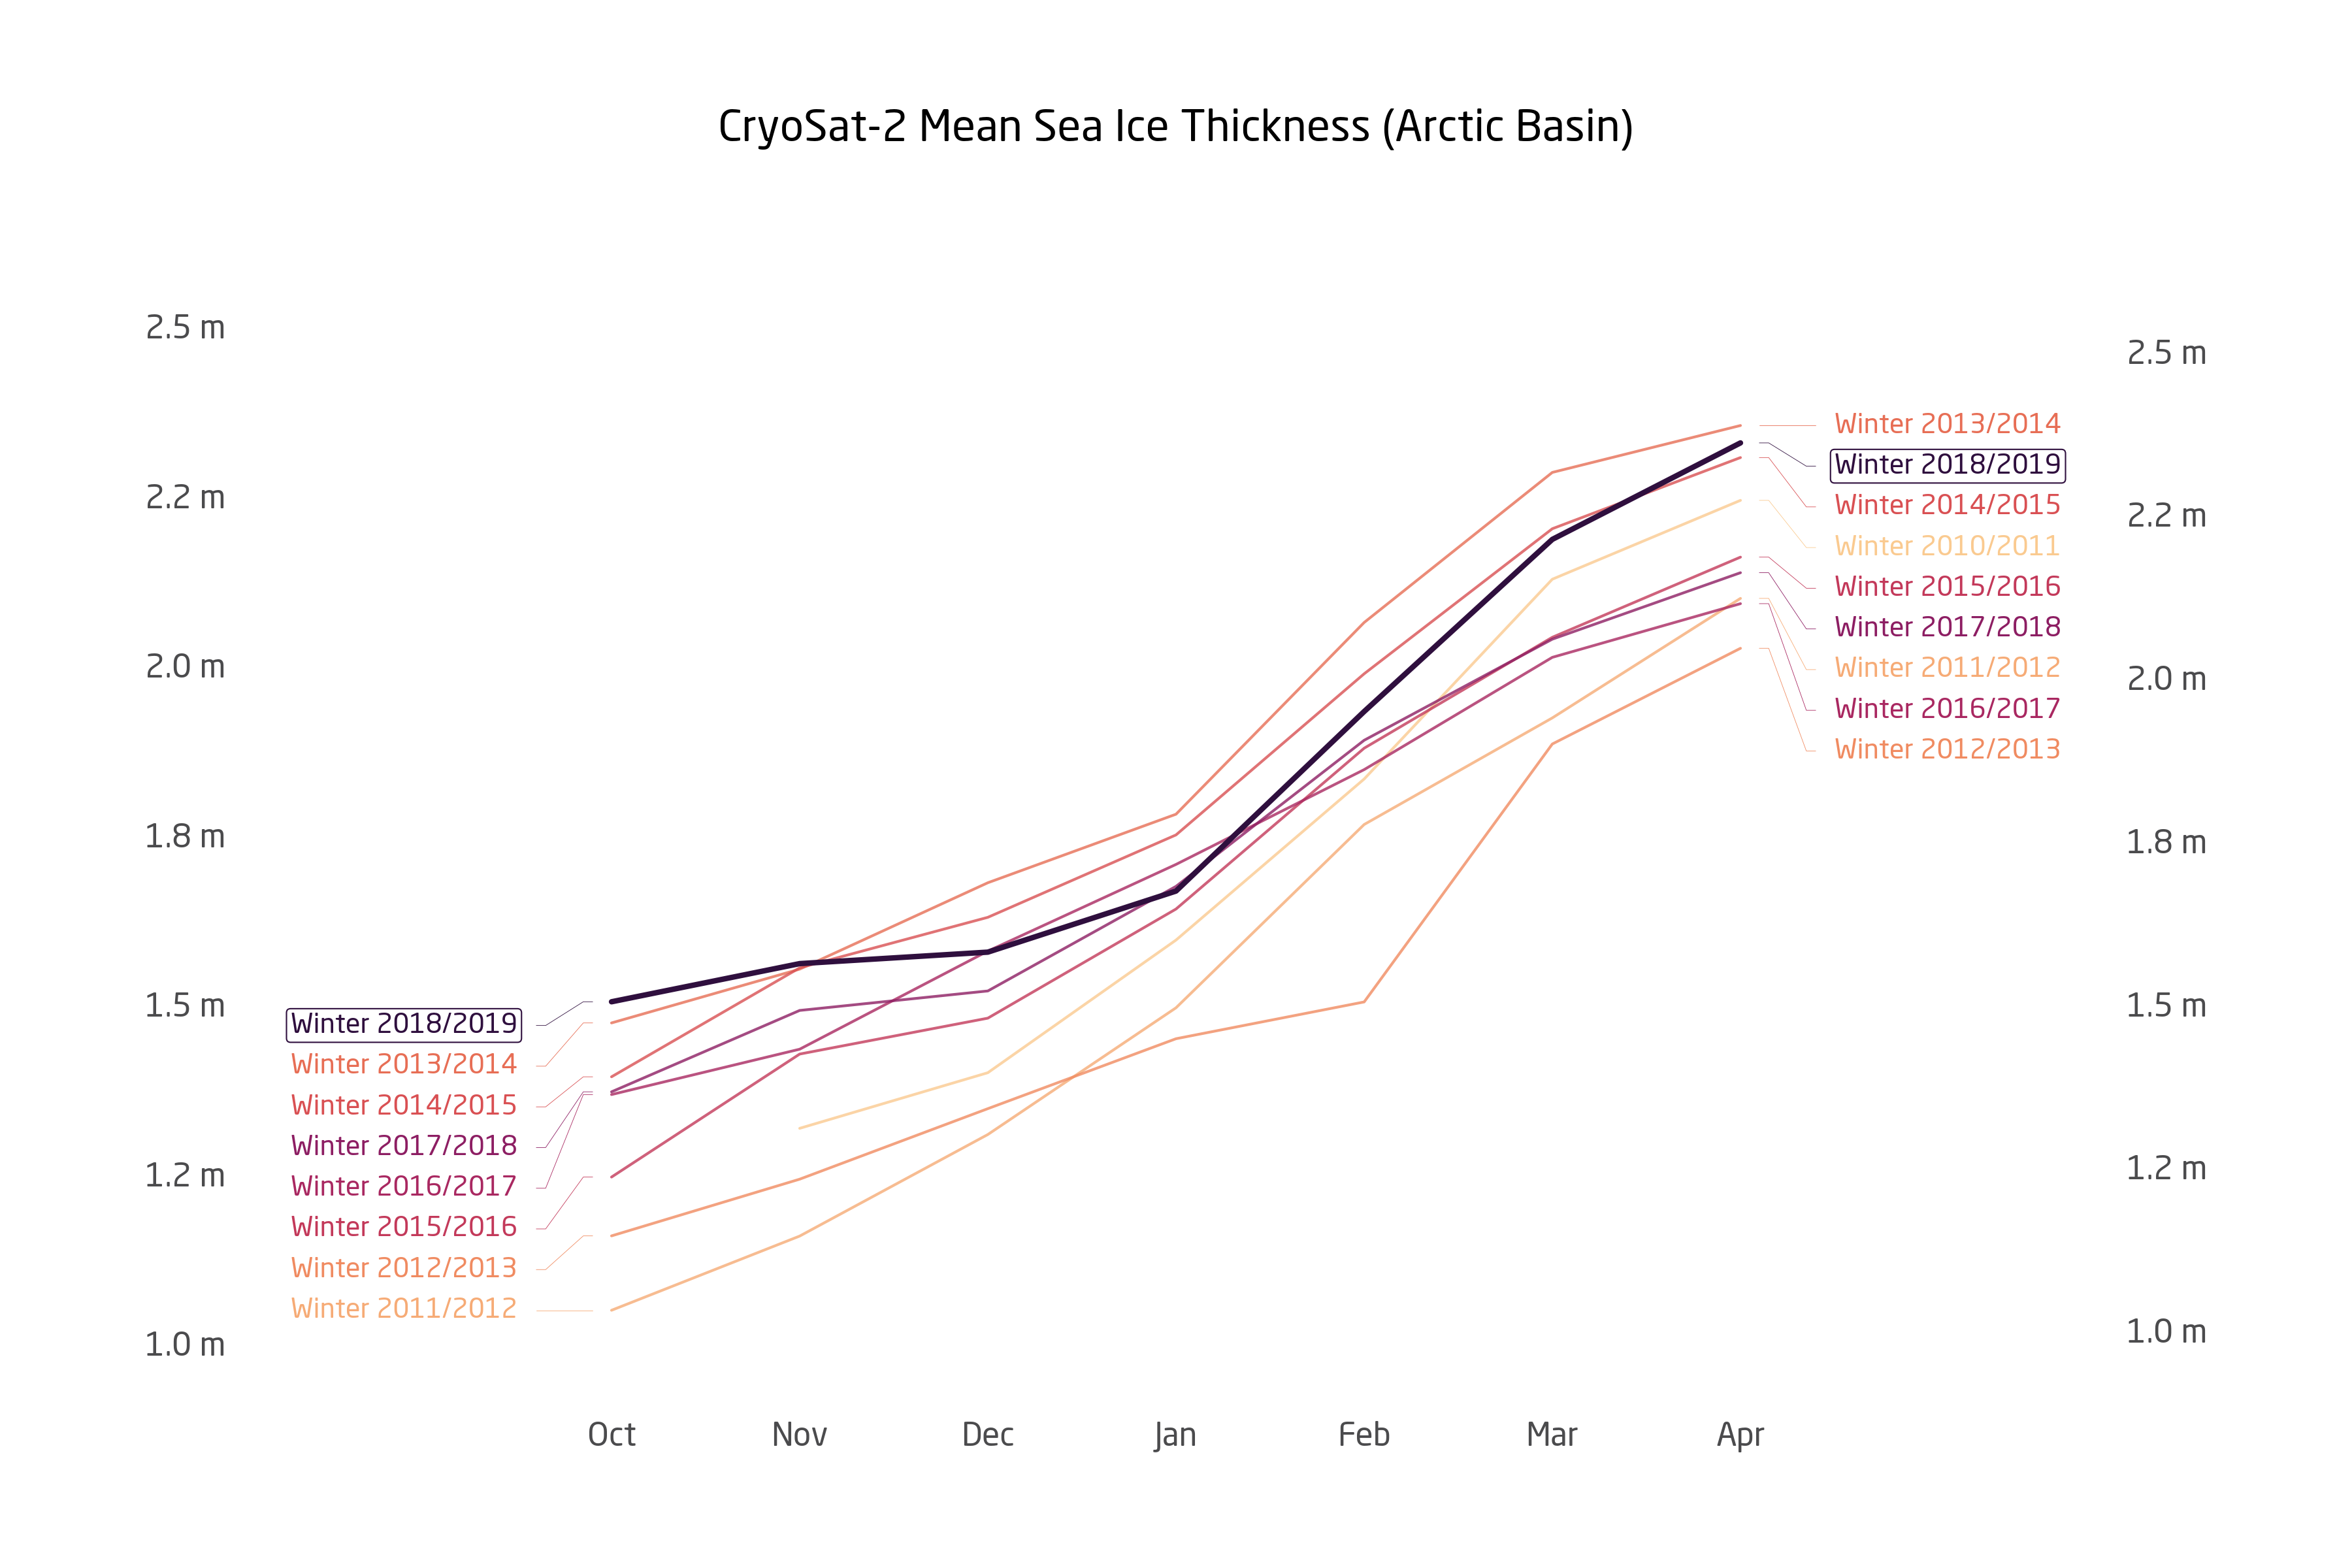
In resume, the winter season of 2018/2019 is characterized by above average sea ice thickness in the central Arctic basin. The main driver is a notable positive thickness anomaly of the multi-year ice in the Canadian part of the Arctic Ocean. But it is important to stress that the above average mean ice thickness does not directly translate into above average sea ice volume, as mean thickness is only a measure for the remaining sea ice. The extent of sea ice instead has been consistently low over the winter season might rank lower in the last 9 years than mean Arctic Basin thickness.
For the computation of sea ice volume with CryoSat-2 we need to fill in gaps in the data, e.g. near to the north pole above the orbit of the satellite and in other regions which are not covered by observations within a month. Such an interpolated product (data processing level 4) is planned for upcoming versions of the AWI CryoSat-2 sea ice product.
Data Access
See this page for data access
The latest results from CryoSat show that the latest extrema in winter sea ice maximum extent are not necessarily accompanied by a lower mean sea ice thickness of the remaining ice. One factor certainly is that sea ice thickness is a product of thermodynamic ice growth and the acummulated dynamic forces throughout the winter. As a first step in the investigation to what extent dynamic forces have played a role in the last winter, we compare winter mean anomalies of sea ice thickness and ice convergence derived from OSI-SAF data (figures below).
Visual inspection shows that there are two regions where above-average ice convergence and thickness seem to be correlated:
- East Siberian Sea
- Baffin Bay
It must be kept in mind that the convergence anomaly only shows which regions had higher rates of compression. In addition, the analysis is based on monthly mean convergence/divergence estimates, which might not provide an accurate representation on individual events. But the visual comparison can be a starting point for a more detailed physical analysis.
The winter mean thickness anomaly also indicates that regions that had anomalous low sea ice extent this winter (Fram Strait, Bering Sea) also have a negative ice thickness anomaly.
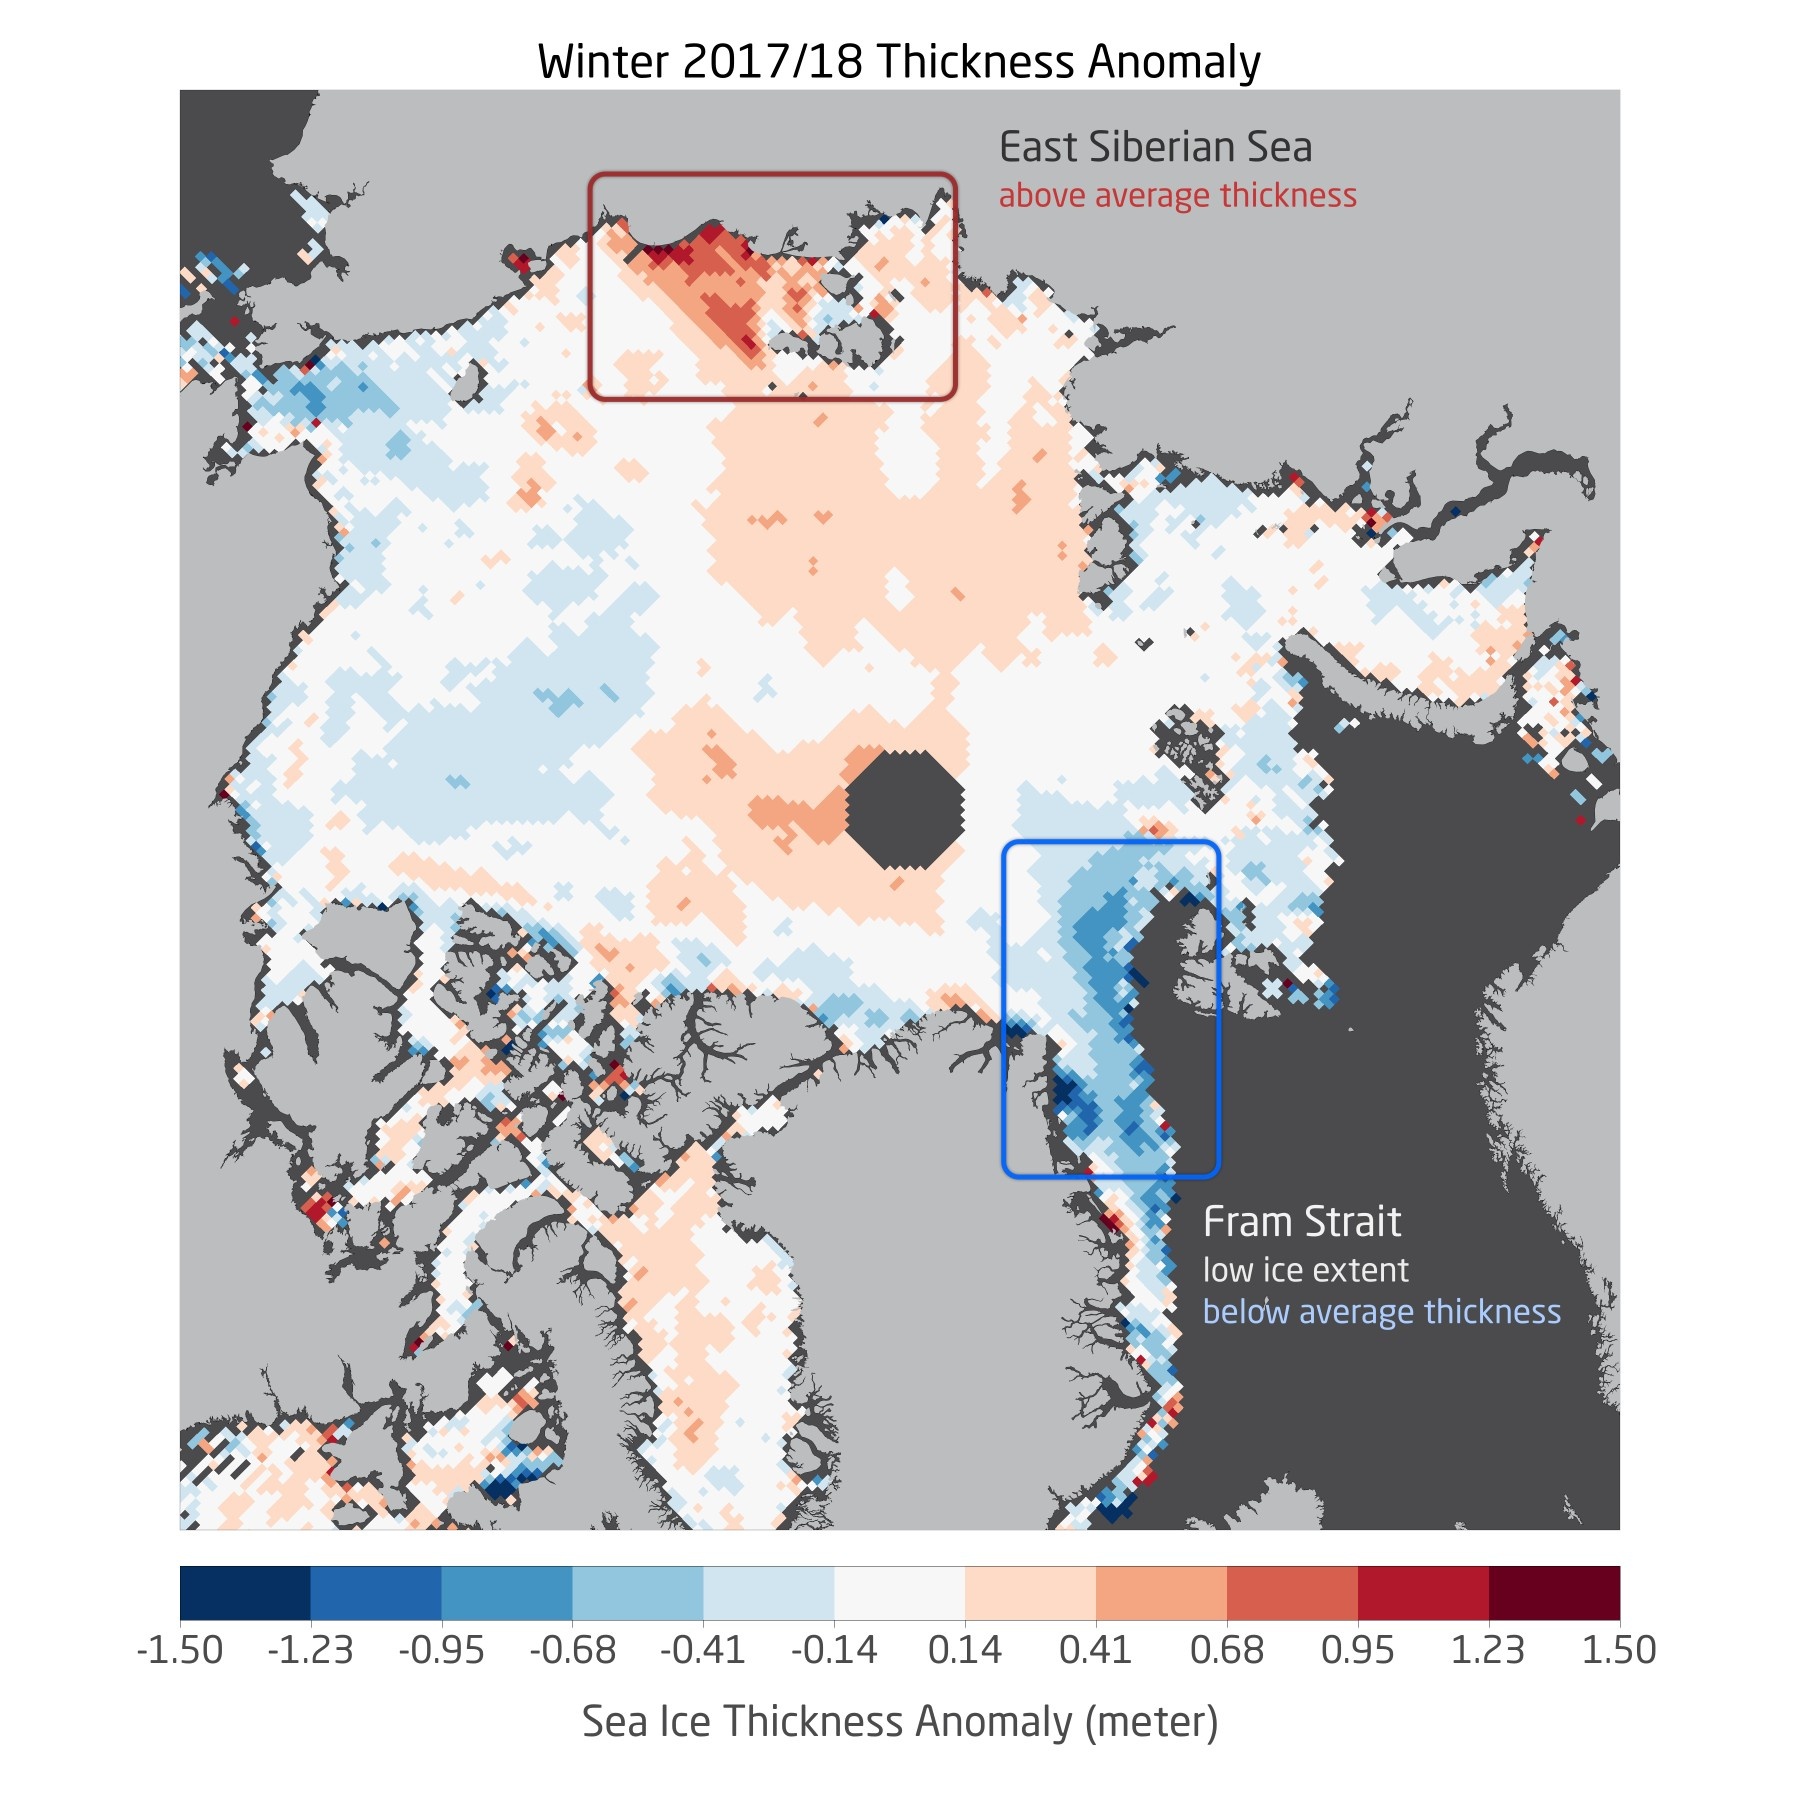
Winter mean sea ice thickness anomaly based on CryoSat-2 data from Oct. 2017 - Apr. 2018 compared to all previous winters (2010/11- 2016/17)
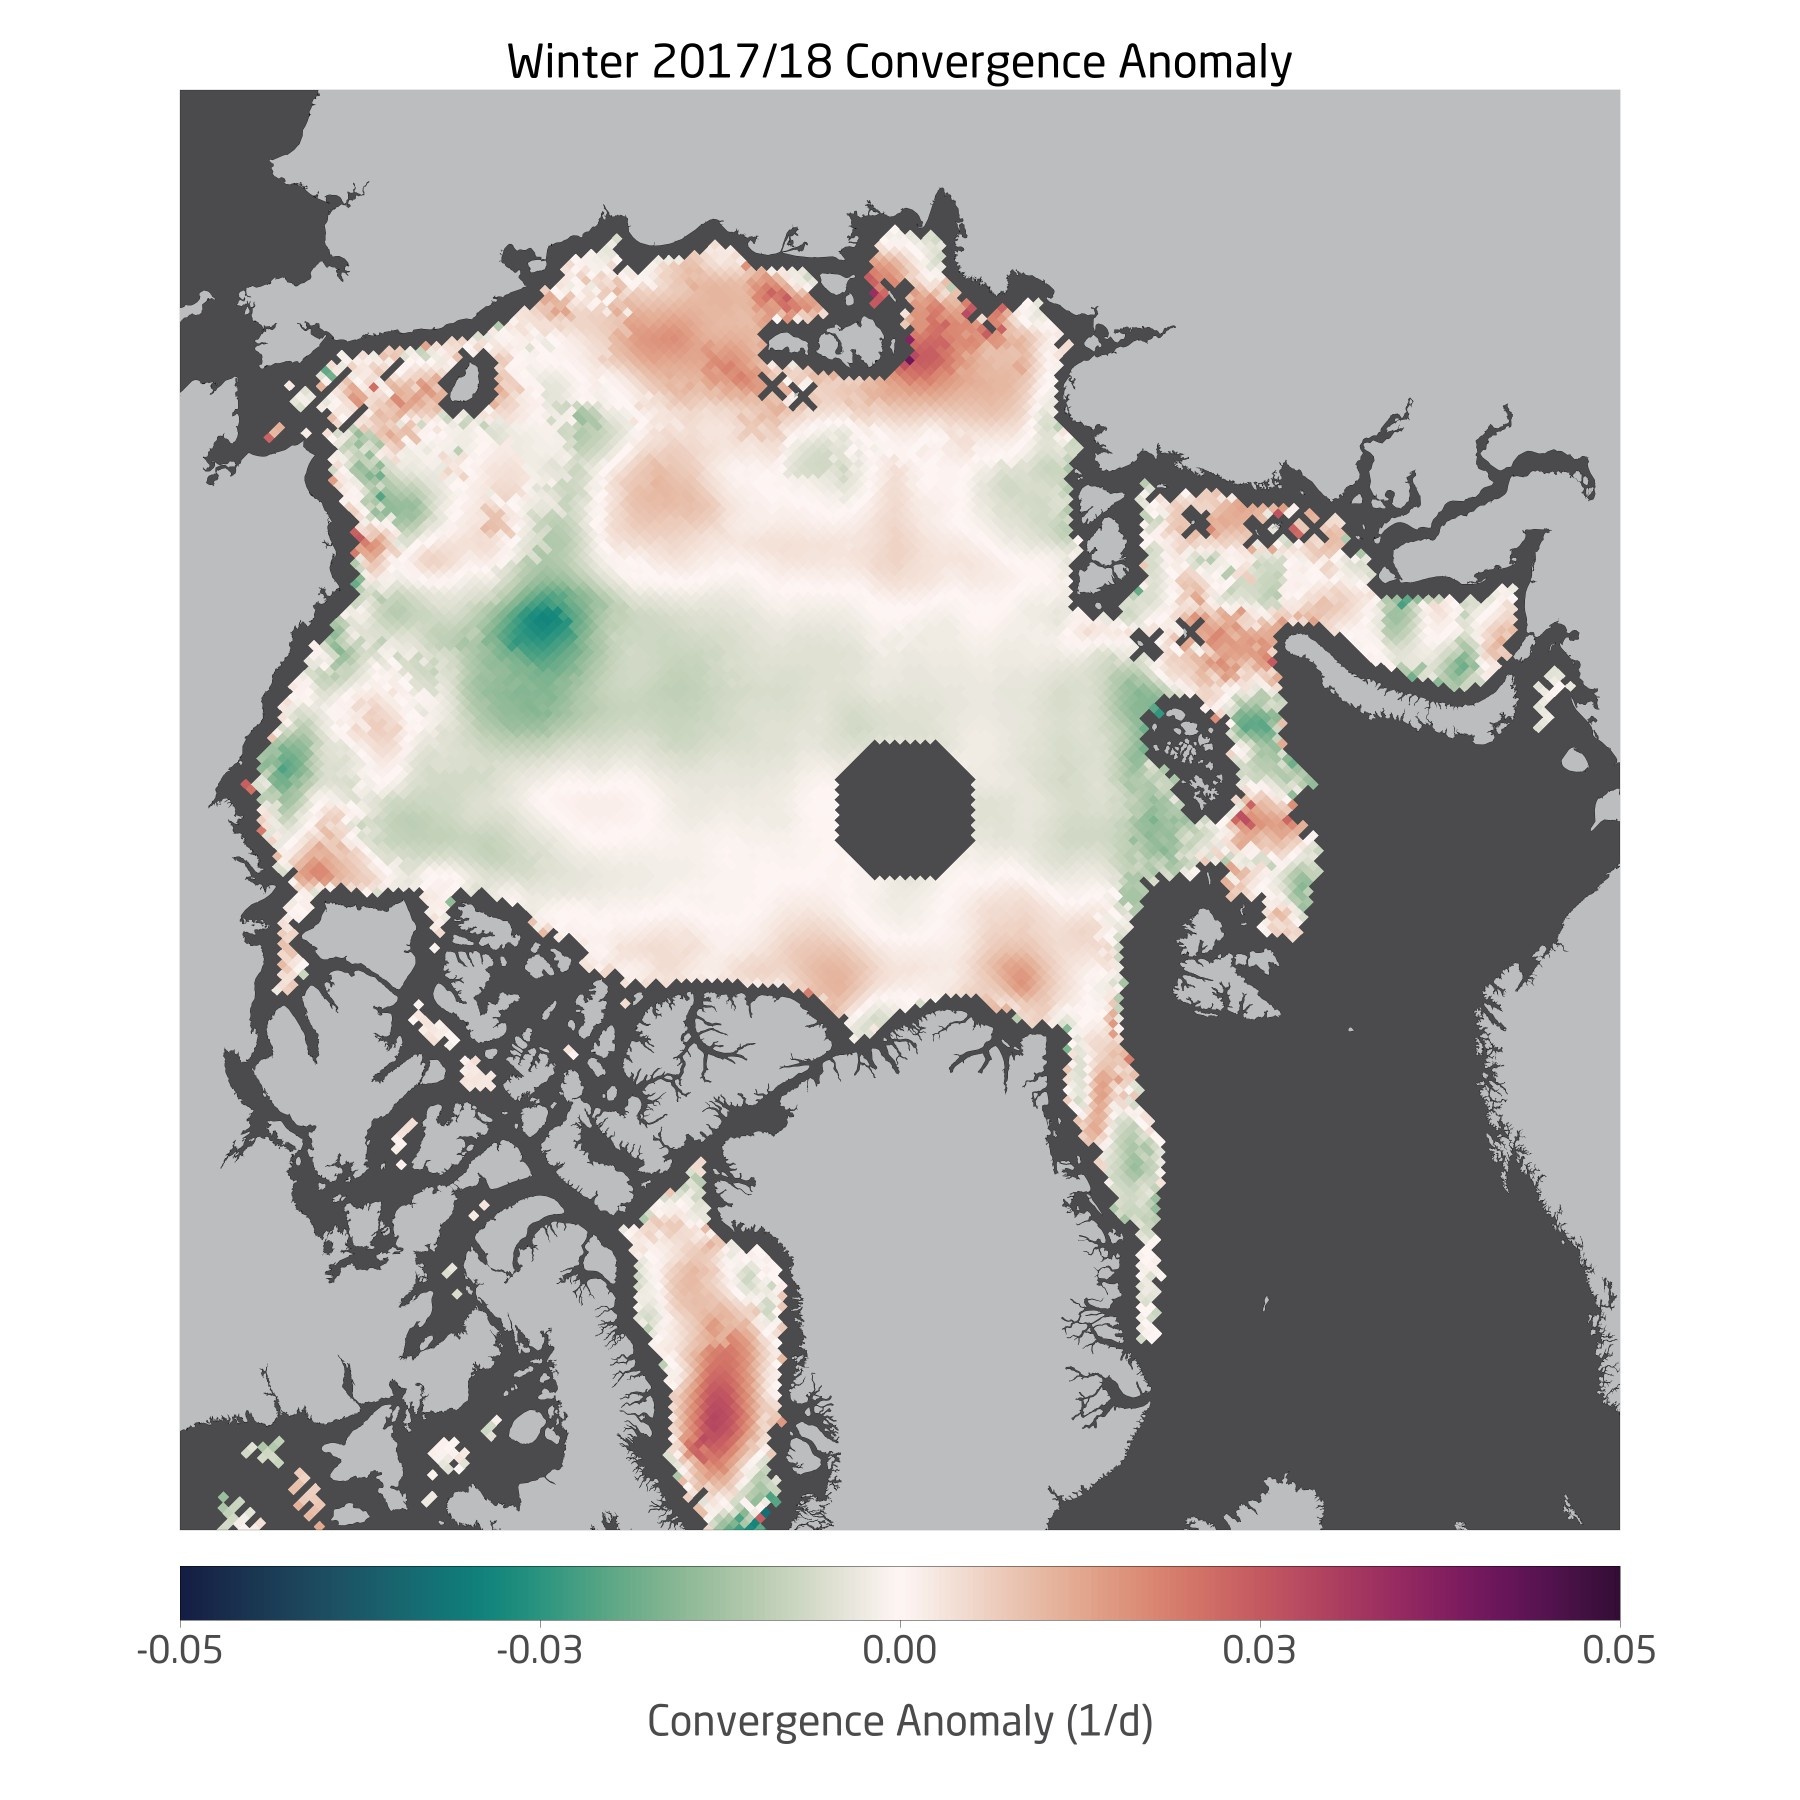
Corresponding ice convergence anomaly from OSI-SAF ice drift data
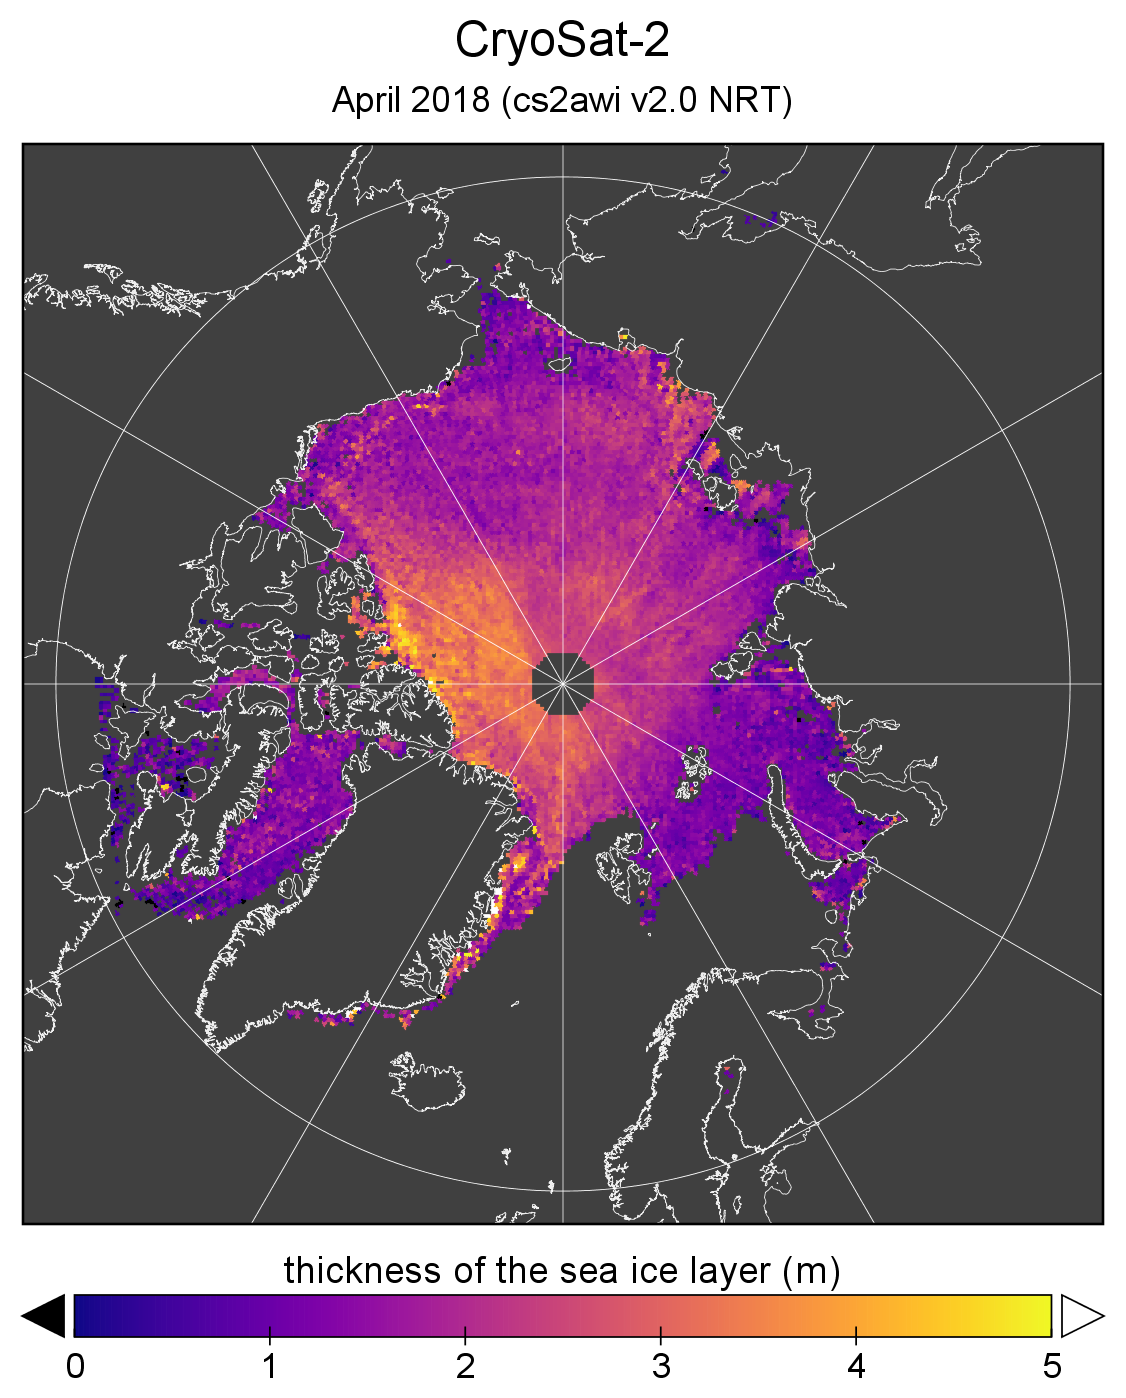
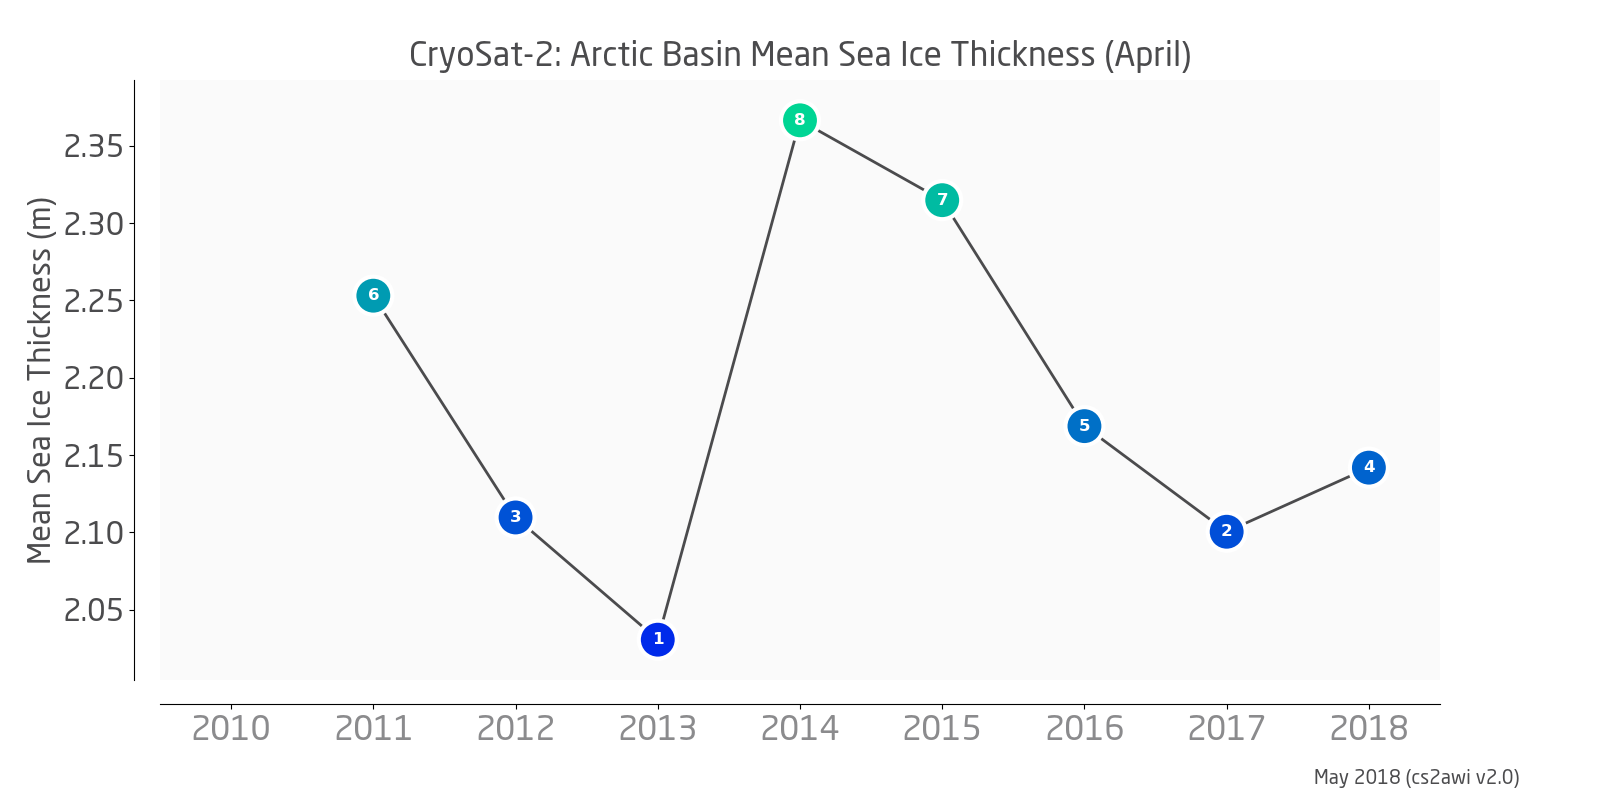
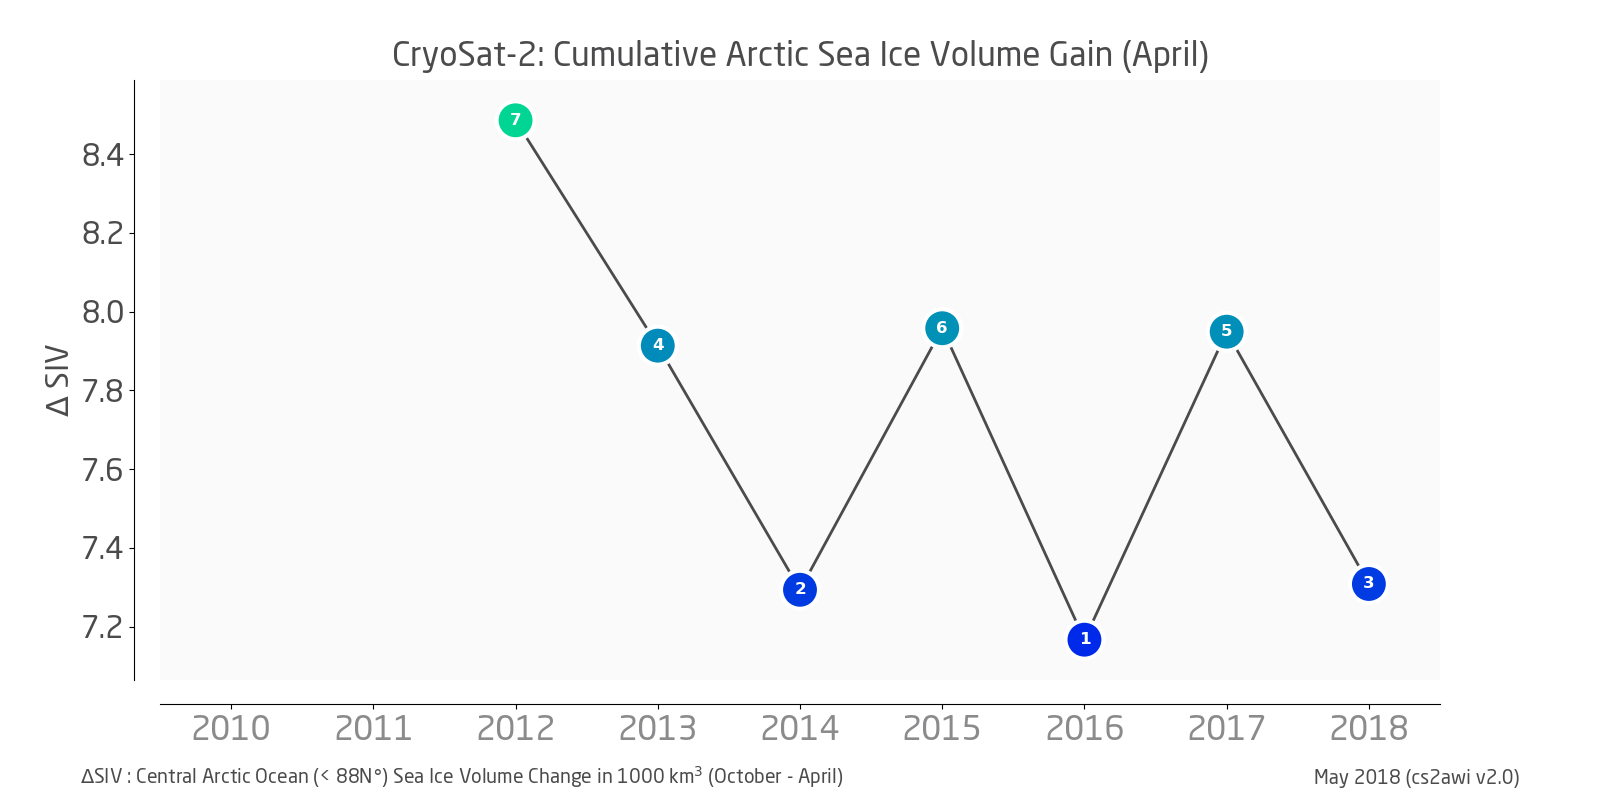
With monthly mean thickness in April 2018, the 8th Arctic winter season of 2017/2018 is now complete.
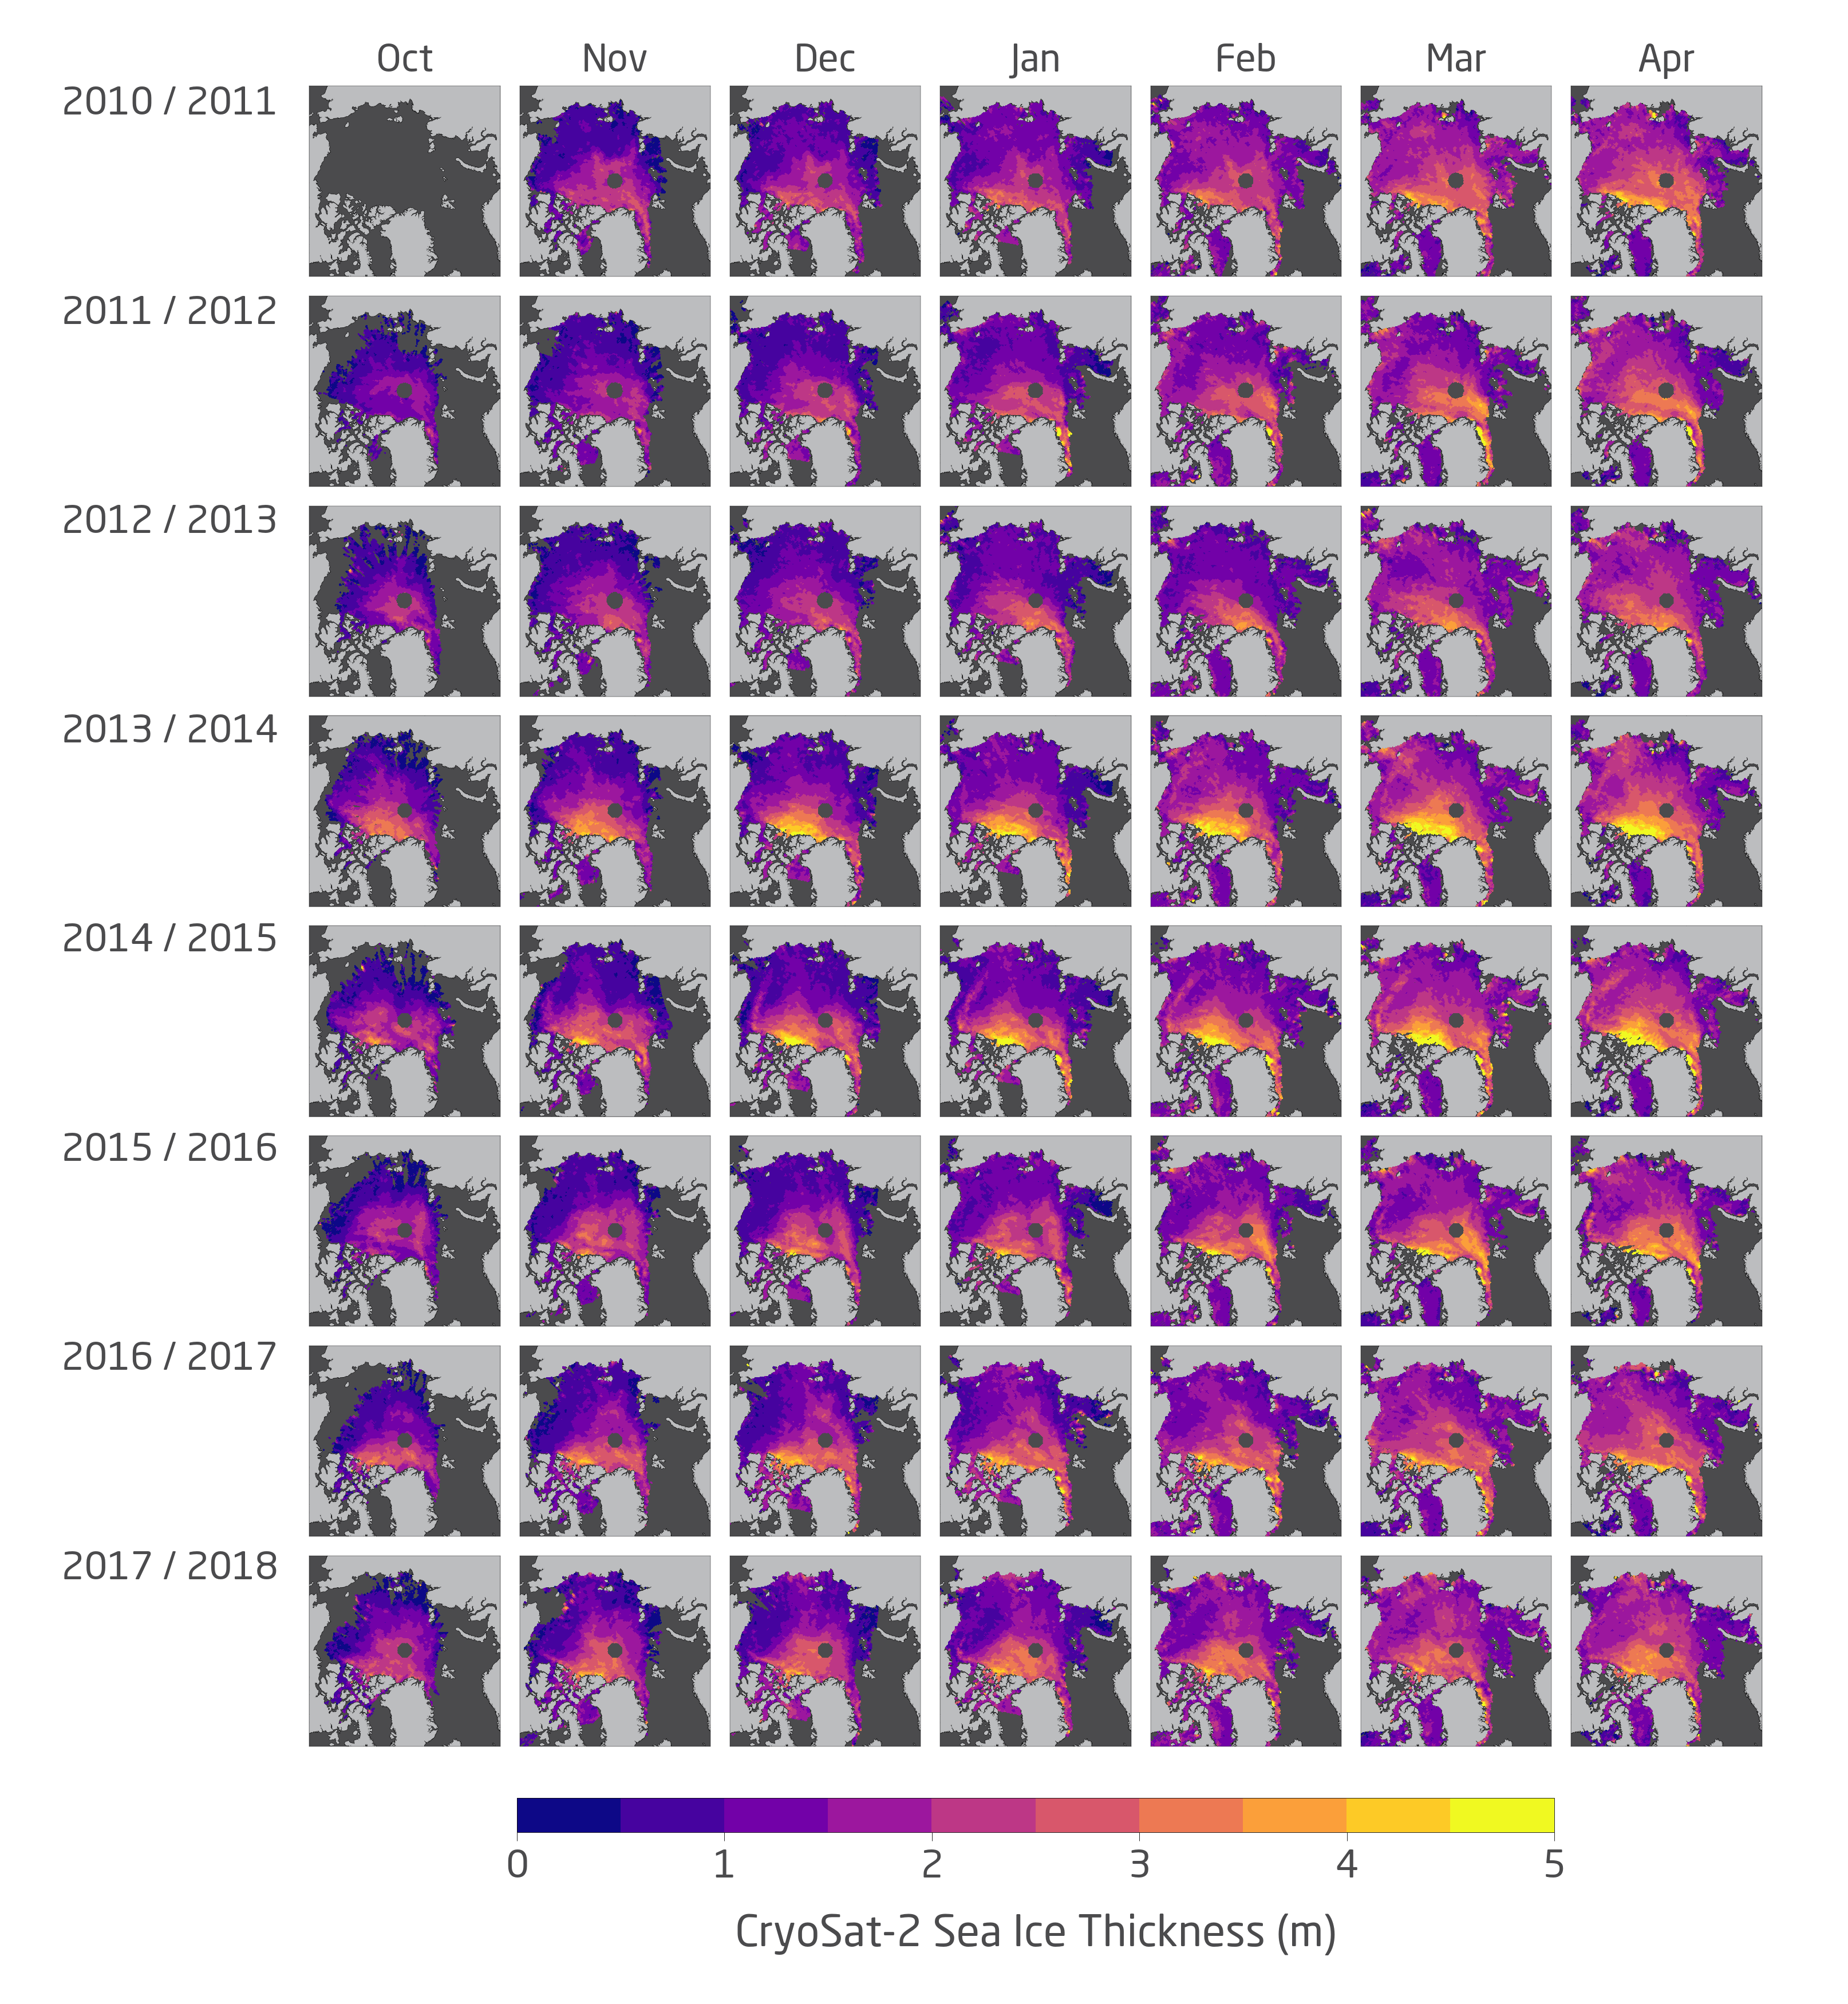
All monthly mean CryoSat-2 Arctic sea ice thickness fields
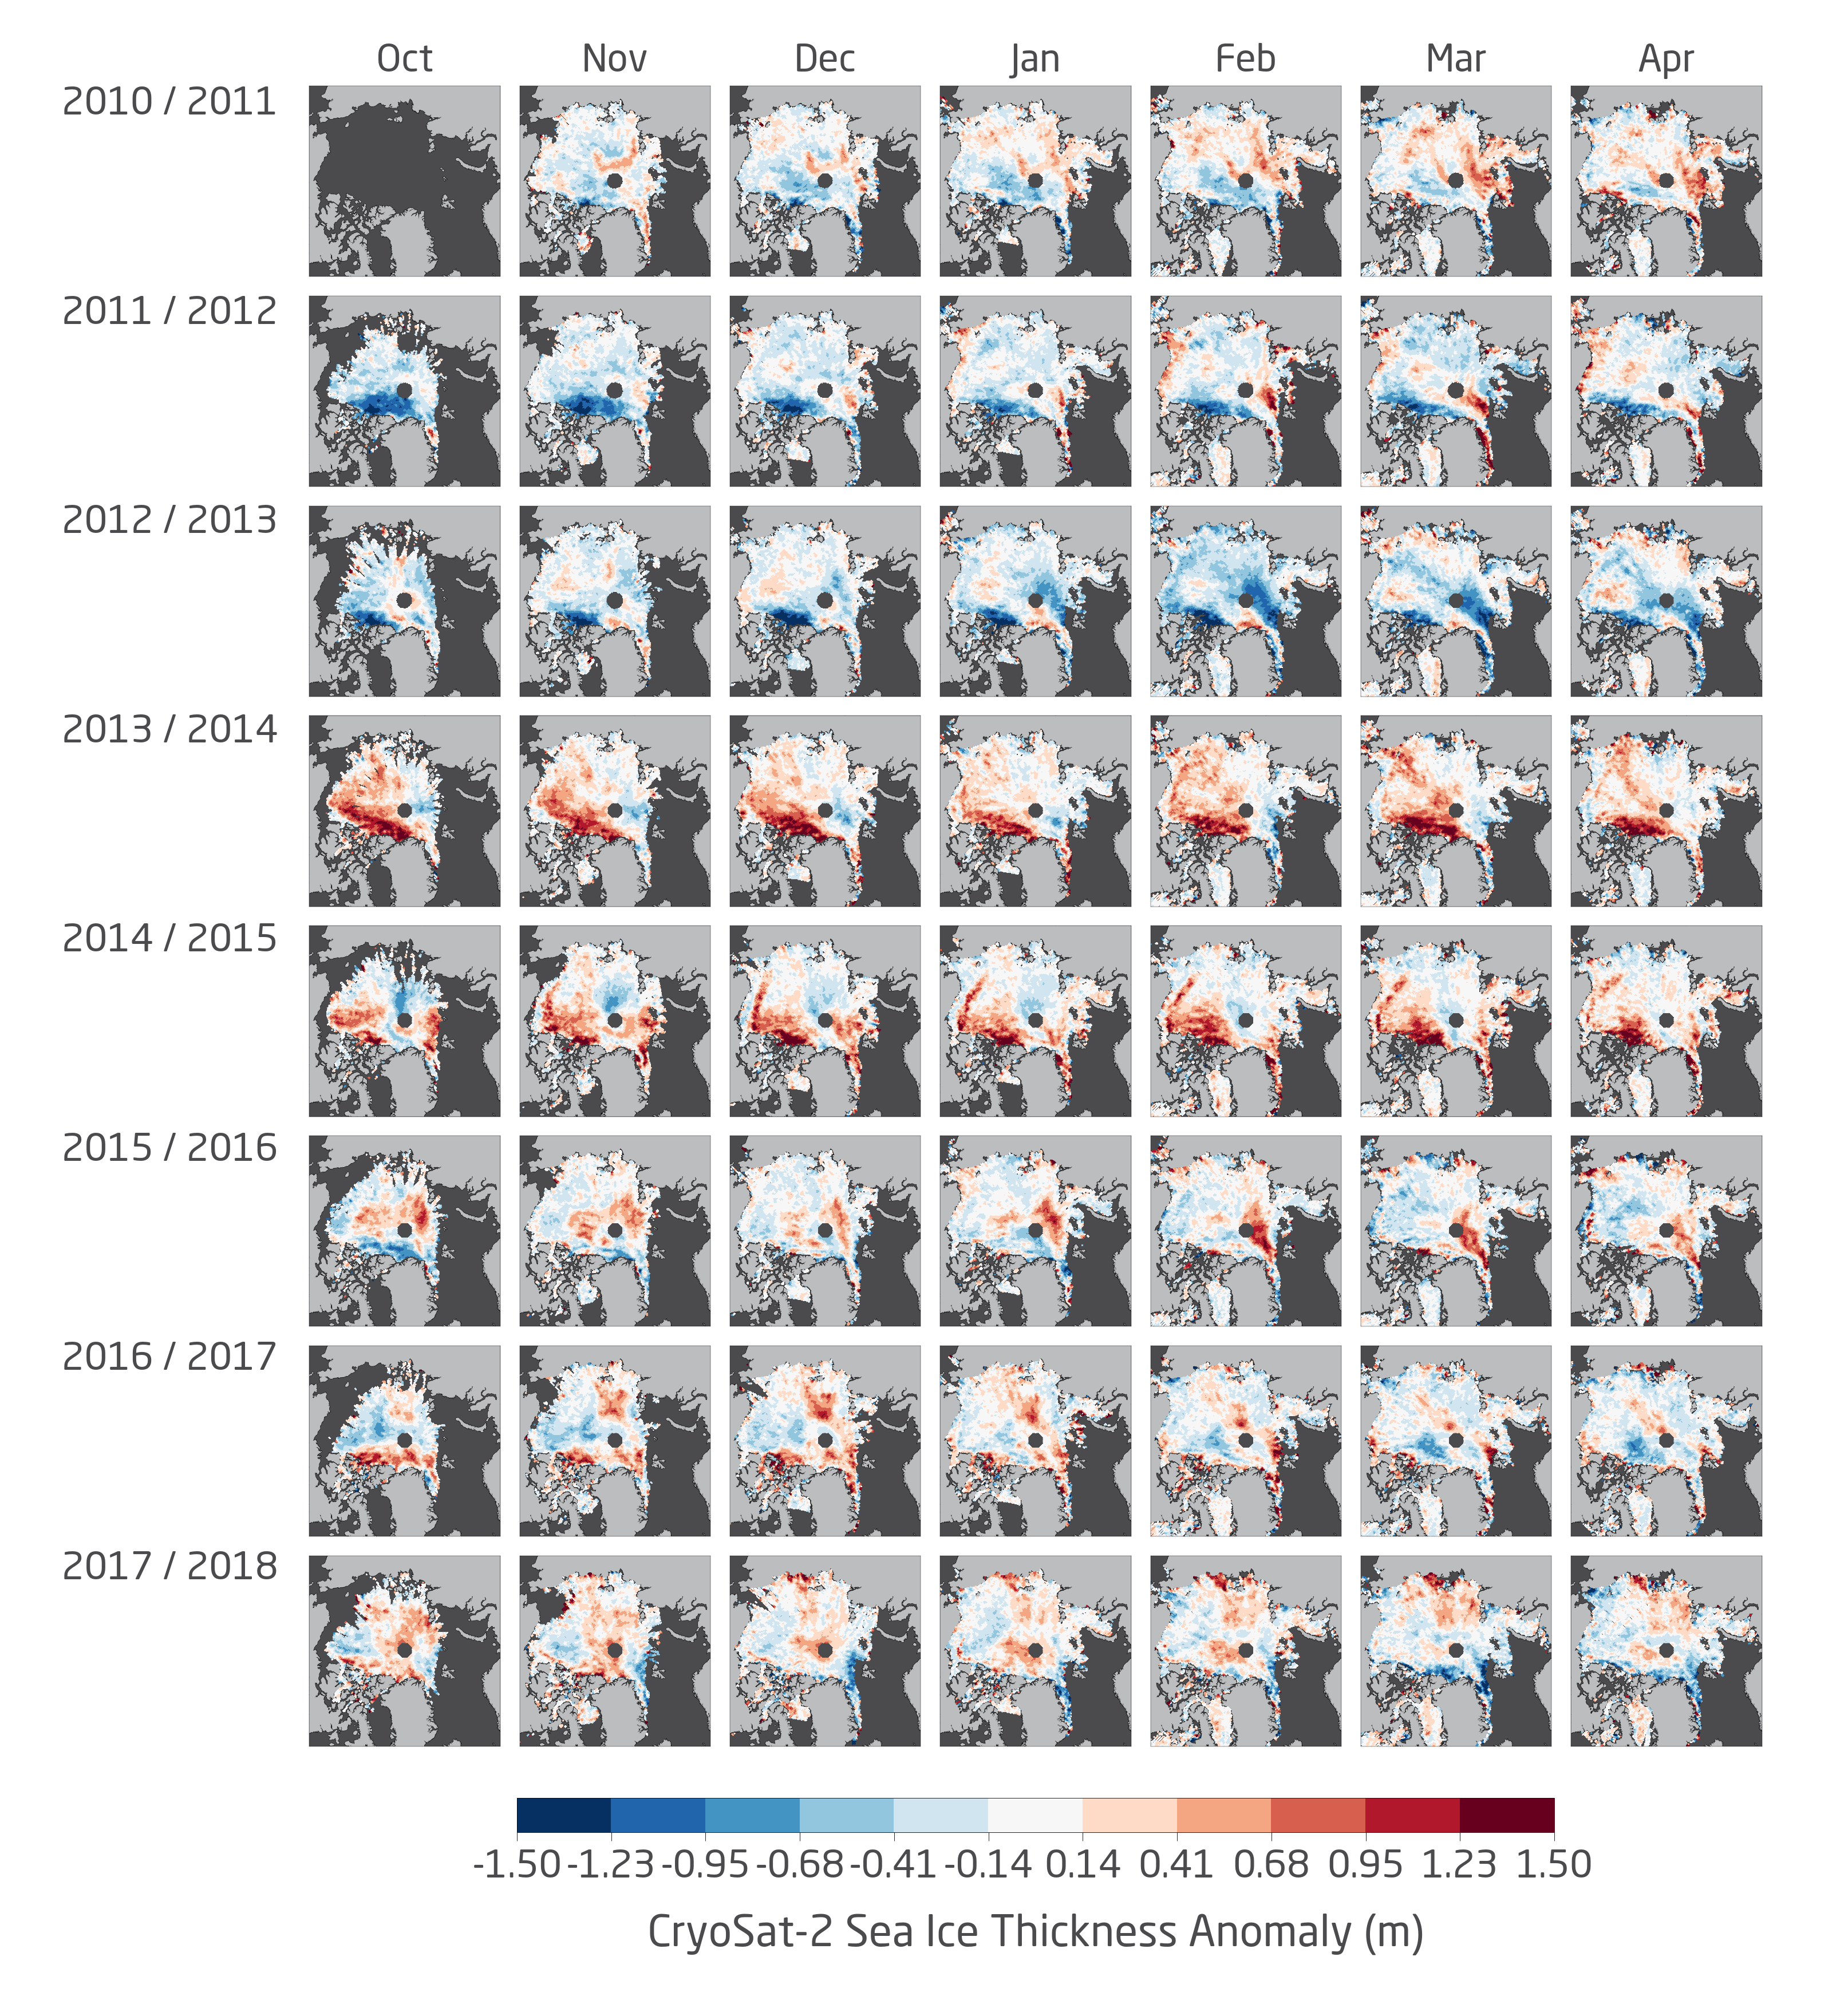
All monthly mean CryoSat-2 Arctic sea ice thickness anomaly fields
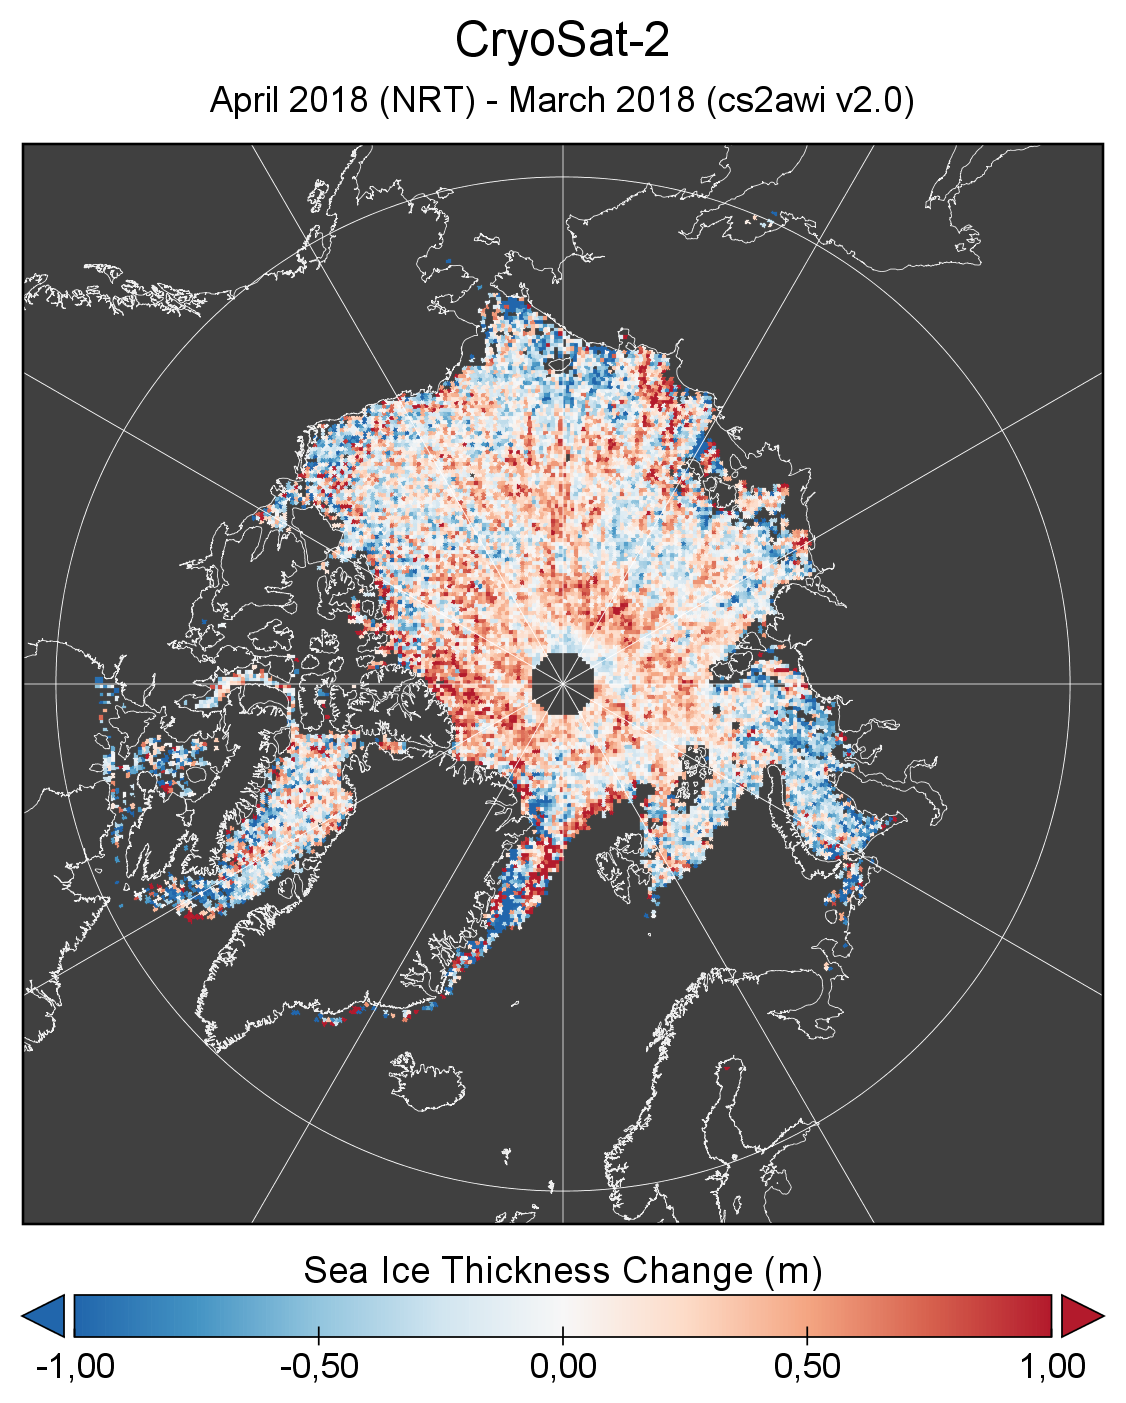
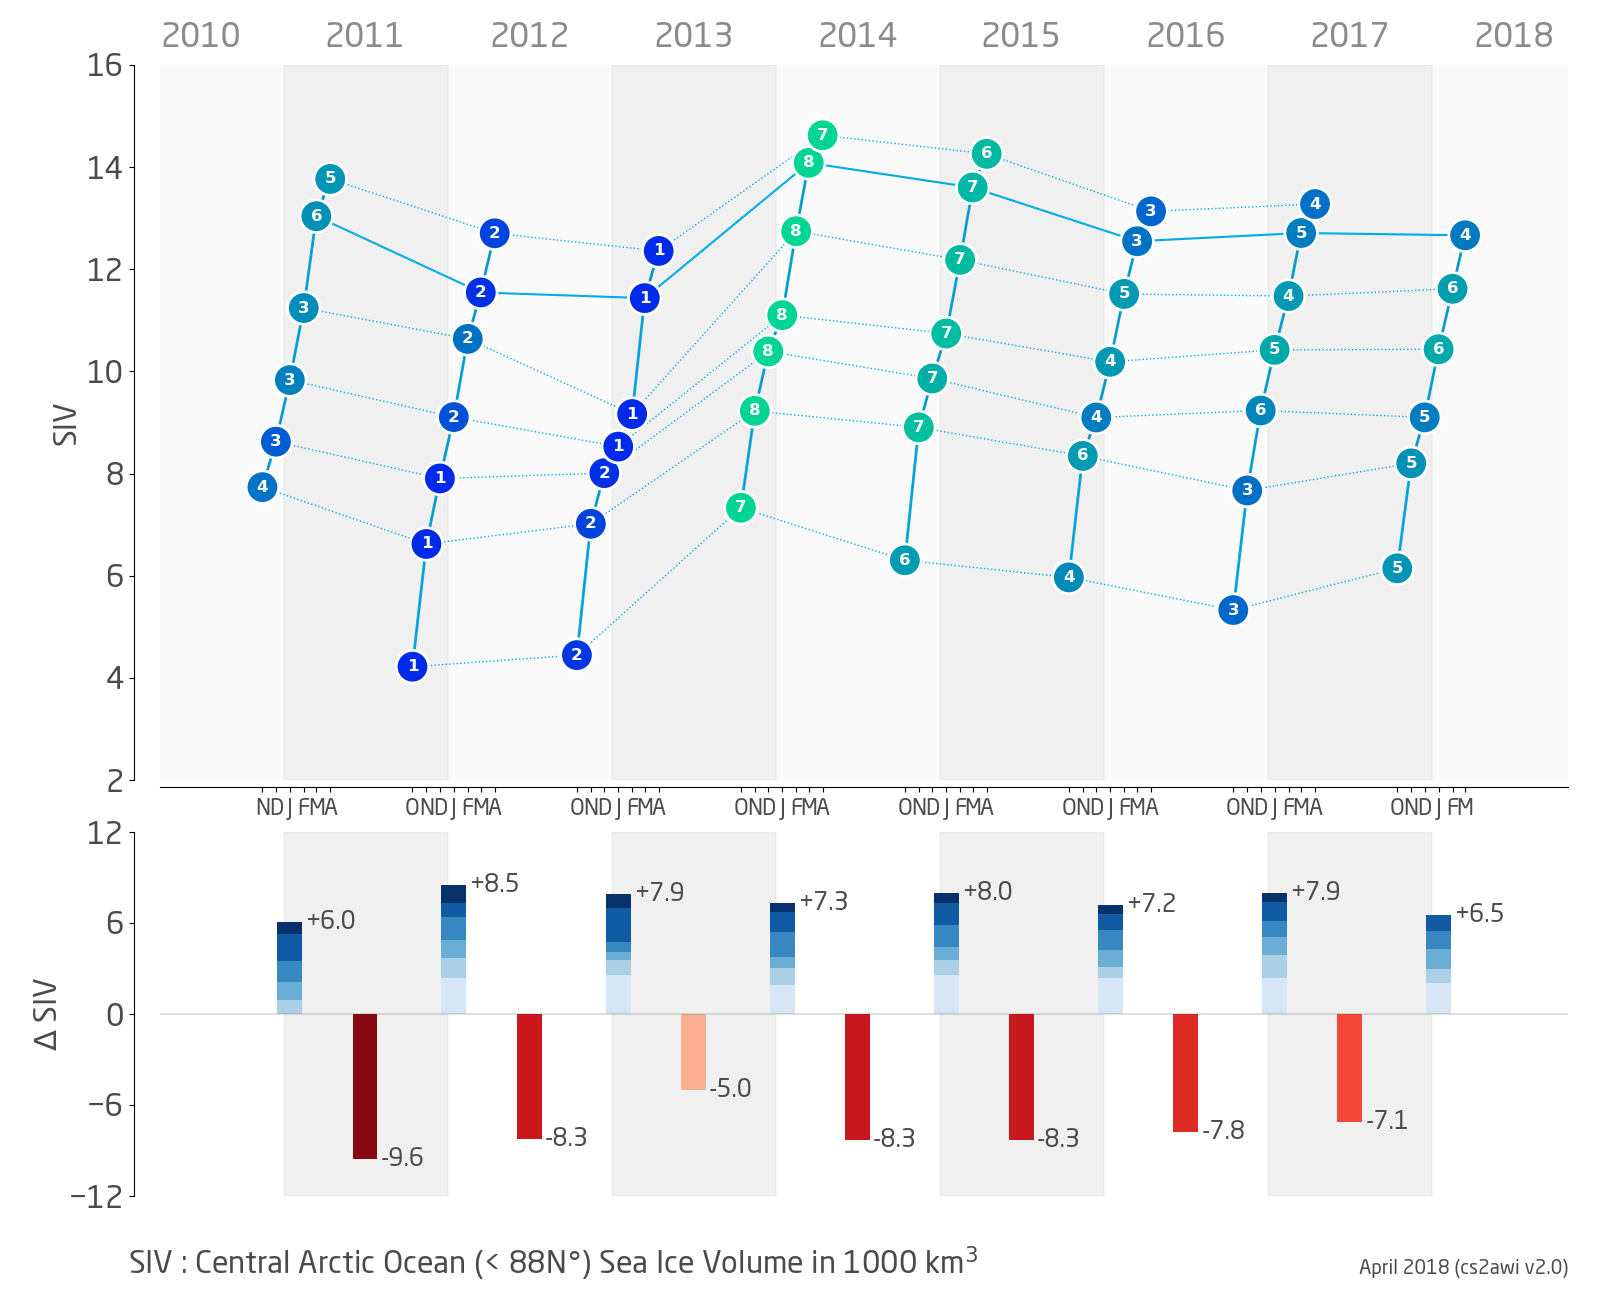
Arctic sea ice thickness information has been updated with NRT data for April 2018 and reprocessed data for March 2018. Daily, weekly and monthly products are available here: Reprocessed, Near-real time


Short Facts
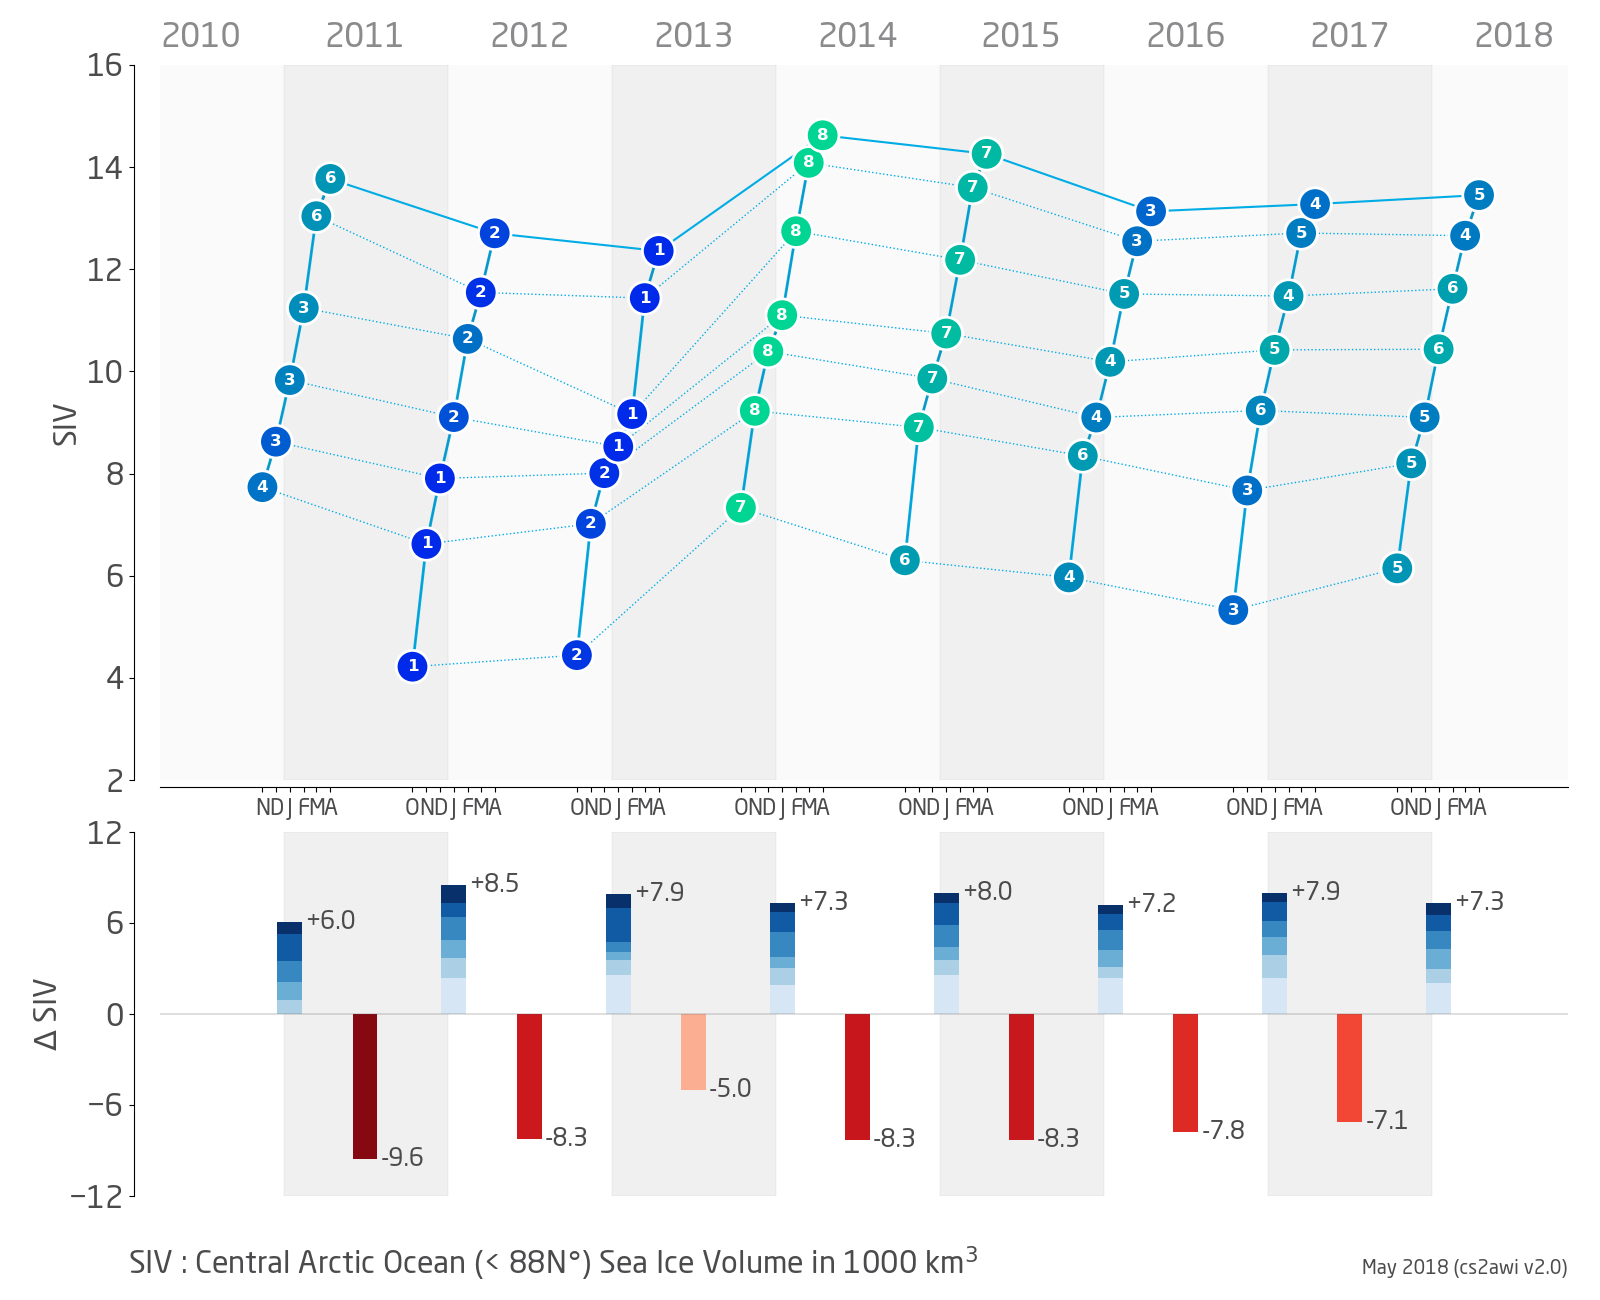
- April sea ice volume in the central Arctic was average (5th lowest / 4th highest) in 8 years of CryoSat-2 observations: 13.45 • 103 km3
- highest: 14.62 • 103 km3 in Apr 2014
- lowest: 12.36 • 103 km3 in Apr 2013
- average: 13.45 • 103 km3
- April mean sea ice thickness in the central Arctic was below average in 8 years of CryoSat-2 observations: 2.14 m
- highest: 2.29 m in Apr 2014
- lowest: 2.03 m in Apr 2013
- average: 2.19 m
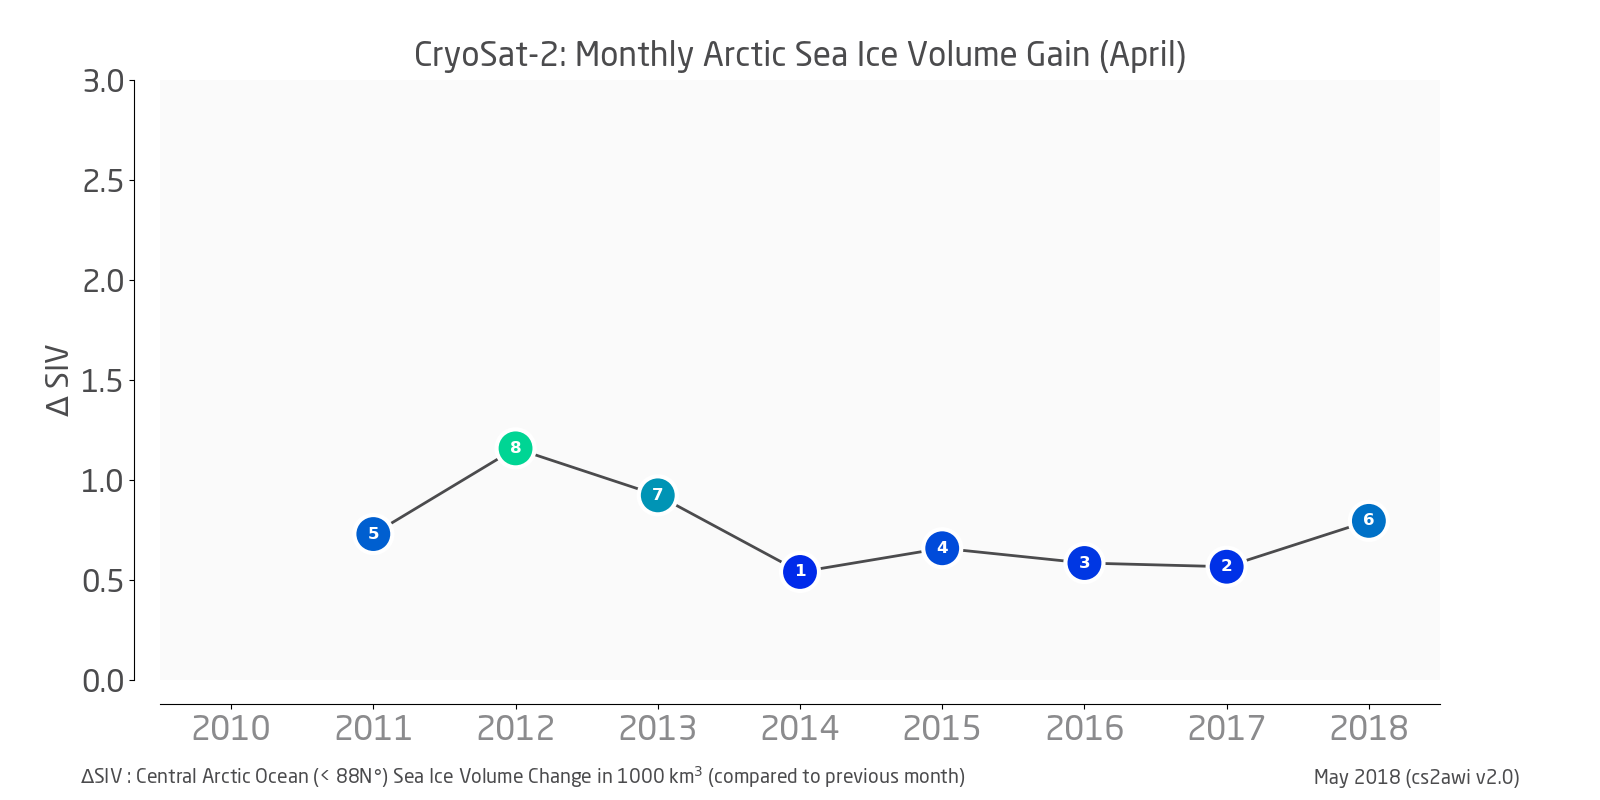
- Monthly sea ice volume gain (March through April) was above average in 8 years of CryoSat-2 observations: +0.80 • 103 km3
- highest: +1.16 • 103 km3 in Apr 2012
- lowest: +0.54 • 103 km3 in Apr 2014
- average: +0.74 • 103 km3
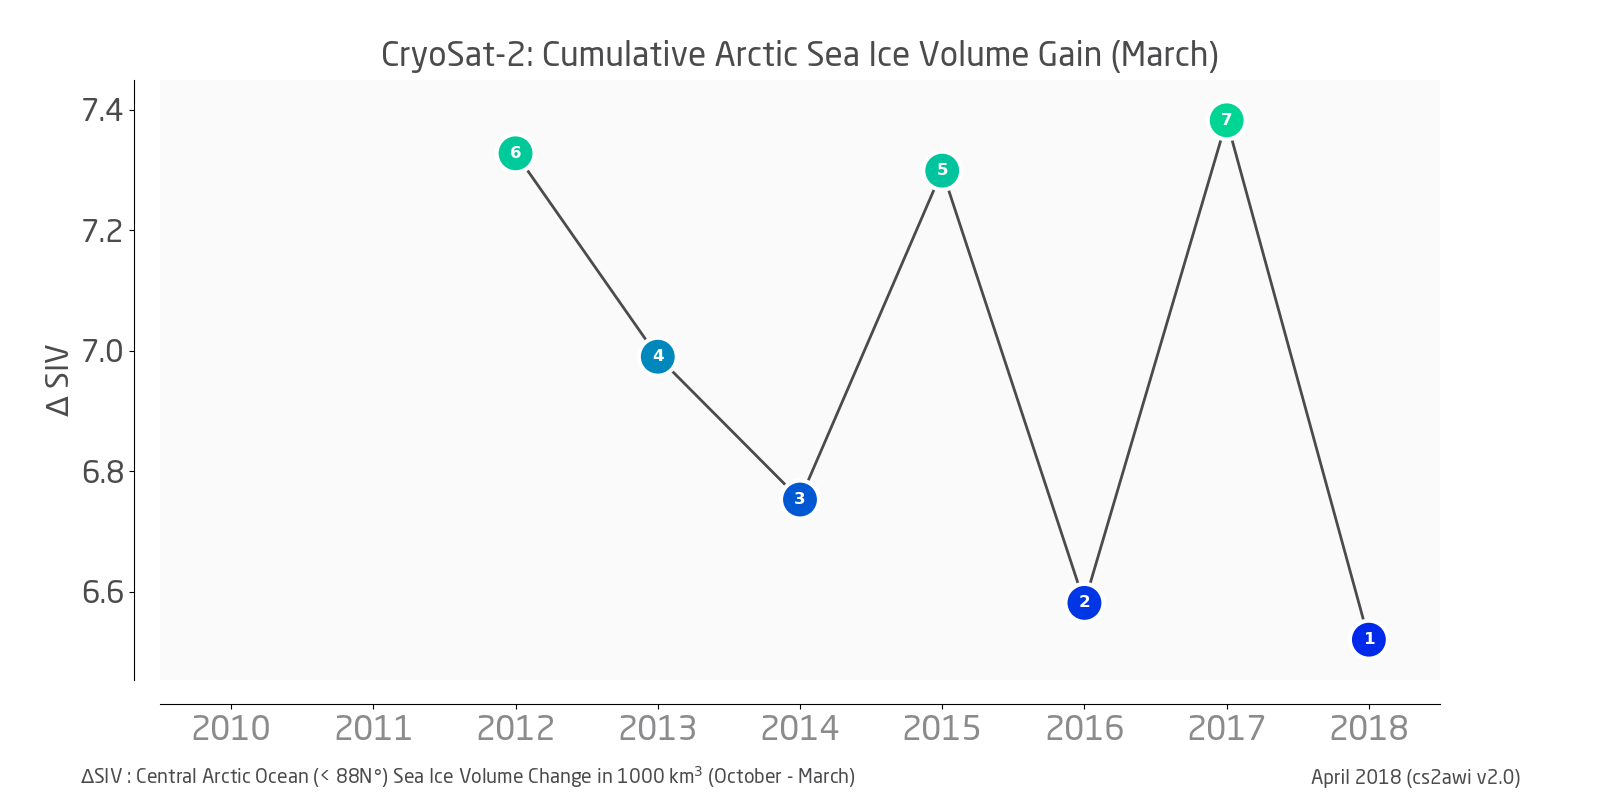
- Cummulative sea ice volume gain (October through April) was below average in 8 years of CryoSat-2 observations: +7.31 • 103 km3
- highest: +8.94 • 103 km3 in winter 2011/2012
- lowest: +7.17 • 103 km3 in winter 2015/2016
- average: +7.73 • 103 km3
All attachments are available under CC BY 4.0 license. Please cite with "Stefan Hendricks & Robert Ricker, Alfred Wegener Institute"
The production of the sea ice thickness climate data record of the ESA Climate Change Initiative (CCI) has been finalized. The files are currently being registered with their respective doi's and official dissimination will commence shortly.
The CCI sea ice thickness climate data record is based on 15 year of satellite radar altimeter data from Envisat and CryoSat-2 data and provides daily trajectory (l2p) and monthly gridded (l3c) observations between 2002 and 2017 in netCDF format. For the first time, the radar altimeter data record has been extended to the southern hemisphere with year-around freeboard and thickness retrieval which is possible due to the absence of melt ponds. The version of the product is v2.0 to indicate that this is the outcome of the second phase of the CCI project.
The dataset allows the investigation of sea ice thickness time series within the Envisat below a latitude of 81.45 degrees. Only with the onset of CryoSat-2 data availability, sea ice thickness observations are available in the high latitude (< 88N) of the central Arctic Ocean. In the Antarctic however, the Envisat type orbit is sufficient to cover the full sea ice cover which allows the analysis of true sea ice volume.
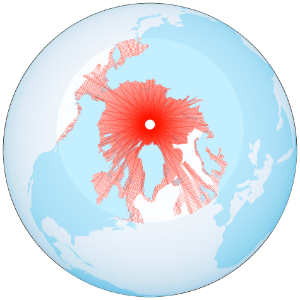
CryoSat-2 Northern hemisphere orbit coverage
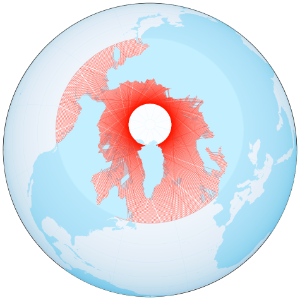
Envisat Northern hemisphere orbit coverage
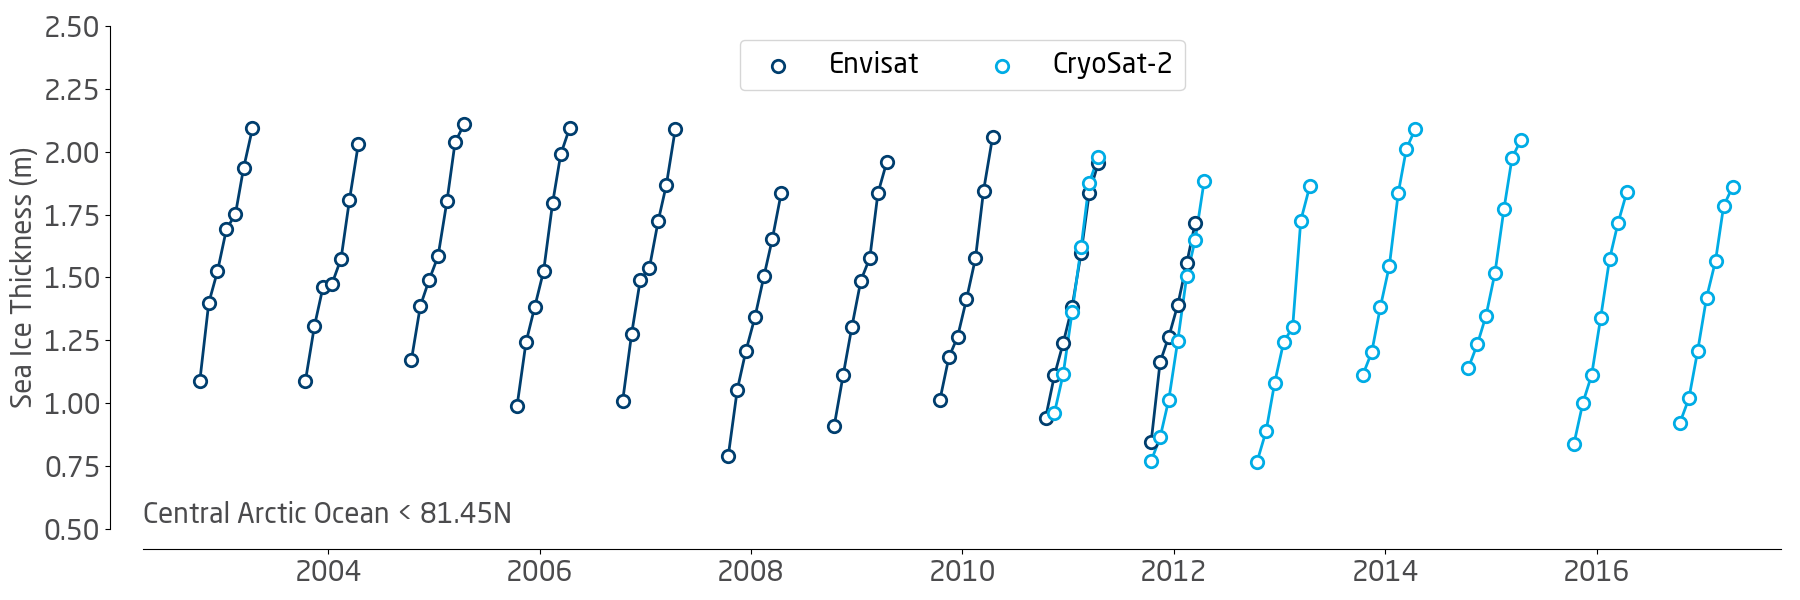
Mean monthly Arctic basin sea ice thickness in the winter month between October and April (within the Envisat orbit: < 81.45N)
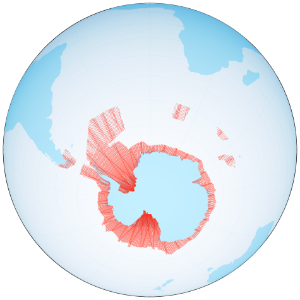
CryoSat-2 Northern hemisphere orbit coverage
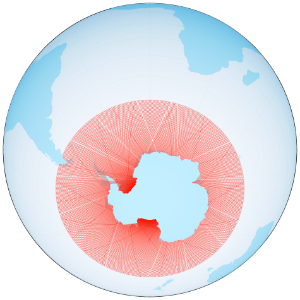
Envisat Southern hemisphere orbit coverage
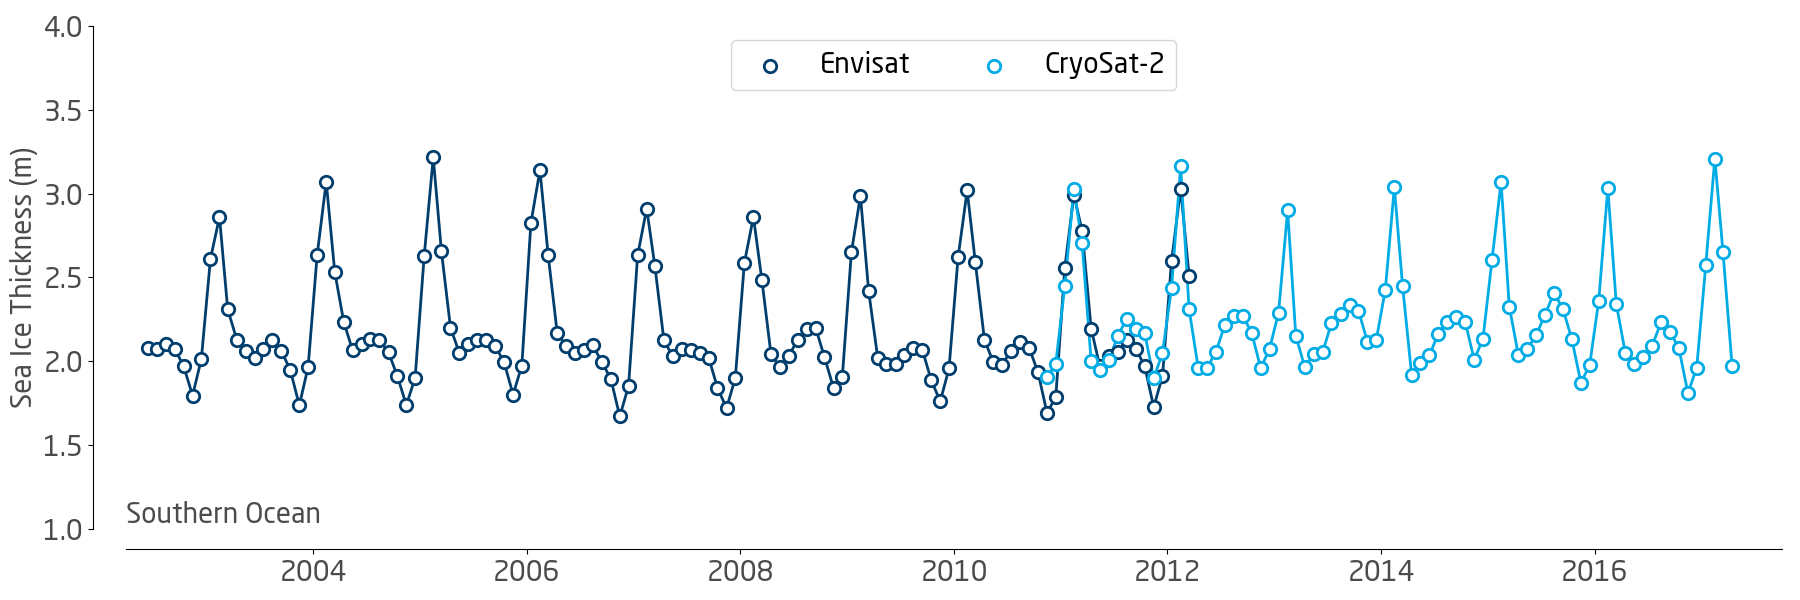
Mean monthly Antarctic-wide sea ice thickness of the experimental climate data record for the southern hemisphere
Data sets of the CCI sea ice thickness climate data record
The climate record contains the all days/month for both satellites and hemispheres. Both satellites have an overlap period between November 2010 and March 2012 which can be used to study the different performance of the two radar altimeter generations for sea ice thickness retrieval.
A description of the datasets and a graphical coverage report of the daily l2p trajectory data is given below.
| Dataset | Product Level | Begin | End | Coverage |
|---|---|---|---|---|
Northern Hemisphere Sea Ice Thickness from the CryoSat-2 satellite, v2.0 | L2P (Daily) | 2010-11-01 | 2017-04-30 | October through April |
| Northern Hemisphere Sea Ice Thickness from the CryoSat-2 satellite, v2.0 | L3C (Monthly) | 2010-11-01 | 2017-04-30 | October through April |
| Southern Hemisphere Sea Ice Thickness from the CryoSat-2 satellite, v2.0 | L2P (Daily) | 2010-11-01 | 2017-04-30 | Year-around |
| Southern Hemisphere Sea Ice Thickness from the CryoSat-2 satellite, v2.0 | L3C (Monthly) | 2010-11-01 | 2017-04-30 | Year-around |
| Northern Hemisphere Sea Ice Thickness from the Envisat satellite, v2.0 | L2P (Daily) | 2002-10-01 | 2012-03-31 | October through April |
| Northern Hemisphere Sea Ice Thickness from the Envisat satellite, v2.0 | L3C (Monthly) | 2002-10-01 | 2012-03-31 | October through April |
| Southern Hemisphere Sea Ice Thickness from the Envisat satellite, v2.0 | L2P (Daily) | 2002-06-01 | 2012-03-31 | Year-around |
| Southern Hemisphere Sea Ice Thickness from the Envisat satellite, v2.0 | L3C (Monthly) | 2002-06-01 | 2012-03-31 | Year-around |
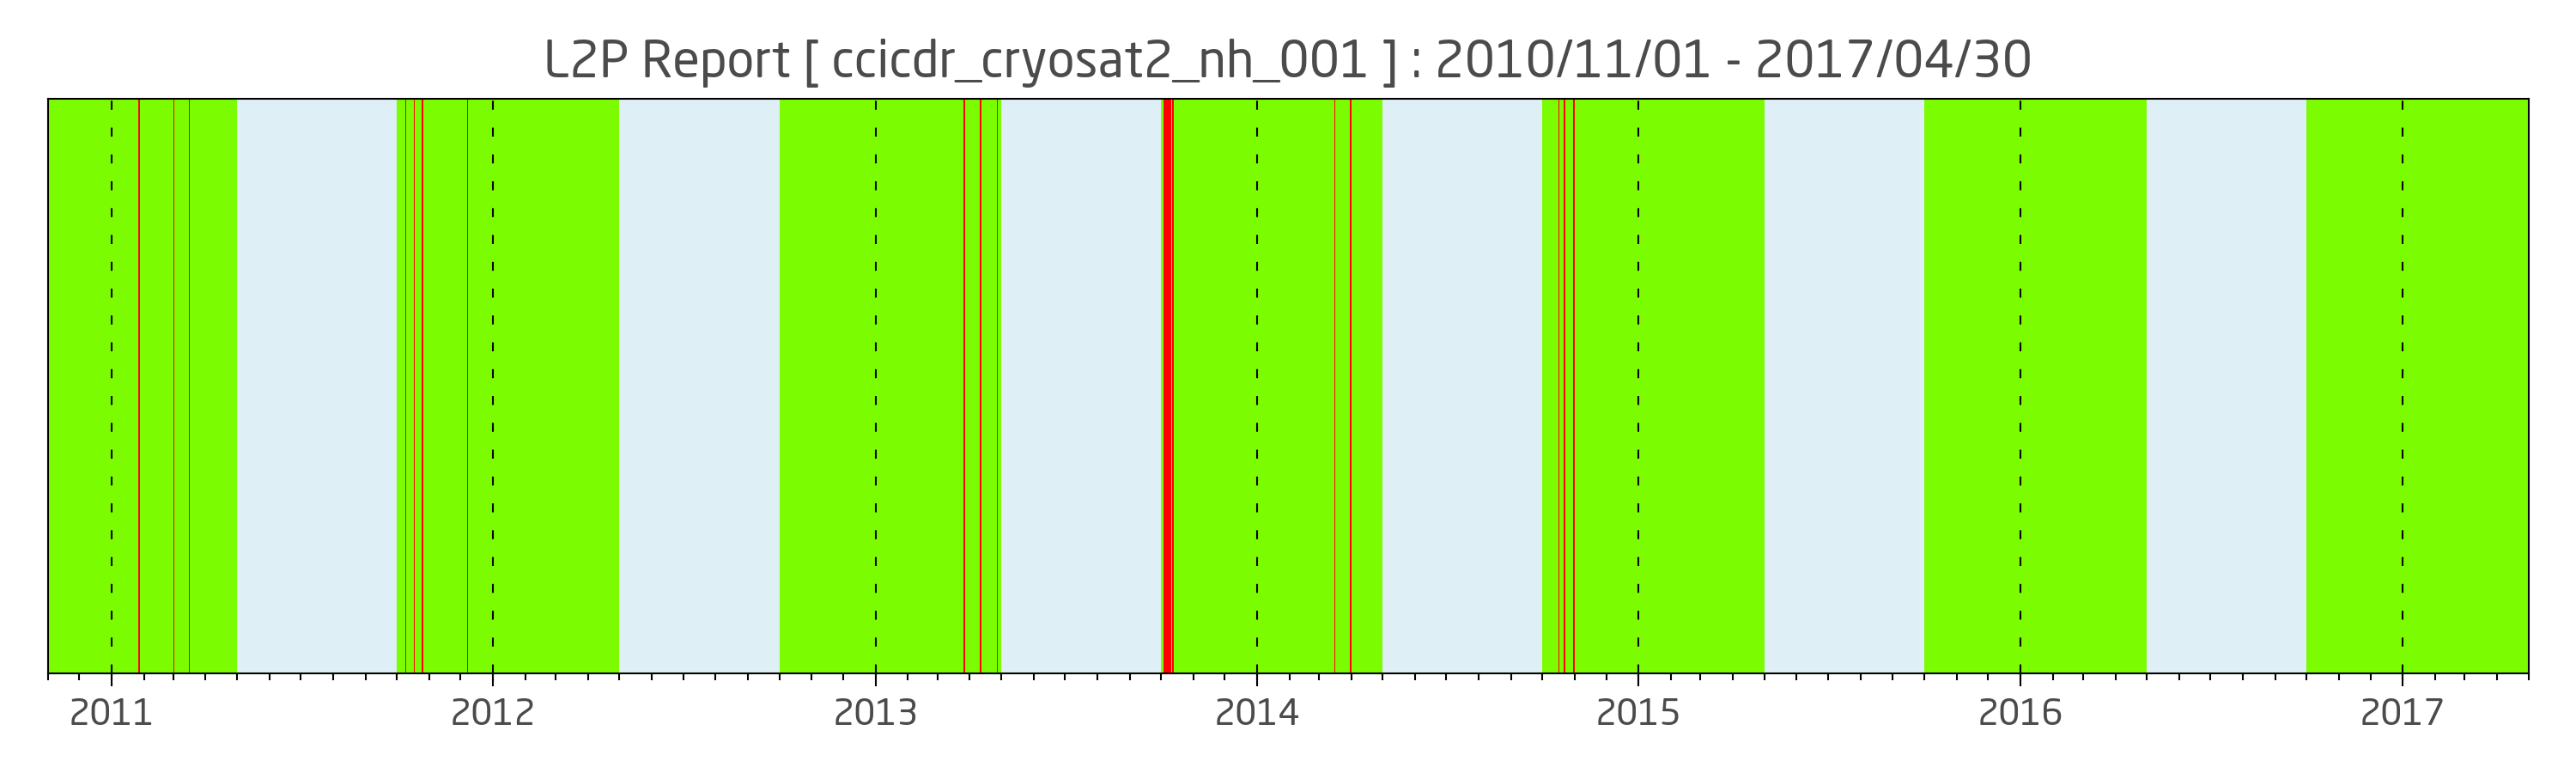
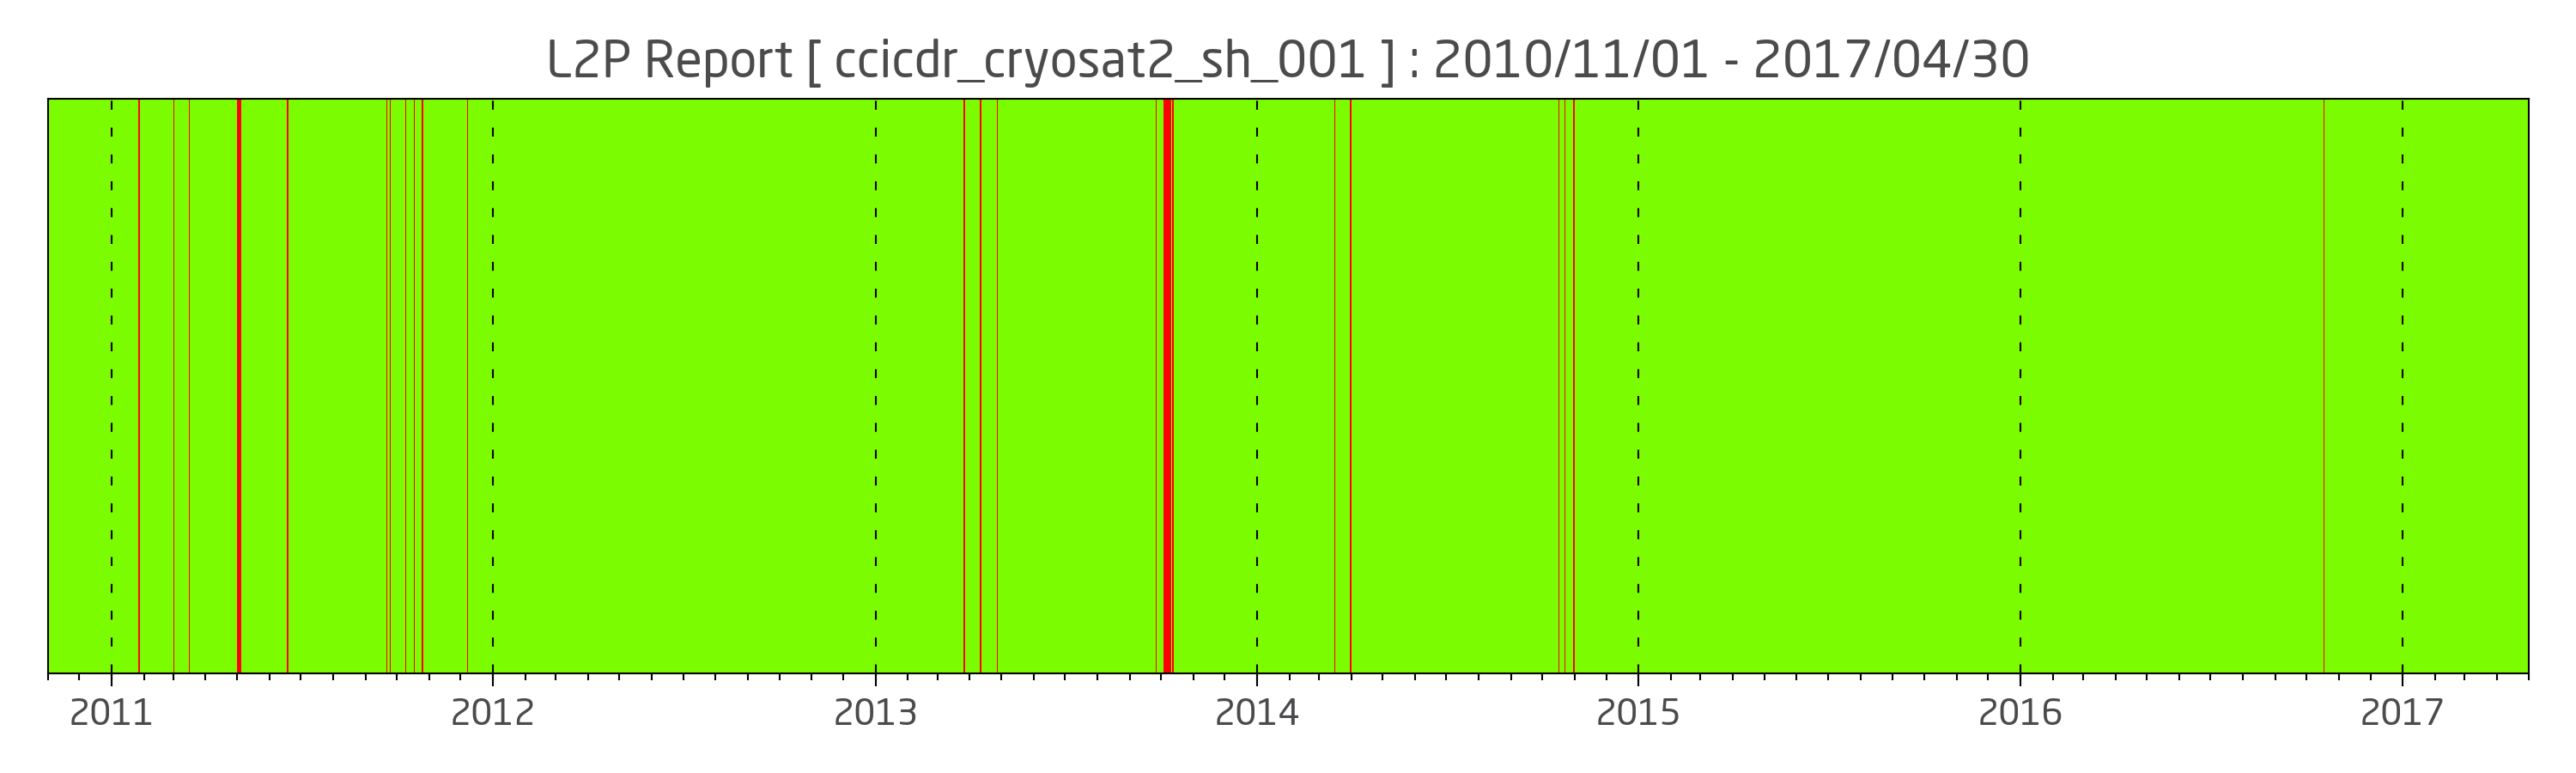
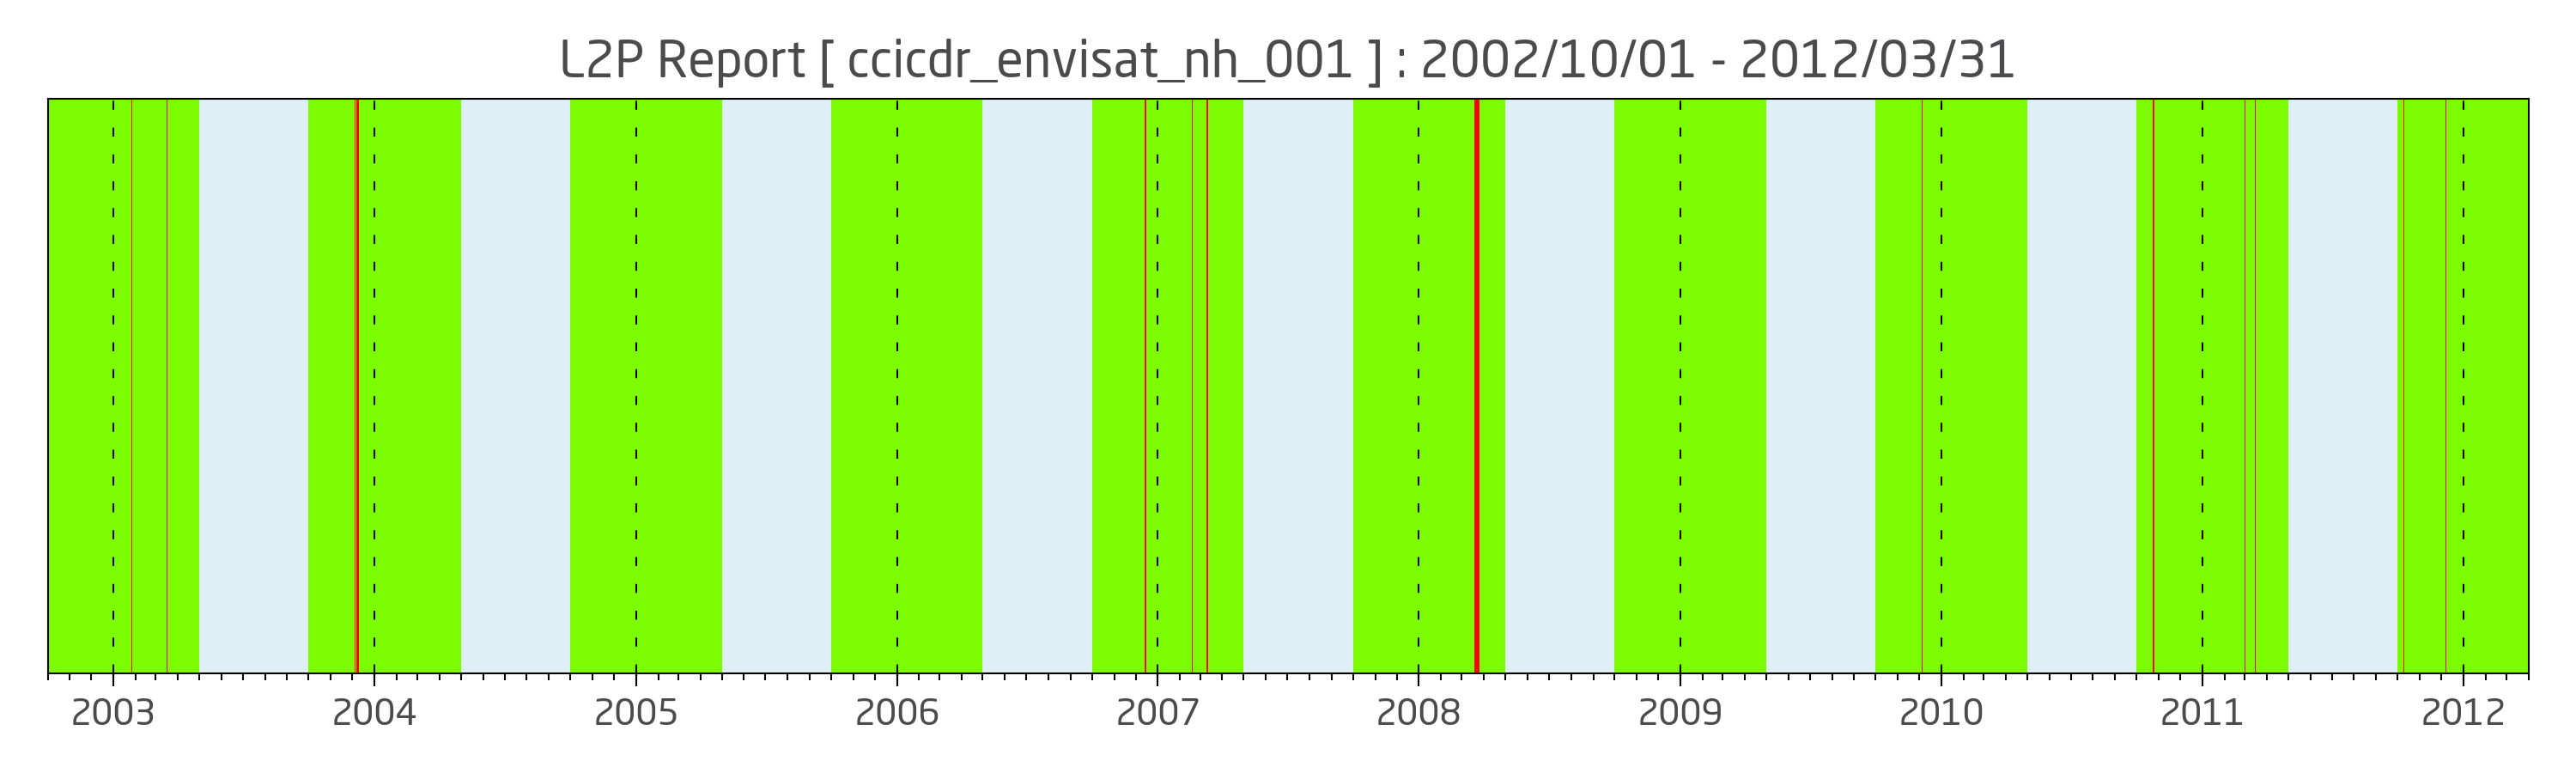
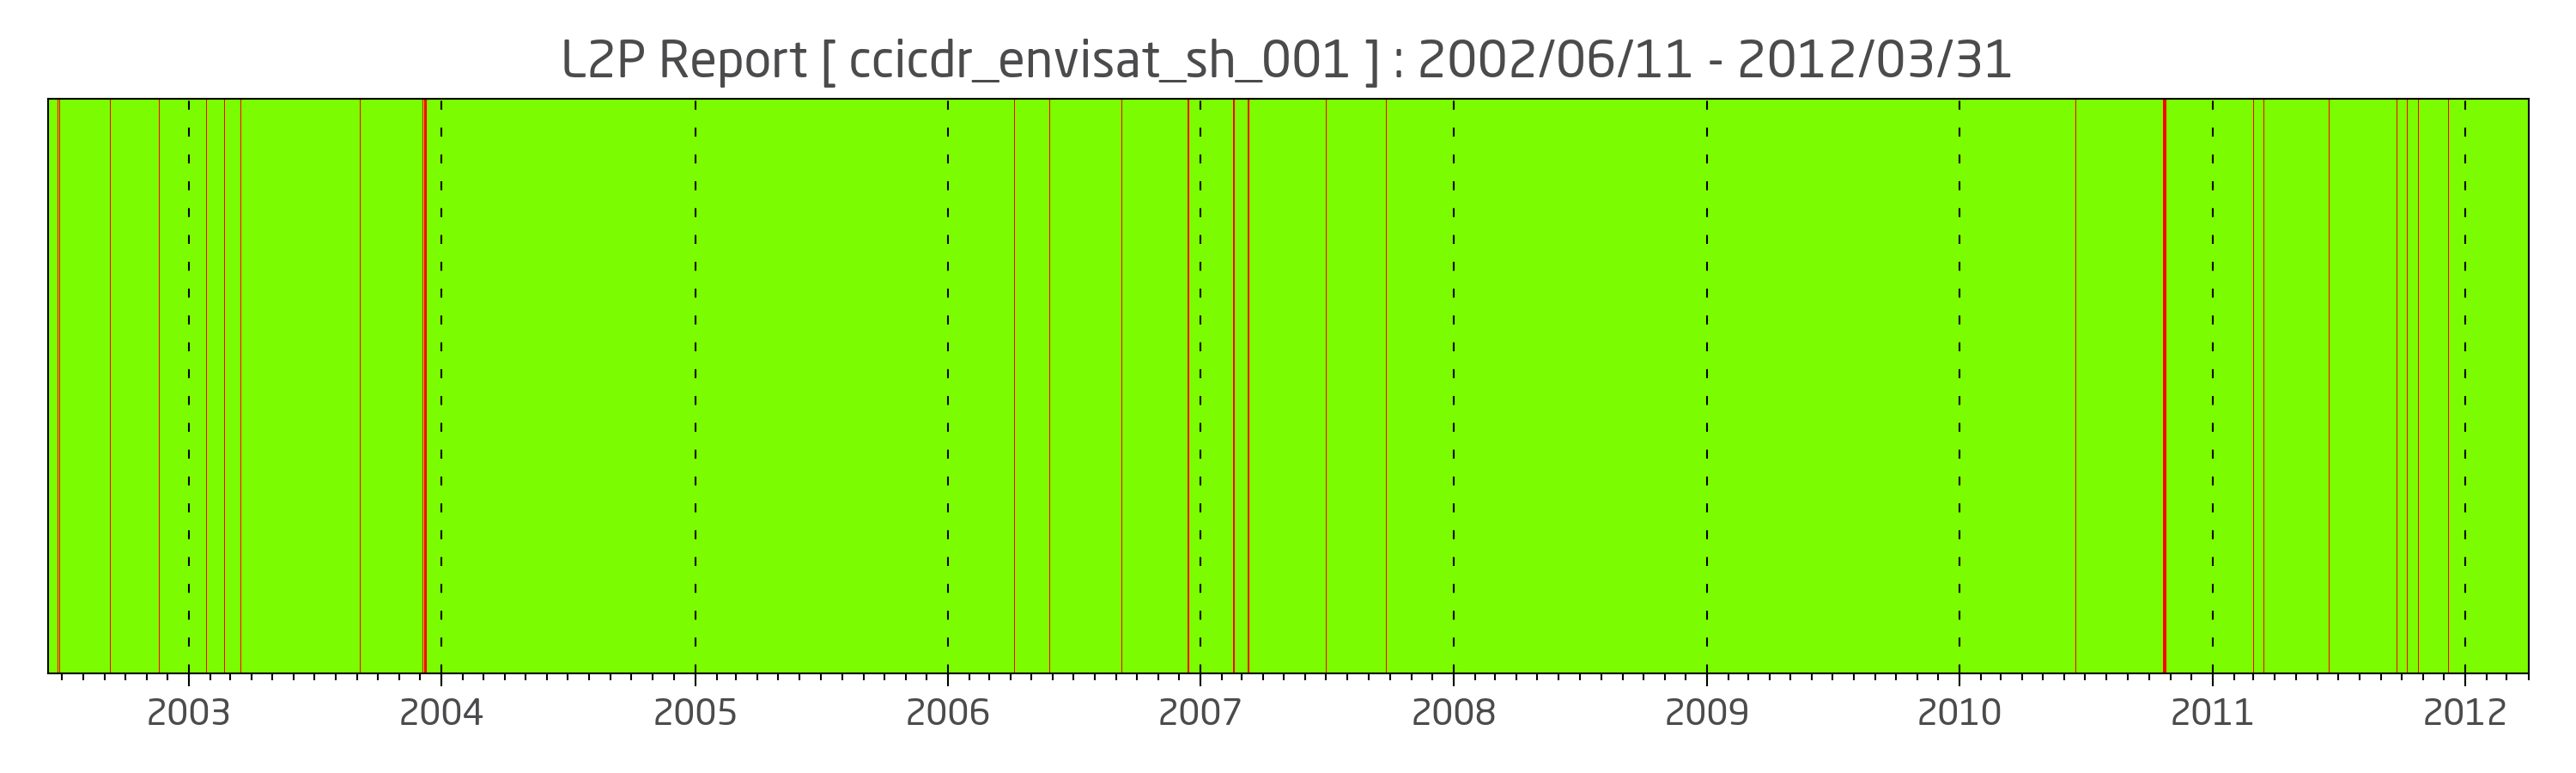
(Color coding: green: daily l2p available, red: daily l2p missing, light blue: Arctic summer gap)
One useful method to evaluate sea ice thickness information from remote sensing and numerical models is to compare monthly anomalies. This parameter is defined as the difference of one particular month to the mean monthly thickness fields of other month in the data record. Monthly anomalies are therefore sensitive to processes that cause sea ice thickness changes and can be compared to other sources which may have a systematic thickness bias to the reference thickness field.
One of these comparisons is regularly carried by the Polar Science Center (PSC) of the Applied Physics Laboratory at the University of Washington. The PSC operates the Pan-Arctic Ice Ocean Modeling and Assimilation System (PIOMAS) that provides near-real time updates of Arctic sea ice thickness and volume.
The following two figures show monthly thickness anomalies for PIOMAS and CryoSat-2 (cs2awi v2.0 NRT) for March 2018 with mean conditions from the time frame of the CryoSat-2 data record (2011-2017).
PIOMAS Scientific Reference:
Schweiger, A., R. Lindsay, J. Zhang, M. Steele, H. Stern, Uncertainty in modeled arctic sea ice volume, J. Geophys. Res., doi:10.1029/2011JC007084, 2011
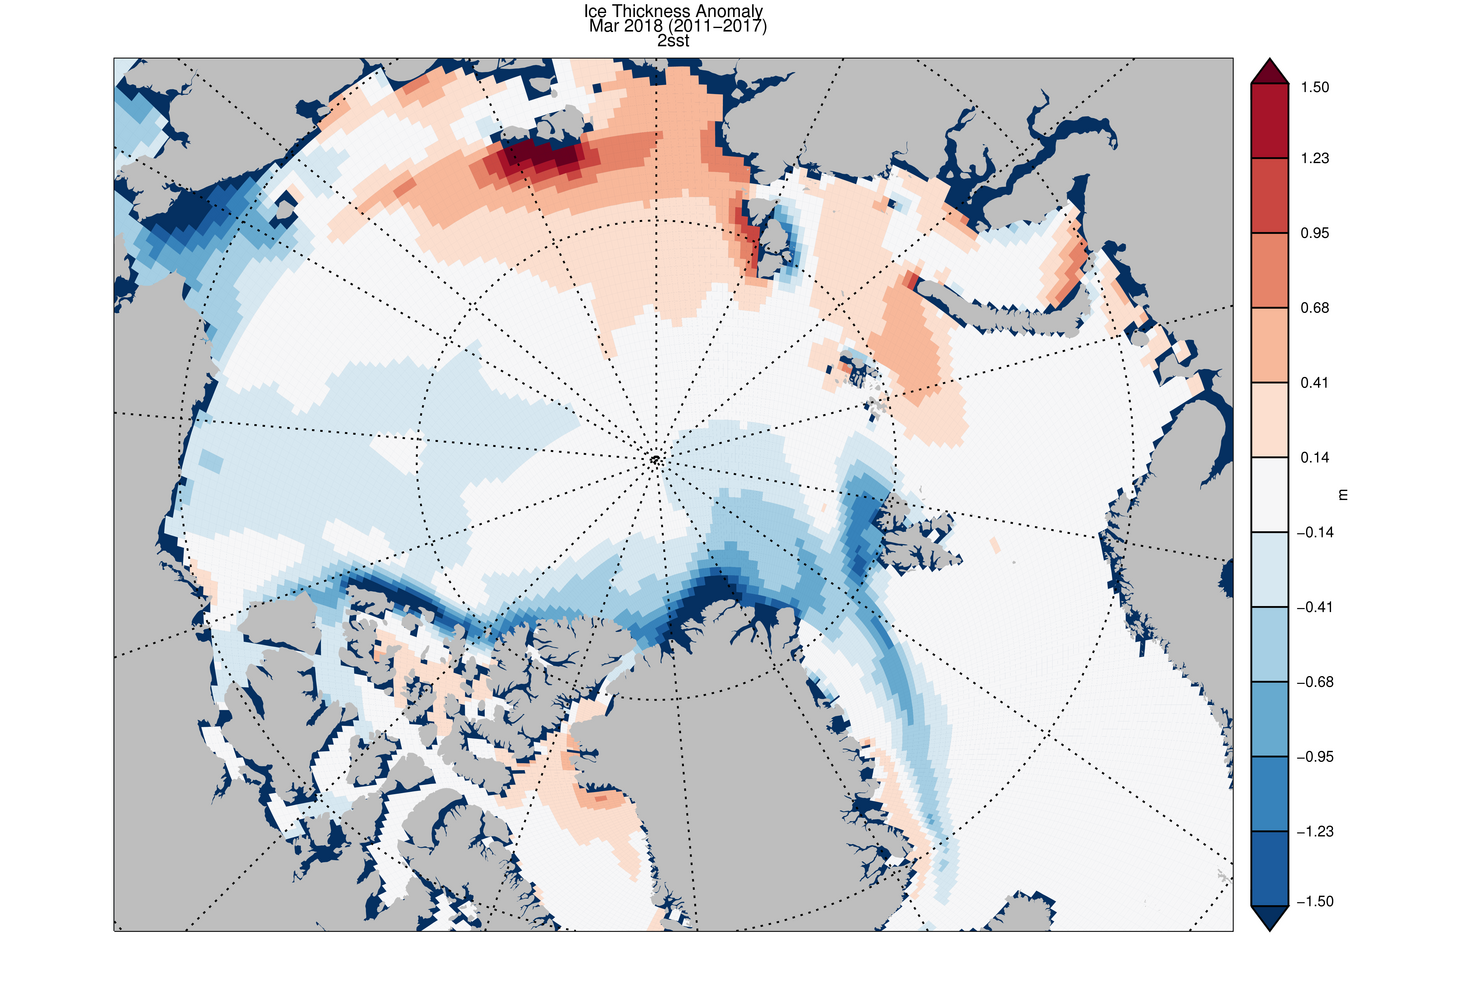
PIOMAS March 2018 sea ice thickness anomaly
(credit: Axel Schweiger, Polar Science Center, Source)
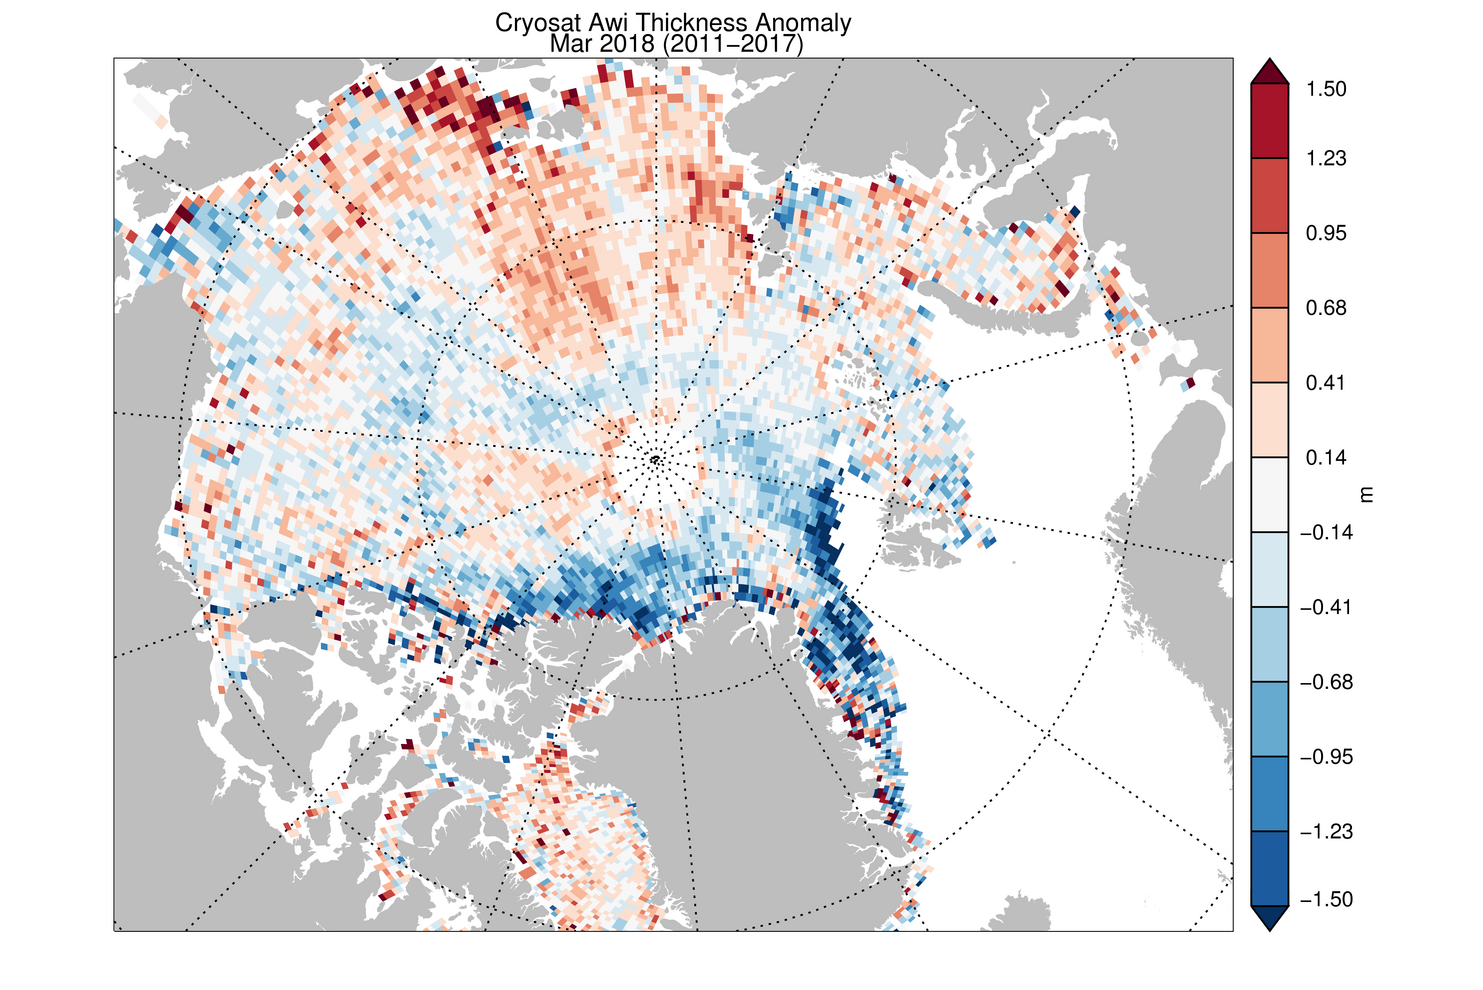
CryoSat-2 March 2018 sea ice thickness anomaly projected to PIOMAS grid
(credit: Axel Schweiger, Polar Science Center, Source)
The regional patterns in the March 2018 thickness anomalies are widely consistent with
- distinct positive thickness anomaly in the Russion Sector and Baffin Bay
- distinct negative thickness anomaly north of Greenland and the Canadian Archipelago as well as Fram Strait
The agreement is less close to the north pole where CryoSat-2 indicates a minor positive thickness anomaly that is not visible in the PIOMAS data. The previous CryoSat-2 monthly anomalies (below) of the winter season of 2017/18 indicate that this particular positive anomaly persisted and has been more pronounced in the previous month. However, a detailed drift analysis is necessary to track the sea ice region to origin in the previous year for a more detailed analysis.
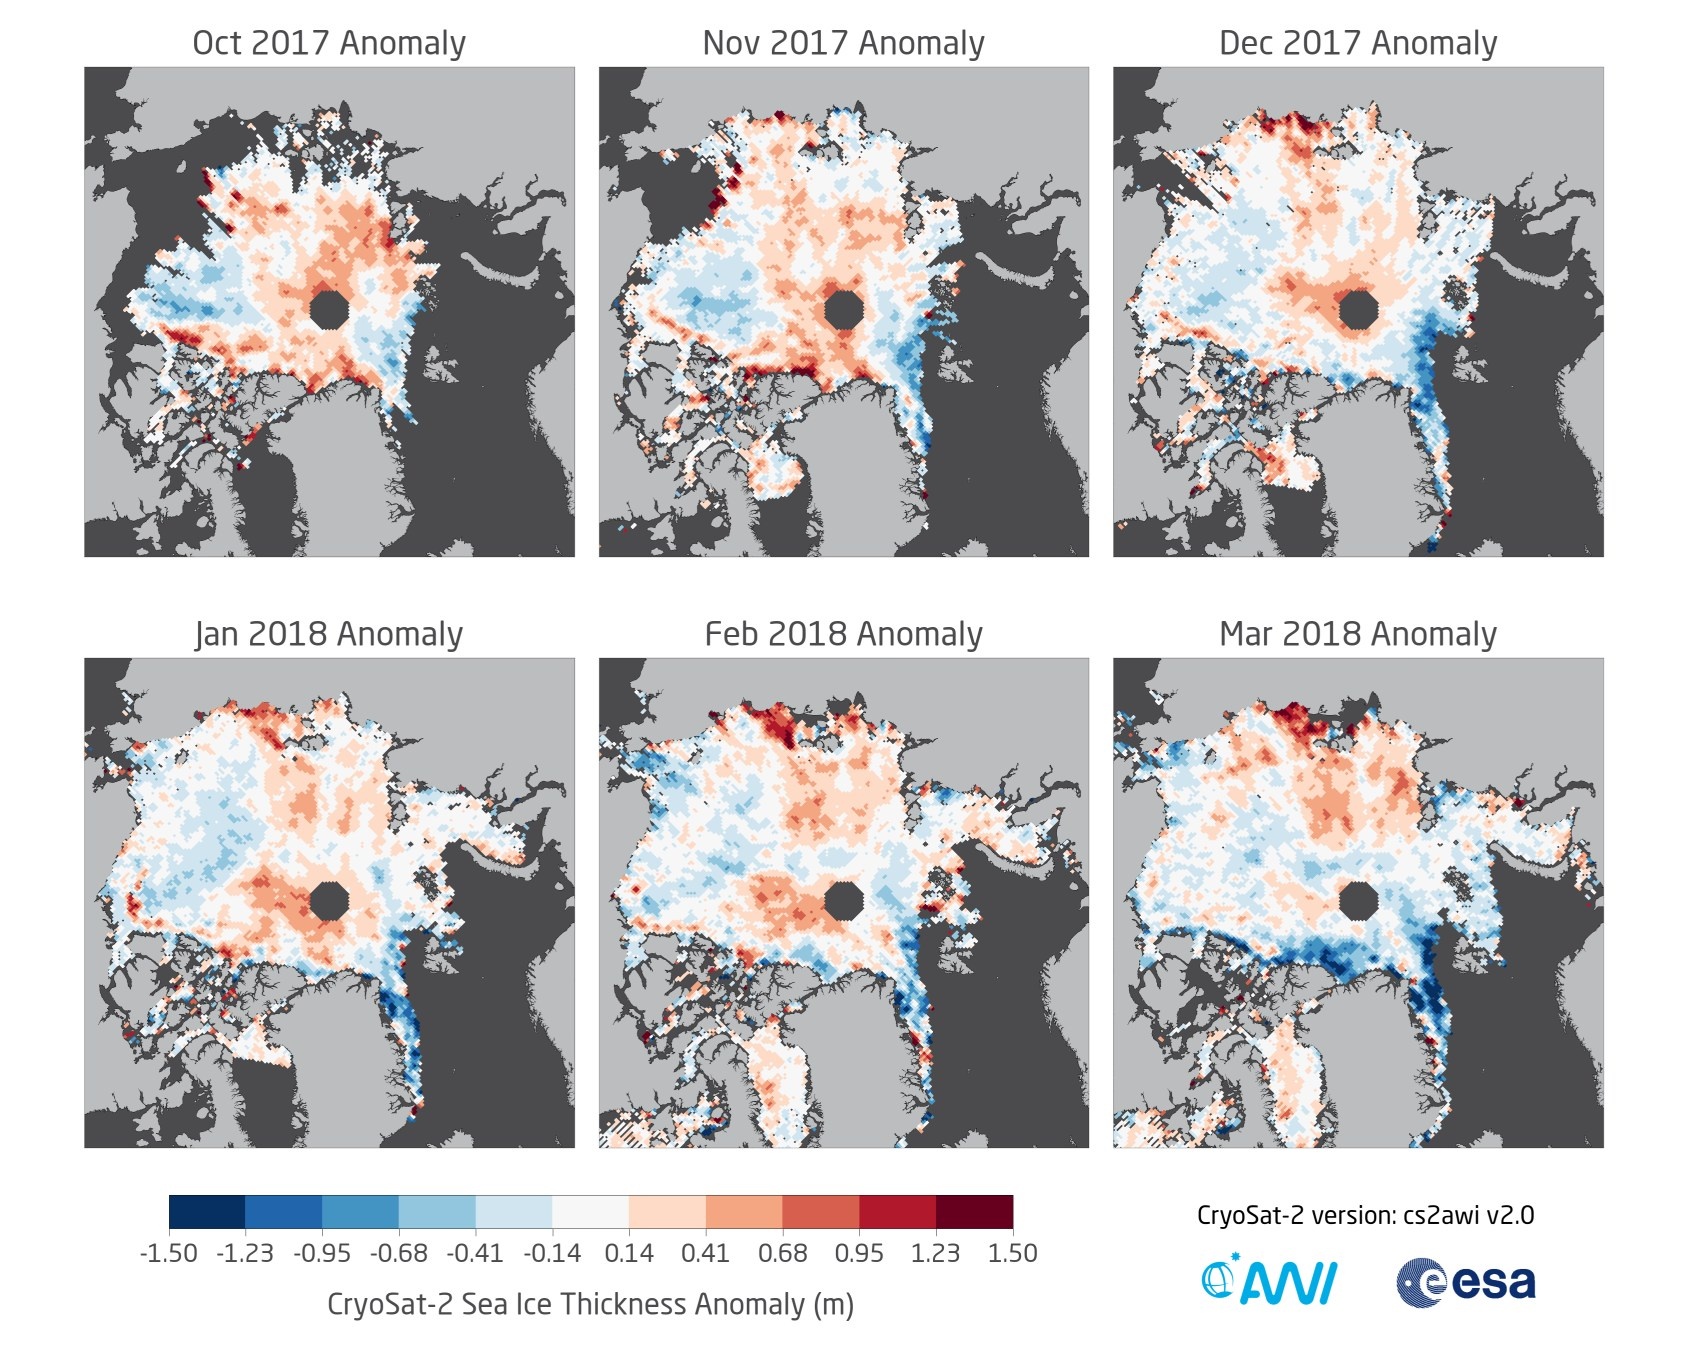
Monthly CryoSat-2 thickness anomalies for winter season 2017/2018 (March 2018: NRT data)
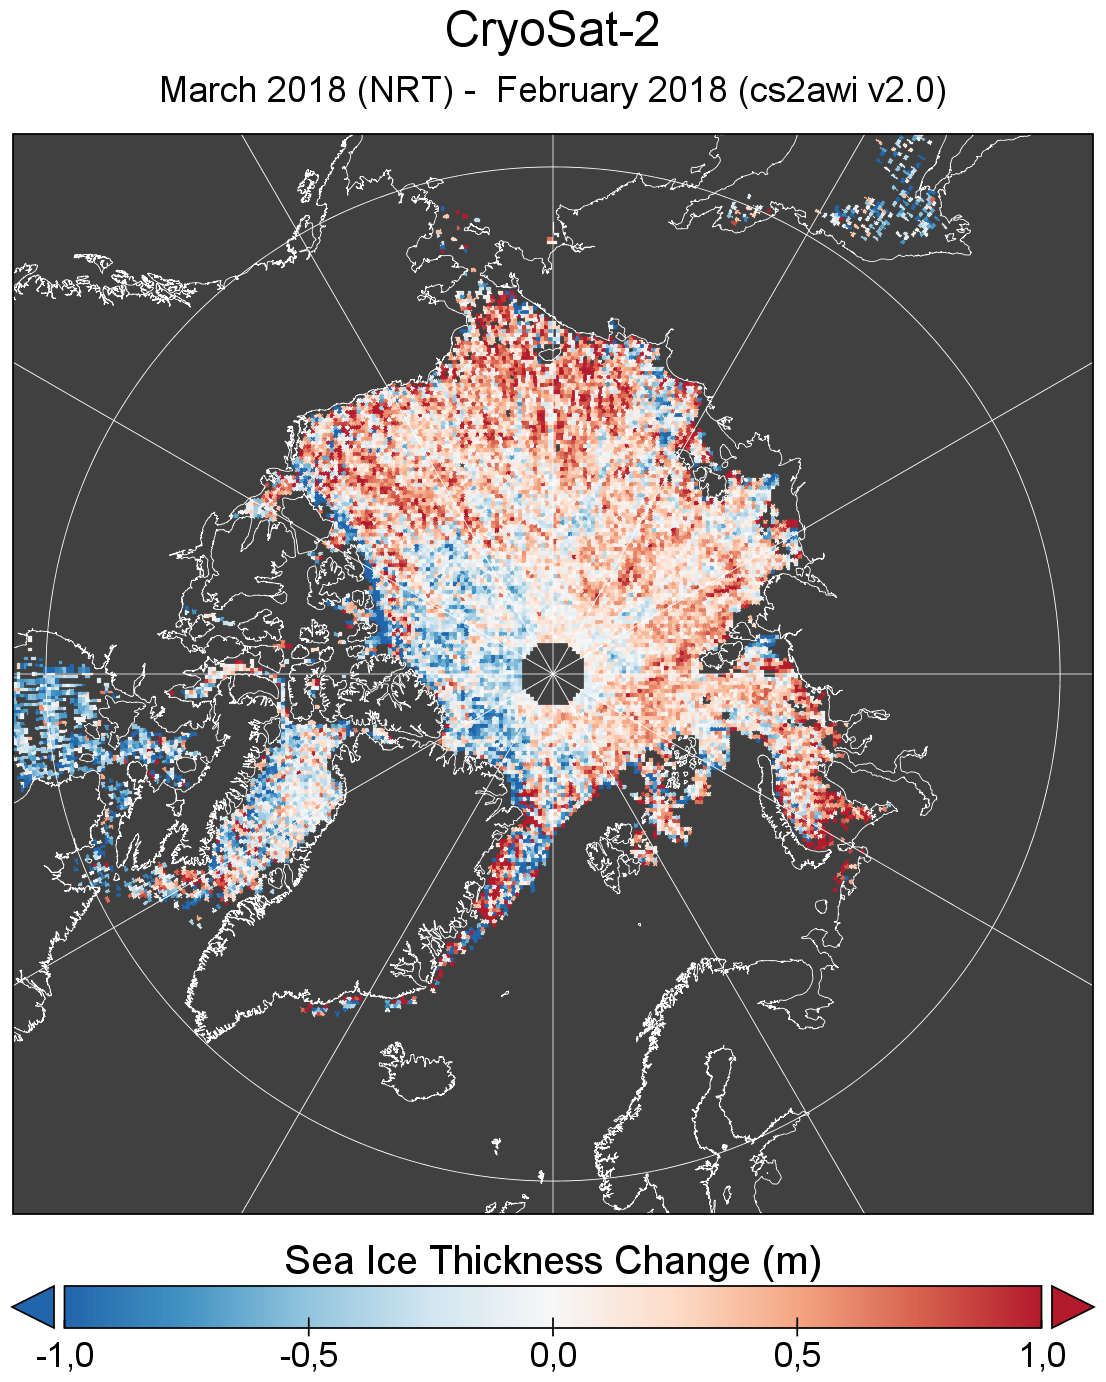
Arctic sea ice thickness information has been updated with NRT data for March 2018 and reprocessed data for February 2018. Daily, weekly and monthly products are available here: Reprocessed, Near-real time
Short Facts
- March sea ice volume in the central Arctic was 4th lowest / 4th highest in 8 years of CryoSat-2 observations: 12.67 • 103 km3
- highest: 14.08 • 103 km3 in Mar 2014
- lowest: 11.44 • 103 km3 in Mar 2013
- average: 12.70 • 103 km3
- March mean sea ice thickness in the central Arctic was 4th lowest / 4th highest in 8 years of CryoSat-2 observations: 2.04 m
- highest: 2.29 m in Mar 2014
- lowest: 1.89 m in Mar 2013
- average: 2.04 m
- Monthly sea ice volume gain (February through March) was 3rd lowest / 6th highest in 8 years of CryoSat-2 observations: +1.38 • 103 km3
- highest: +2.27 • 103 km3 in March 2013 (potential retrieval anomaly, under investigation)
- lowest: +0.91 • 103 km3 in Mar 2012
- average: +1.38 • 103 km3
- Cummulative sea ice volume gain (October through February) was lowest in 8 years of CryoSat-2 observations: +6.52 • 103 km3
- highest: +7.38 • 103 km3 in Mar 2017
- average: +6.98 • 103 km3
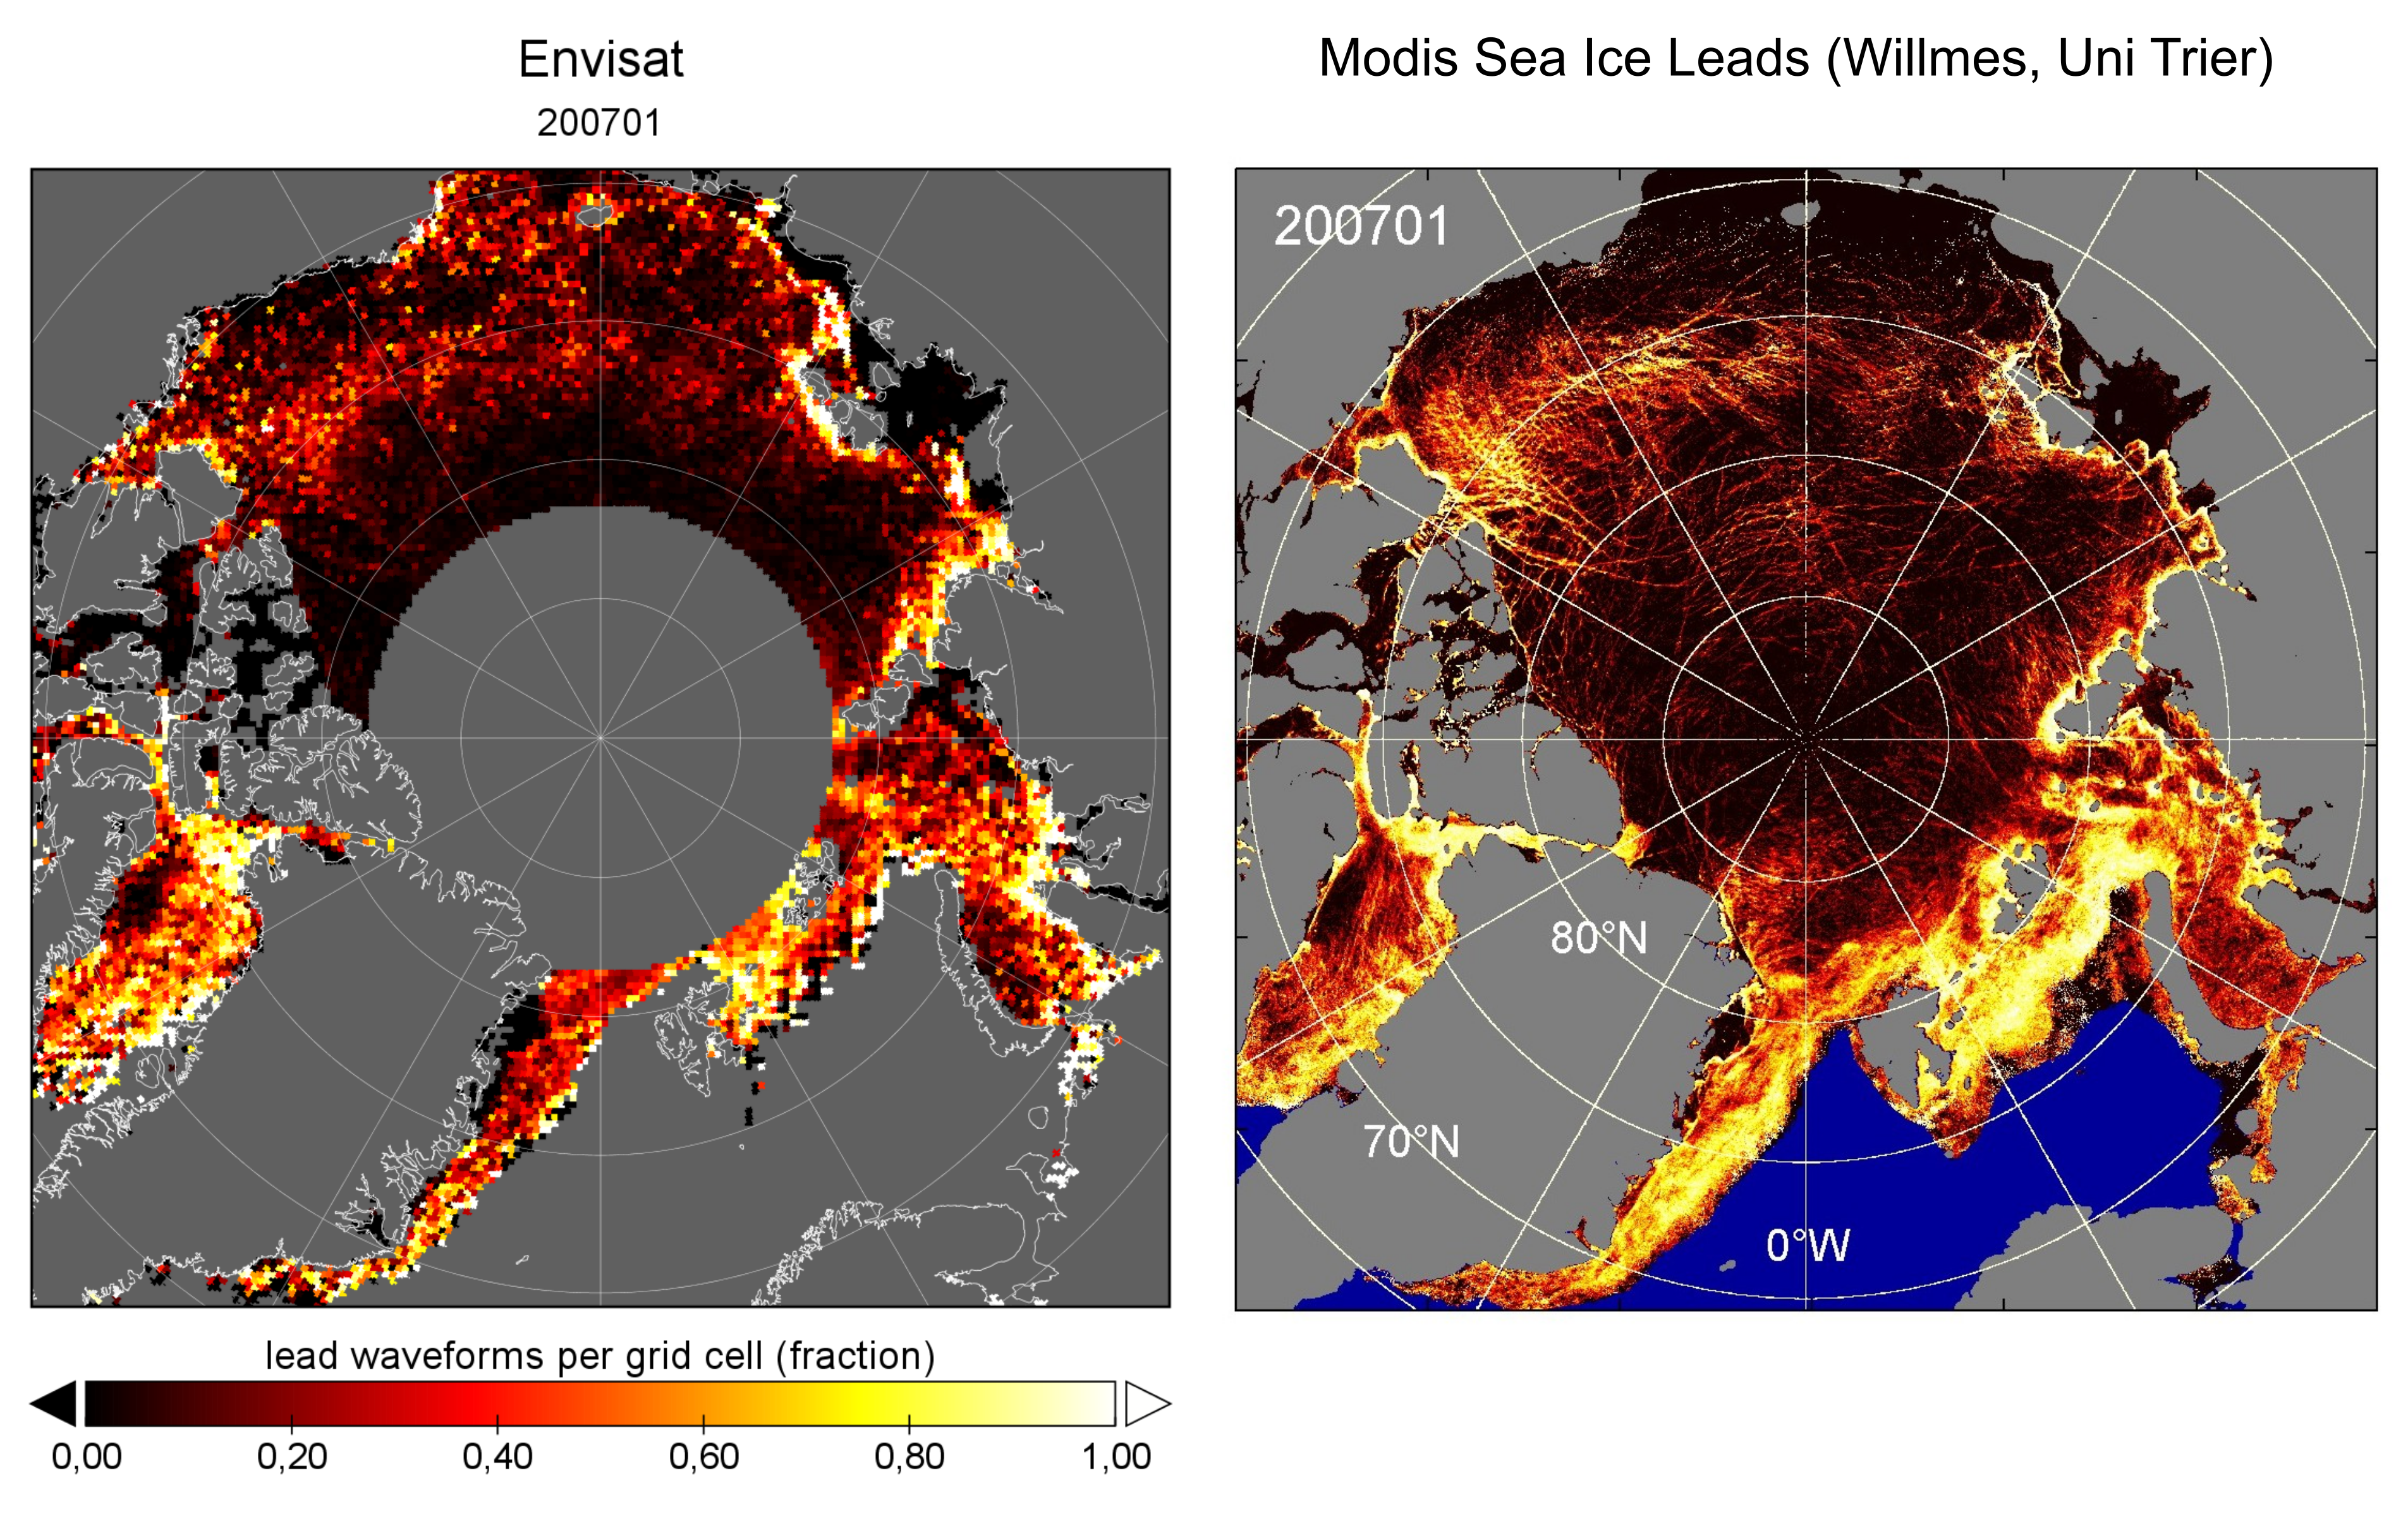
The detection of leads to estimate local sea surface height is one crucial step for remote sensing of sea ice thickness with radar altimetry. Algorithms that classify individual radar echoes into the category sea ice, lead, or mixed must return reliable results in all sea ice conditions. To verify the surface type classification algorithms, we use other observational sources as the Sea-ice lead detection in the Arctic from MODIS satellite imagery, 2013-2016 from the Univsersity of Trier.
Below one example of sea ice lead density in the Arctic from Envisat altimetry (left) and Modis (right) indicating a good regional agreement of lead detection with the two independent methods.
Arctic sea ice thickness information has been updated with NRT data for February 2018 and reprocessed data for January 2018. Daily, weekly and monthly products are available here: Reprocessed, Near-real time
")
Short Facts
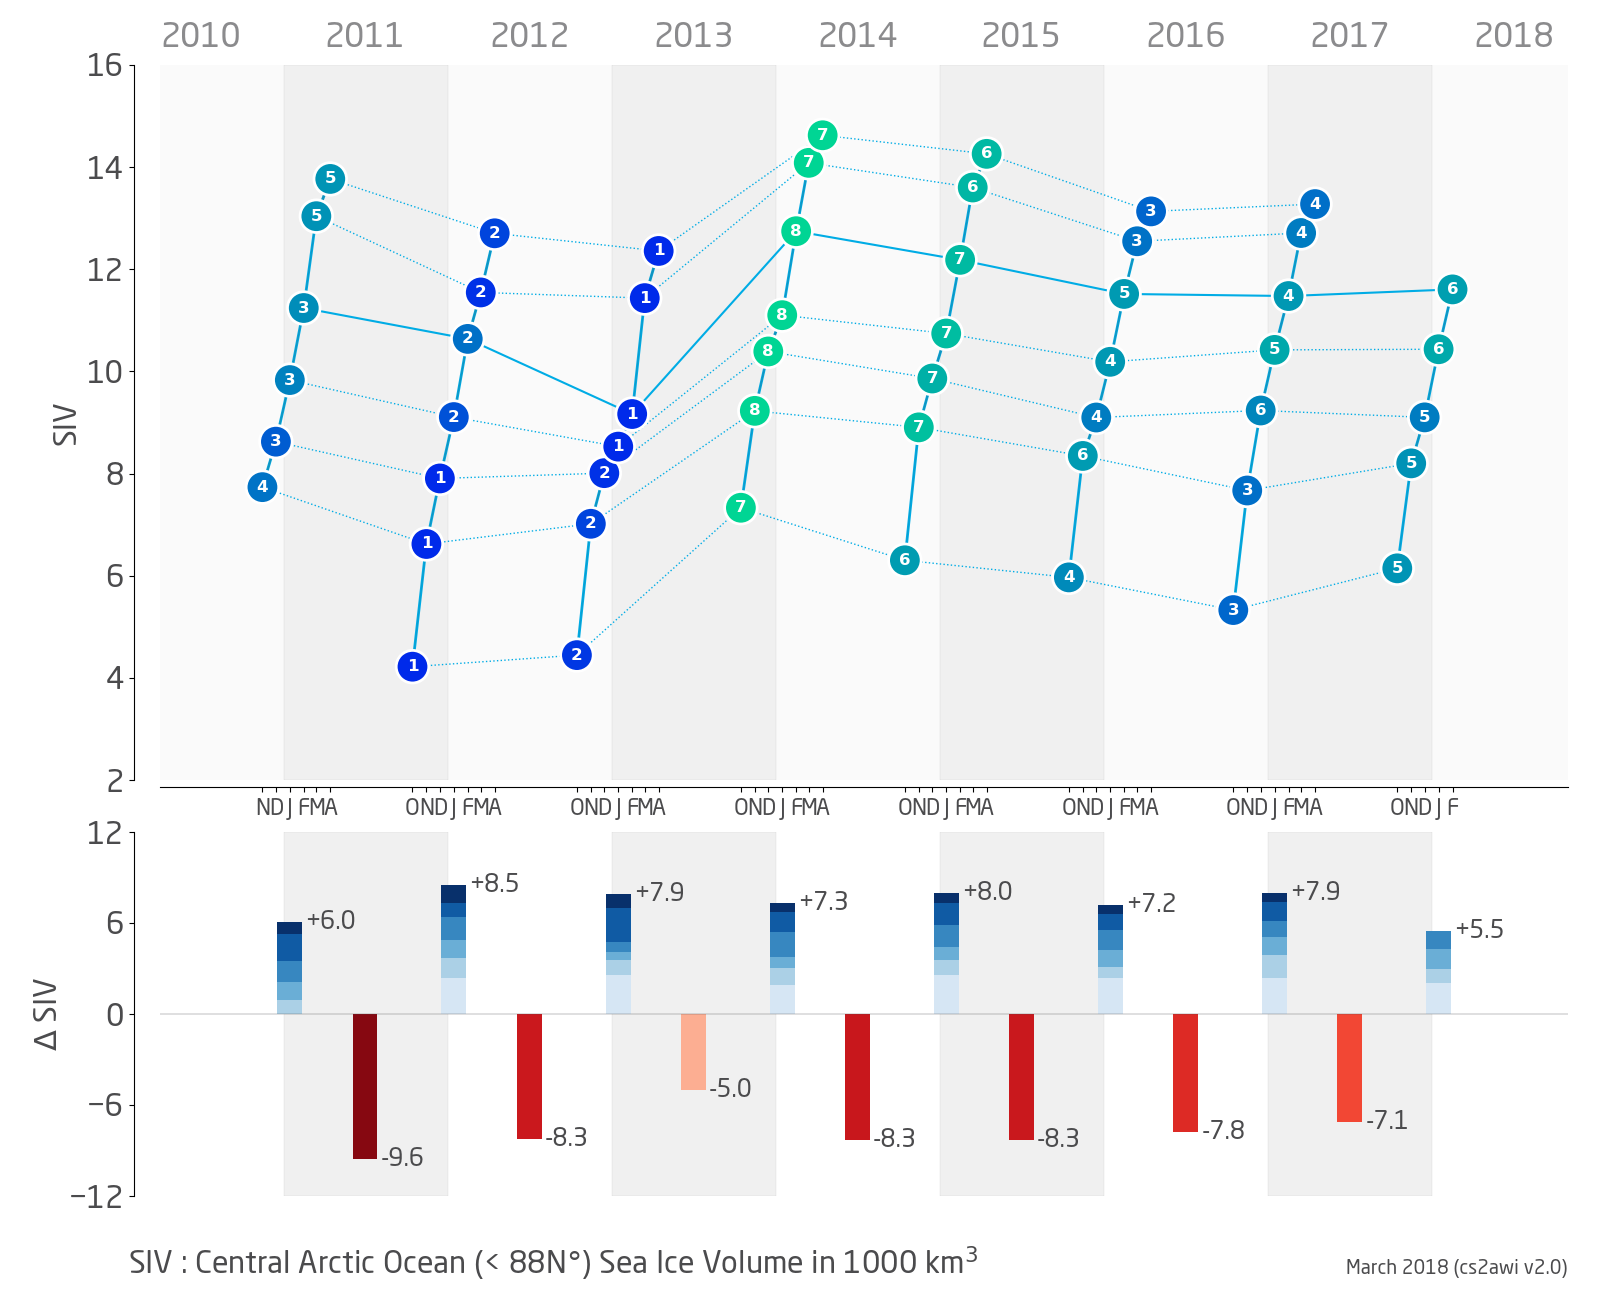
- February sea ice volume in the central Arctic was 6th lowest / 3rd highest in 8 years of CryoSat-2 observations: 11.61 • 103 km3
- highest: 12.75 • 103 km3 in Feb 2014
- lowest: 9.17 • 103 km3 in Feb 2013
- average: 11.32 • 103 km3
- February mean sea ice thickness in the central Arctic was 6th lowest / 3rd highest in 8 years of CryoSat-2 observations: 1.89 m
- highest: 2.07 m in Feb 2014
- lowest: 1.51 m in Feb 2013 (potential retrieval anomaly, under investigation)
- average: 1.85 m
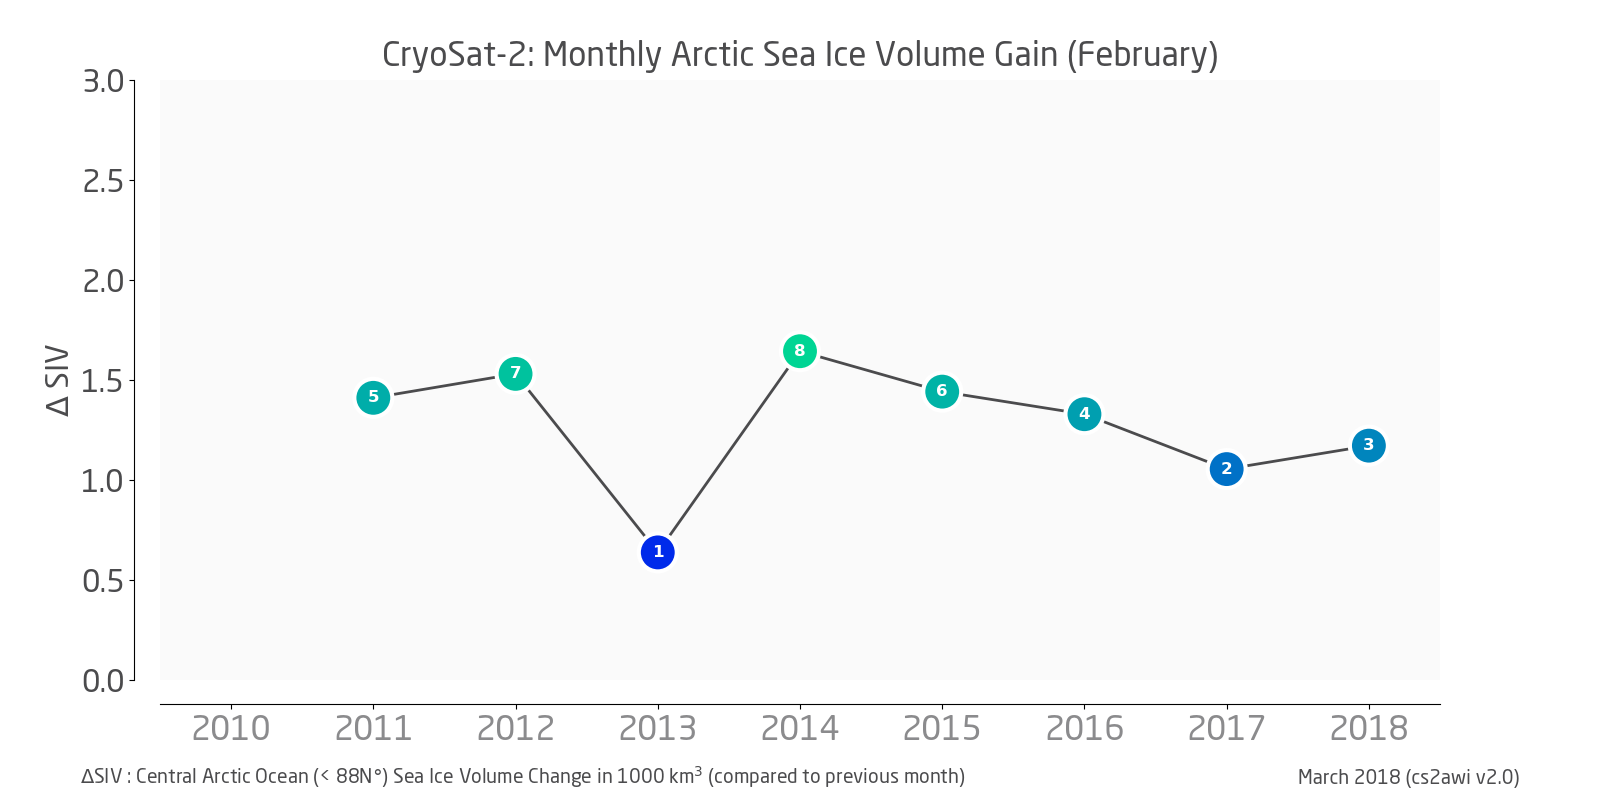
- Monthly sea ice volume gain (January through February) was 3rd lowest / 6th highest in 8 years of CryoSat-2 observations: +1.17 • 103 km3
- highest: +1.64 • 103 km3 in Feb 2014 (potential retrieval anomaly, under investigation)
- lowest: +0.64 • 103 km3 in Feb 2013 (potential retrieval anomaly, under investigation)
- average: +1.28 • 103 km3
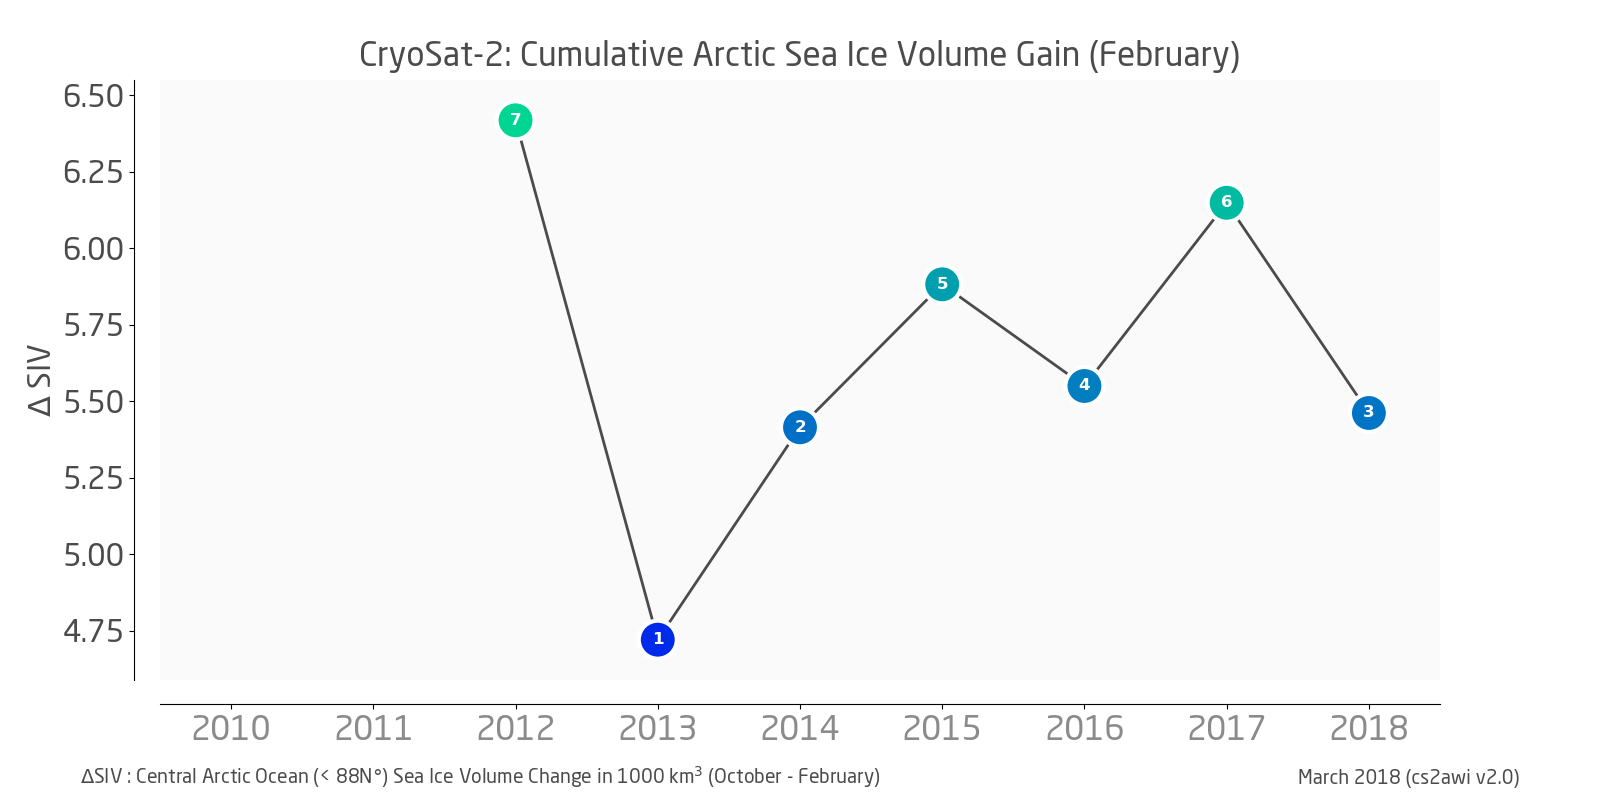
- Cummulative sea ice volume gain (October through February) was 3rd lowest / 6th highest in 8 years of CryoSat-2 observations: +5.46 • 103 km3
- highest: +6.42 • 103 km3 in Feb 2012
- lowest: +4.72 • 103 km3 in Fev 2013 (potential retrieval anomaly, under investigation)
- average: +5.66 • 103 km3
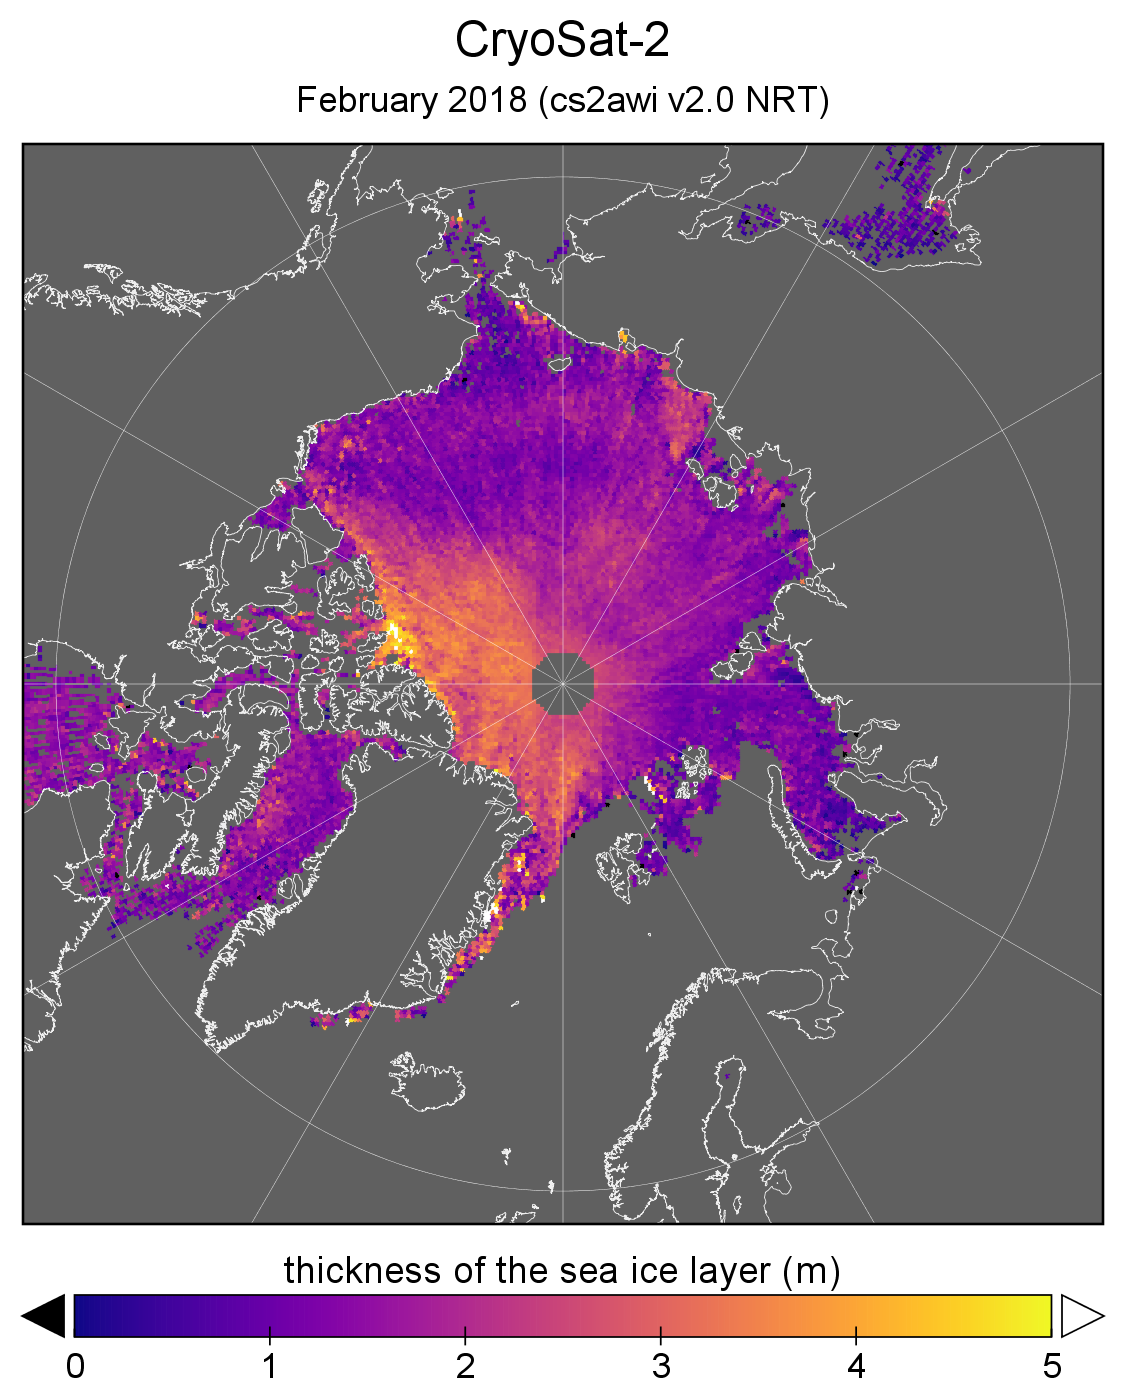
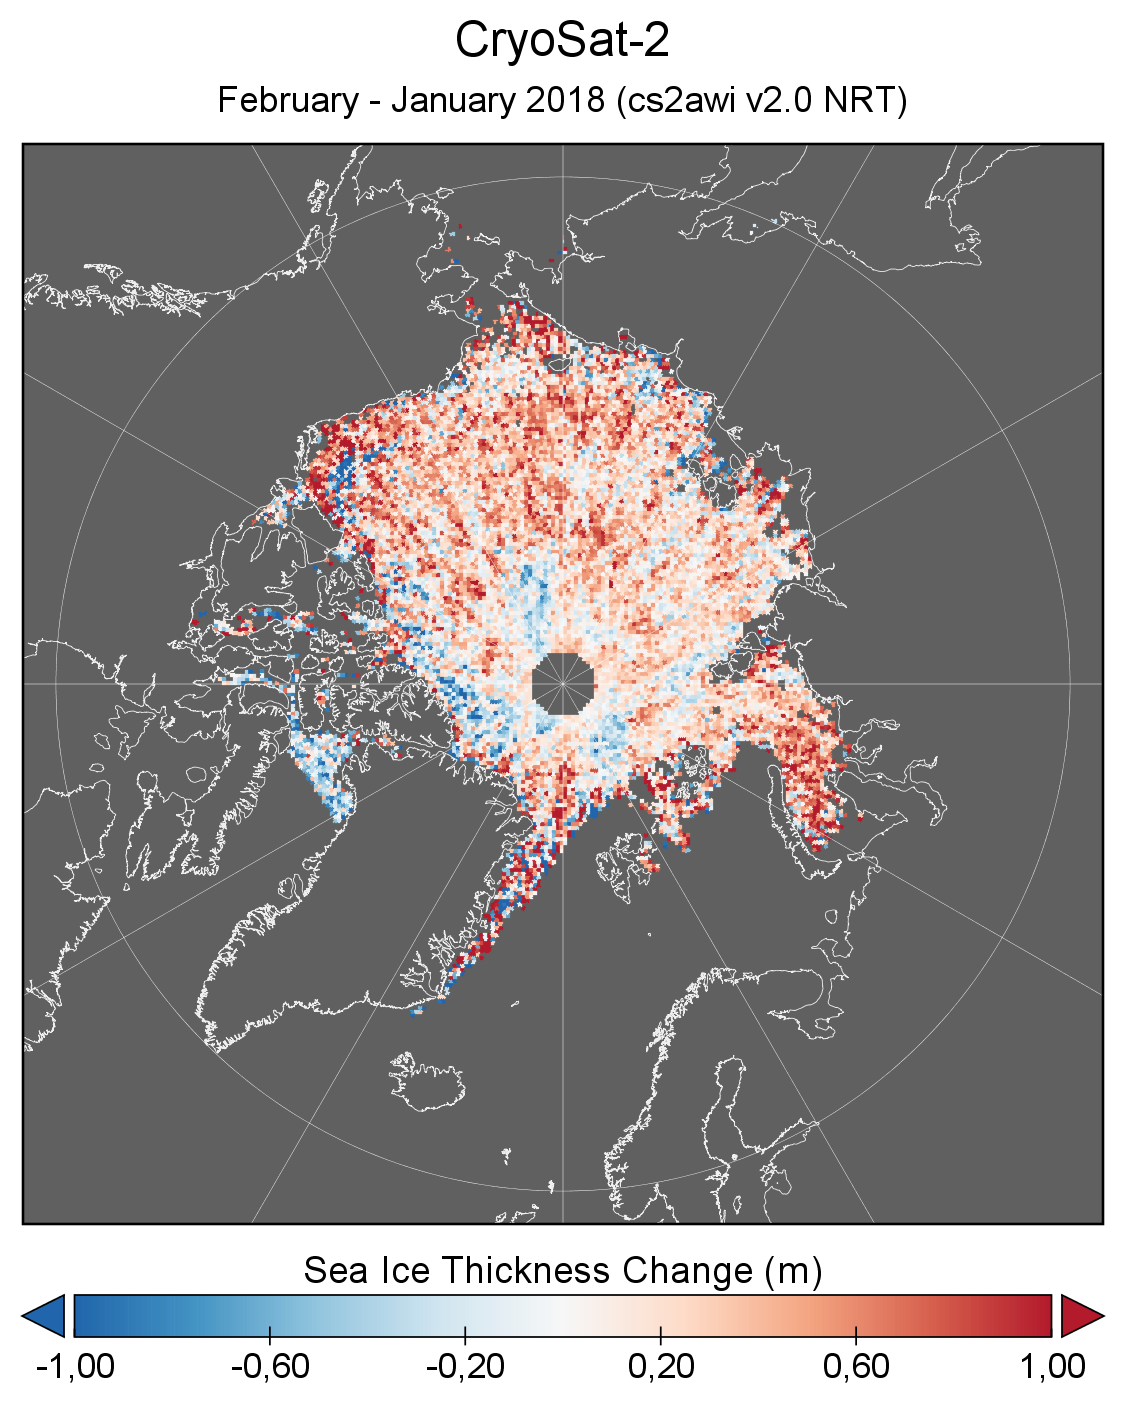
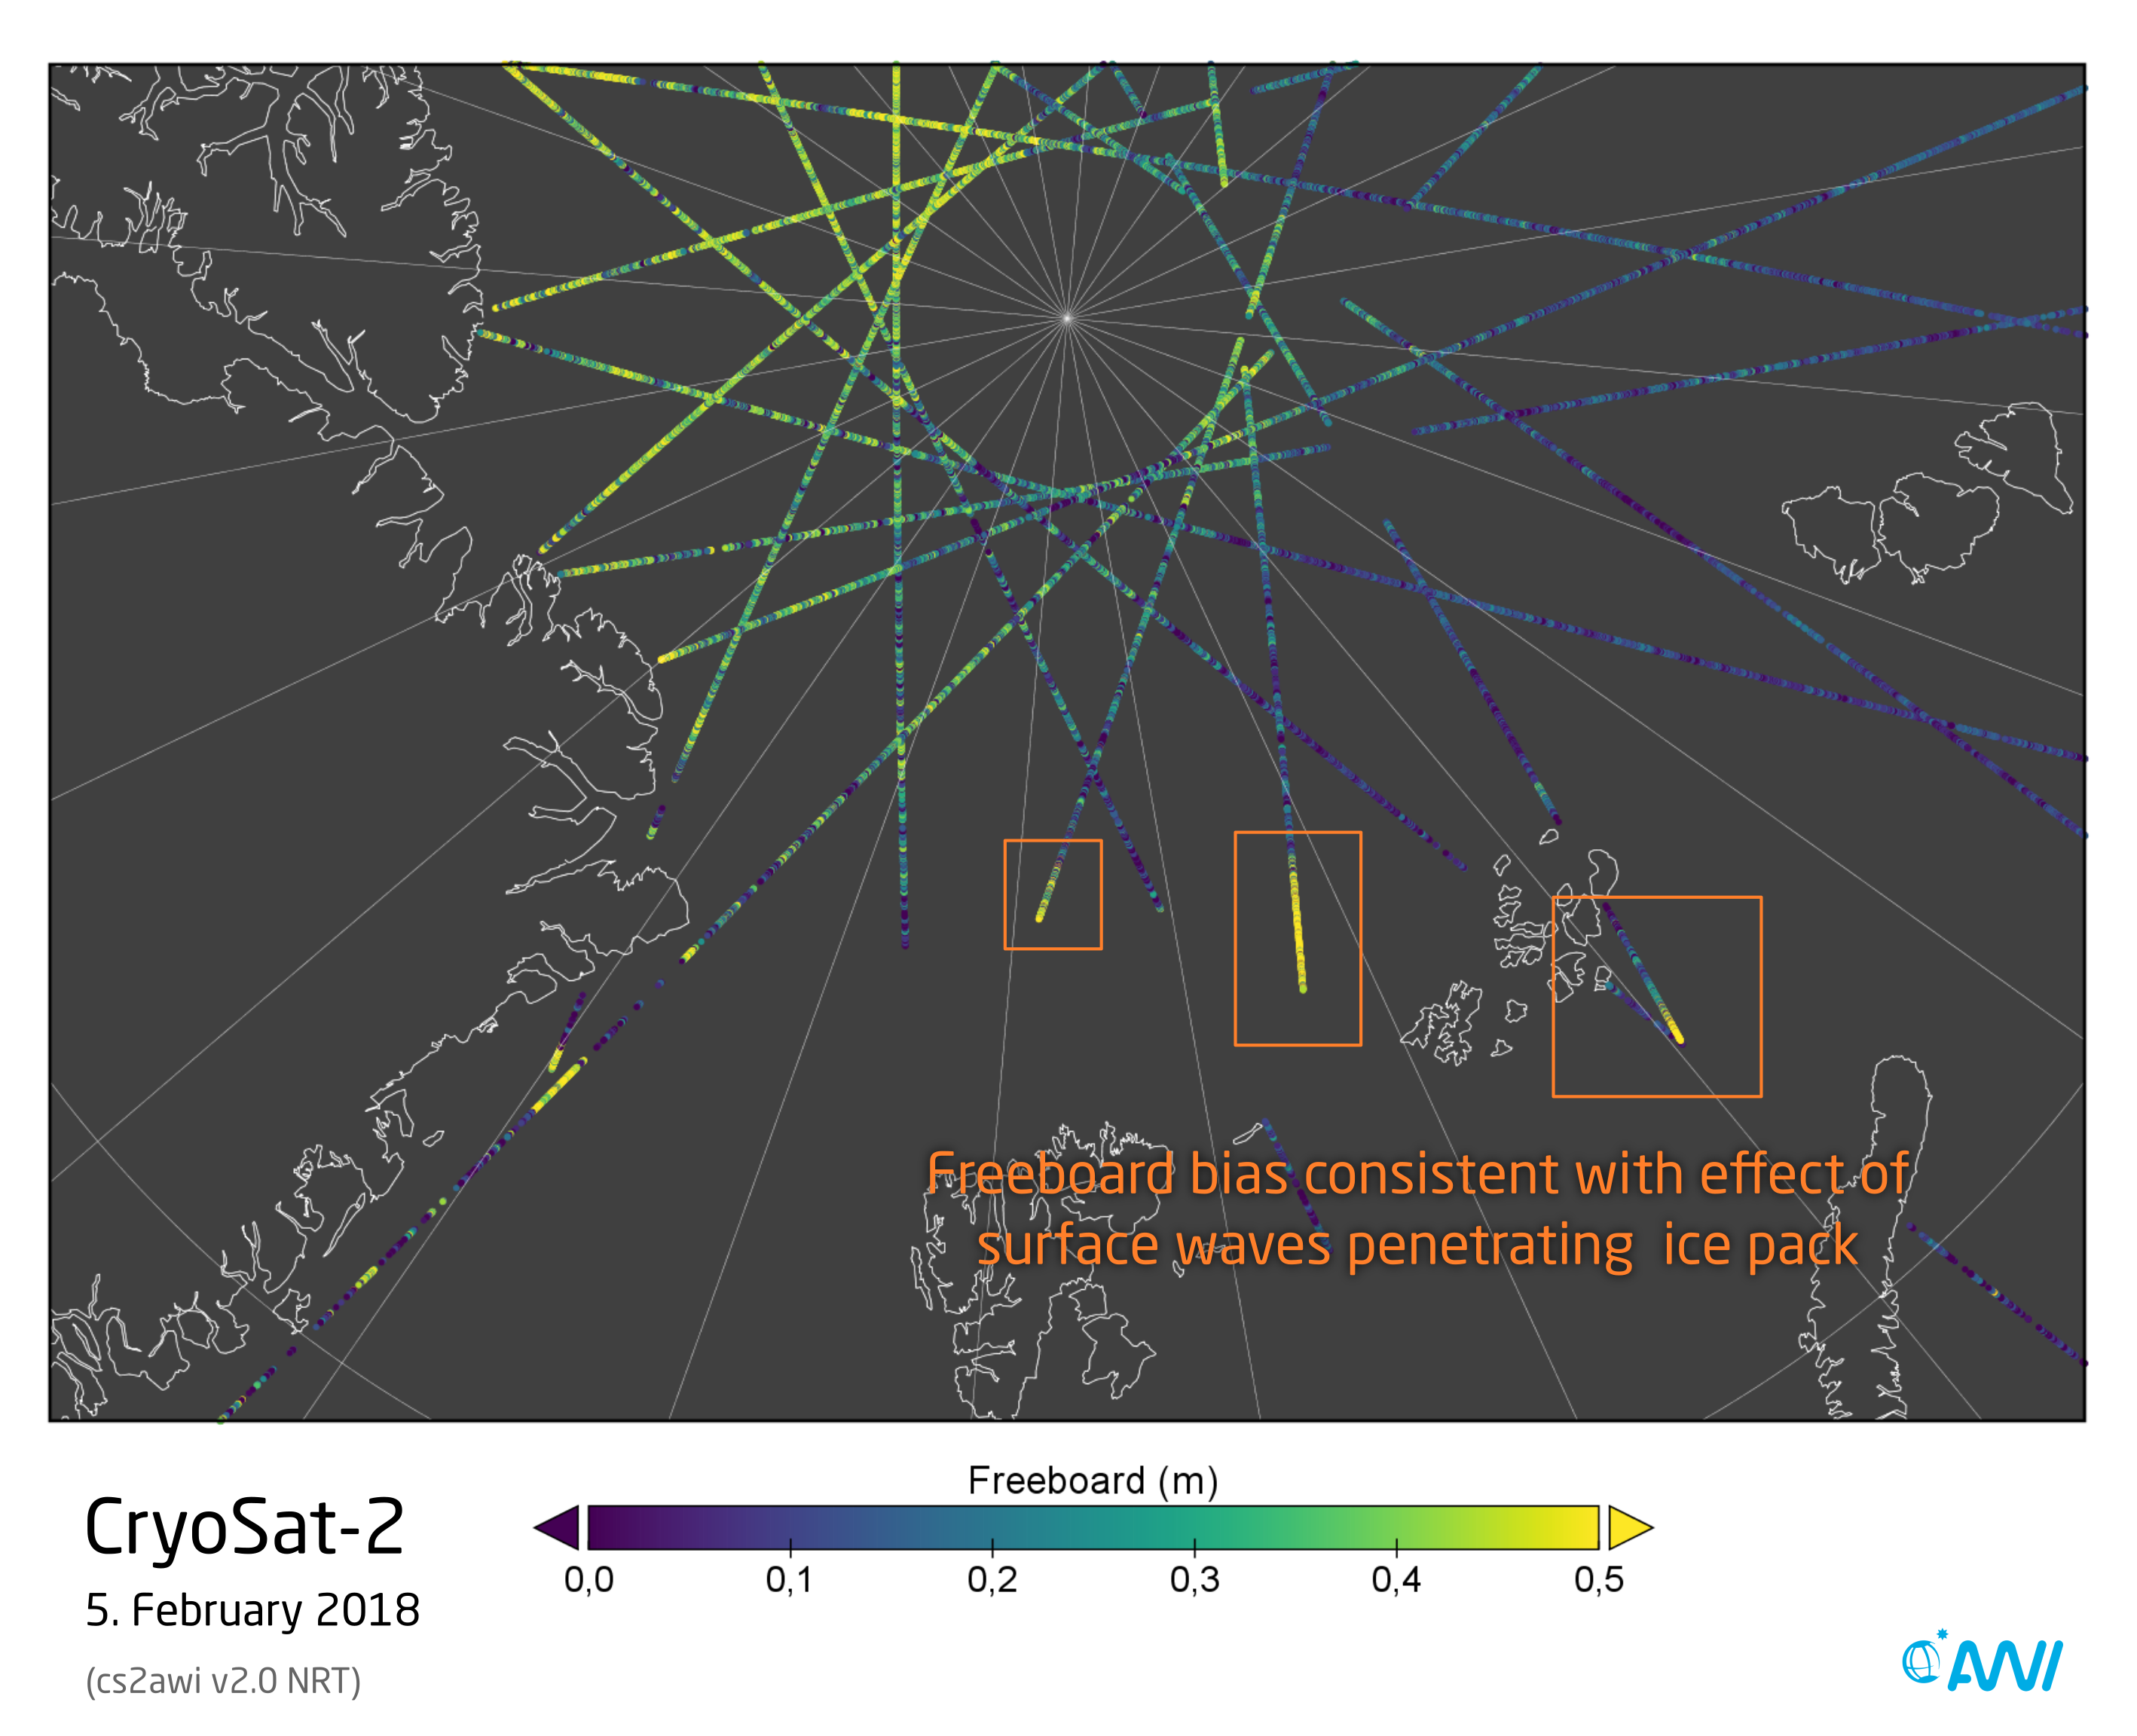
A major low pressure system passed through the Barents Sea on February 5, 2018 transporting significant amount of warm air masses to the central Arctic (overview e.g. Arctic News, Arctic Sea Ice Blog). It also generated high surface waves in the sea-ice free area north of Spitsbergen. The retrieved freeboard in CryoSat-2 NRT product shows how far these waves penetrated into the sea ice since the presence of surface waves causes the freeboard to be biased high (see map below). While this is an unwanted effect and a shortcoming of the algorithm, it can be used to study surface wave penetration into the marginal ice zone.
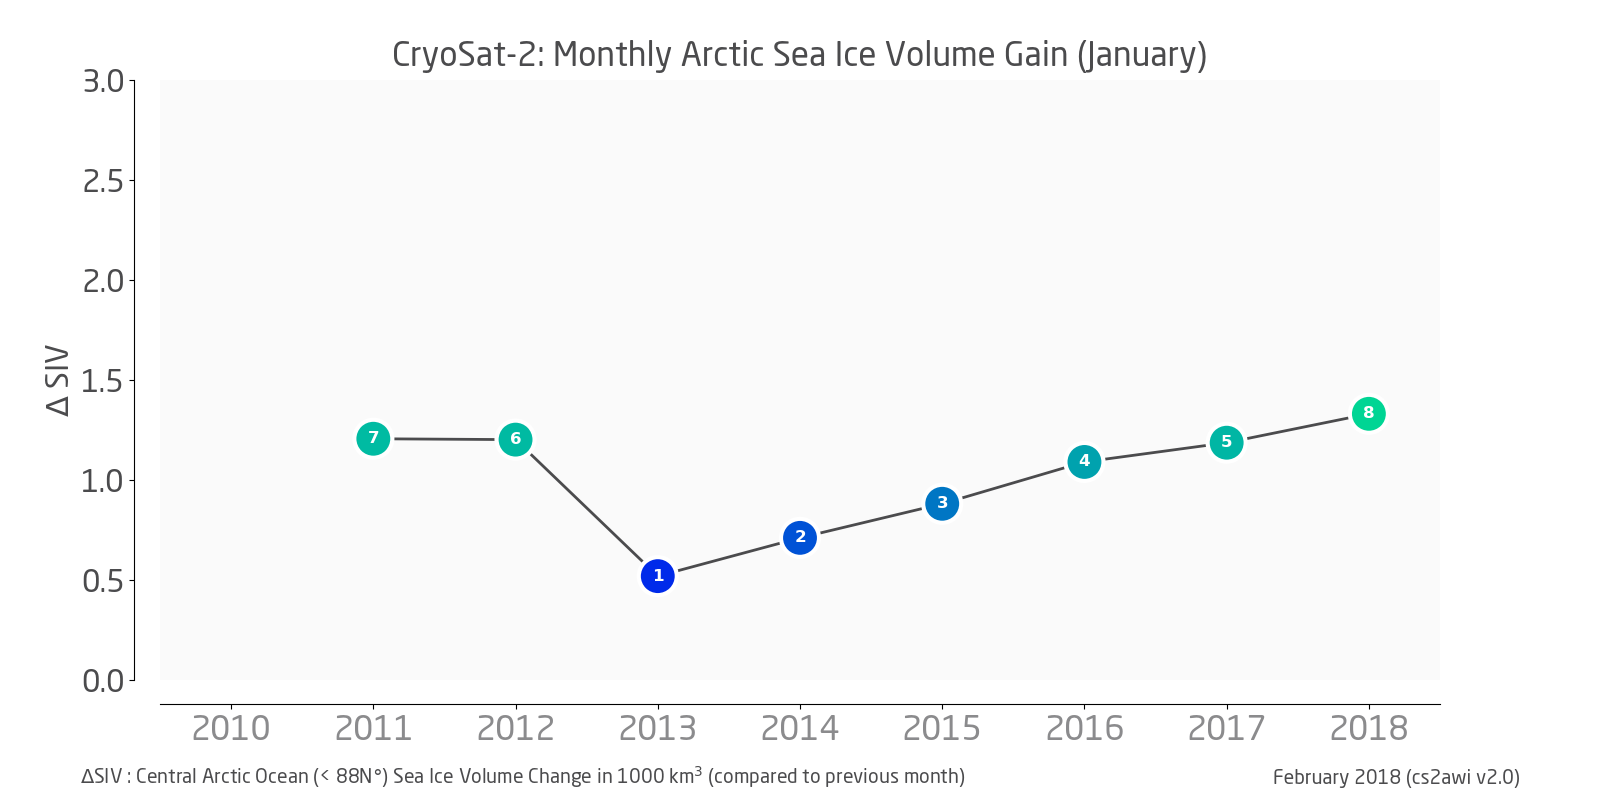
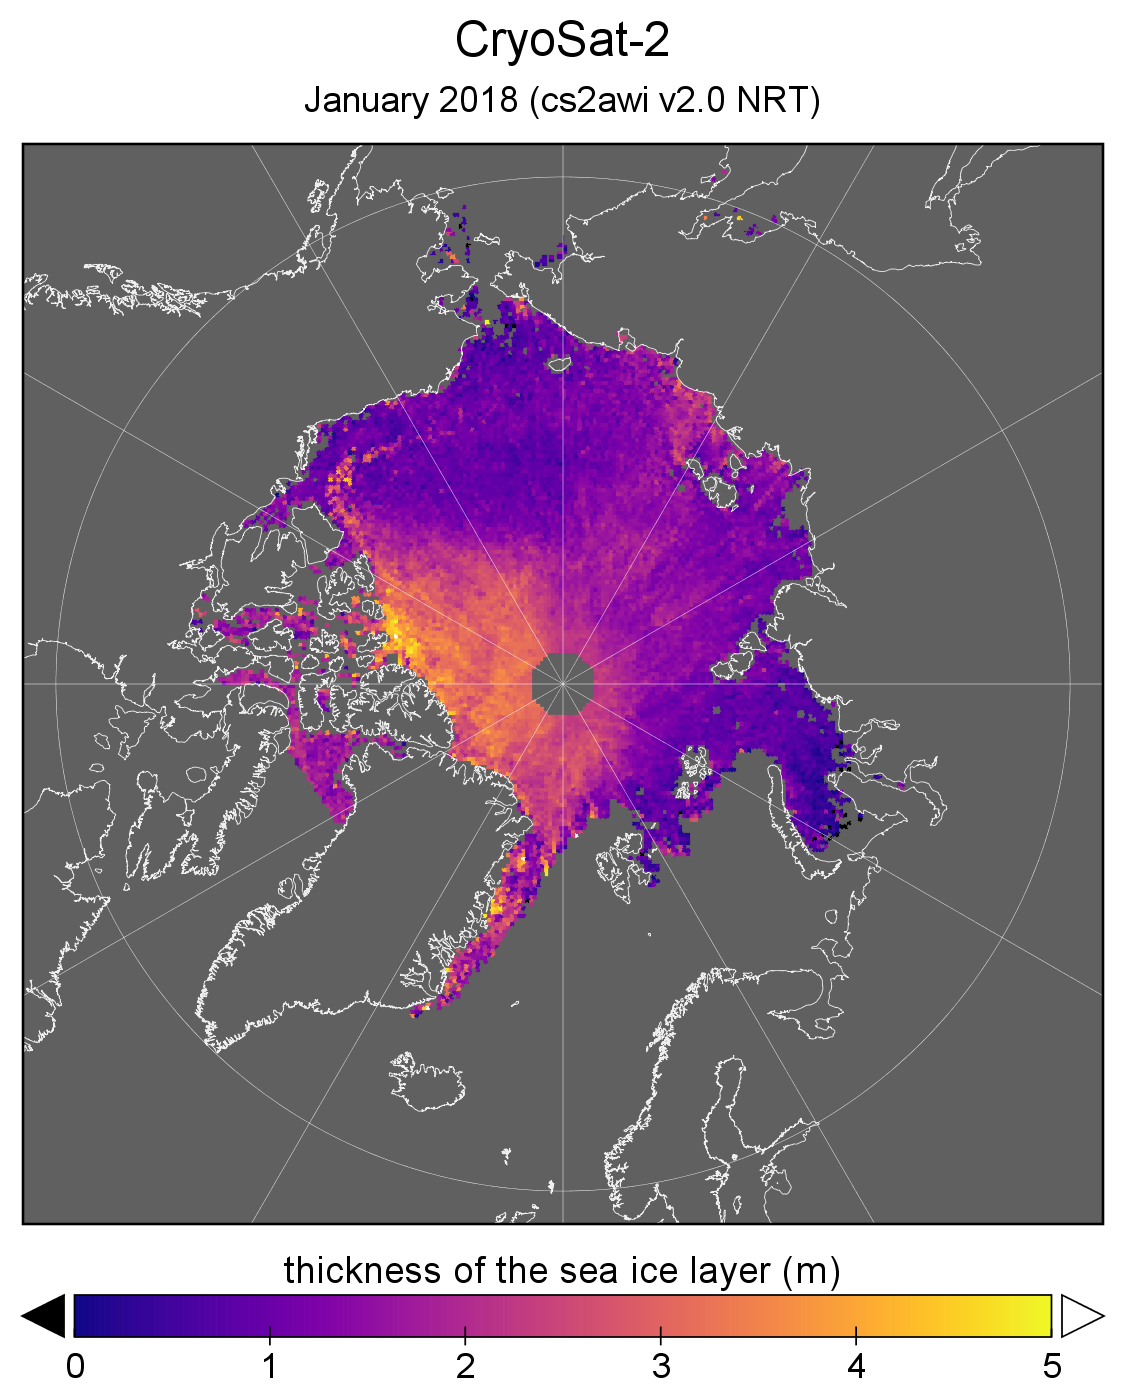
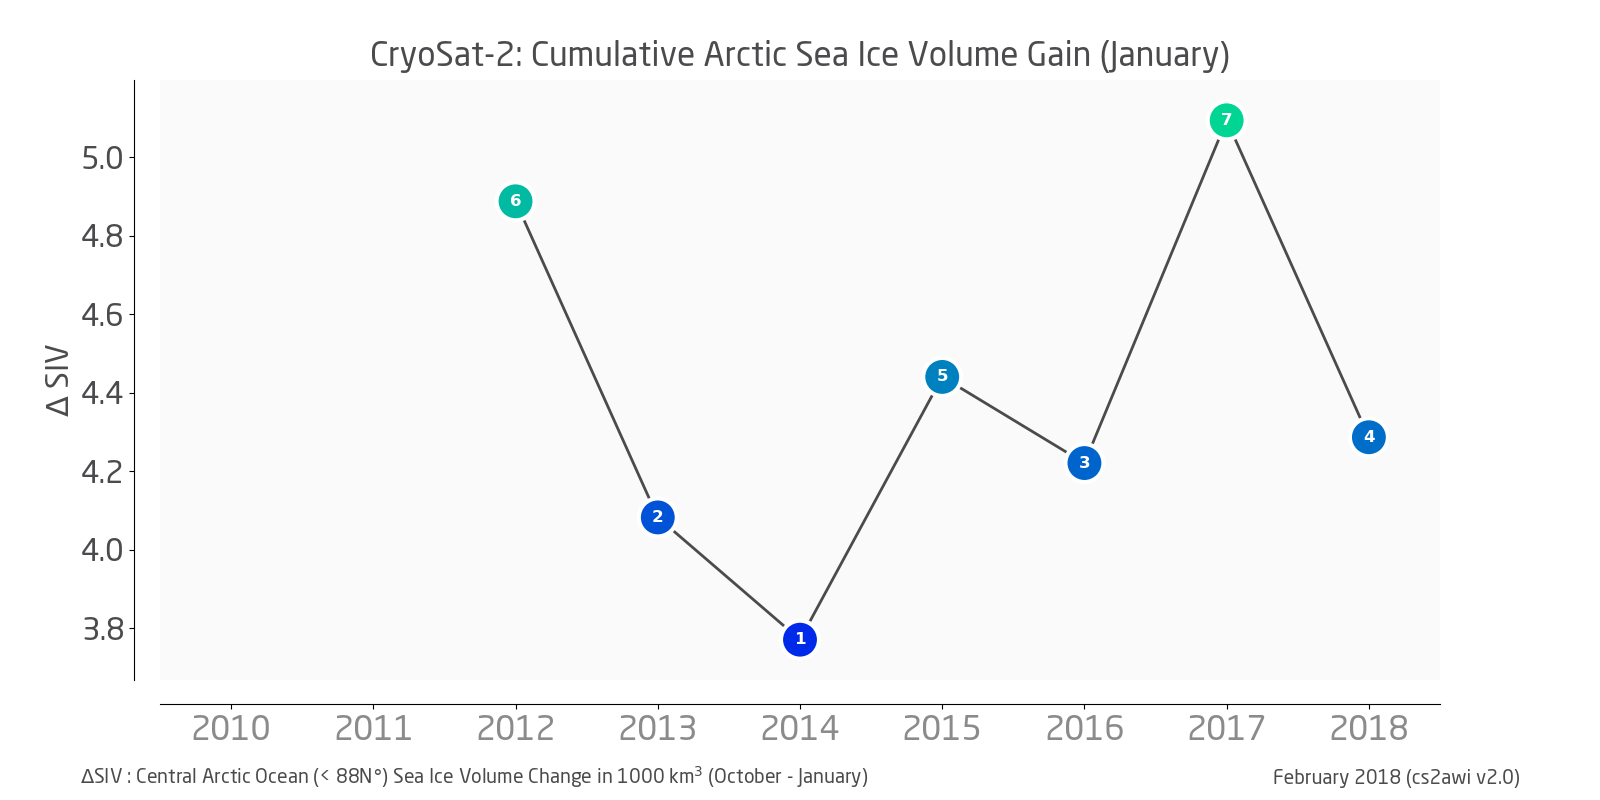
Arctic sea ice thickness information has been updated with NRT data for January 2018 and reprocessed data for December 2017. Daily, weekly and monthly products are available here: Reprocessed, Near-real time

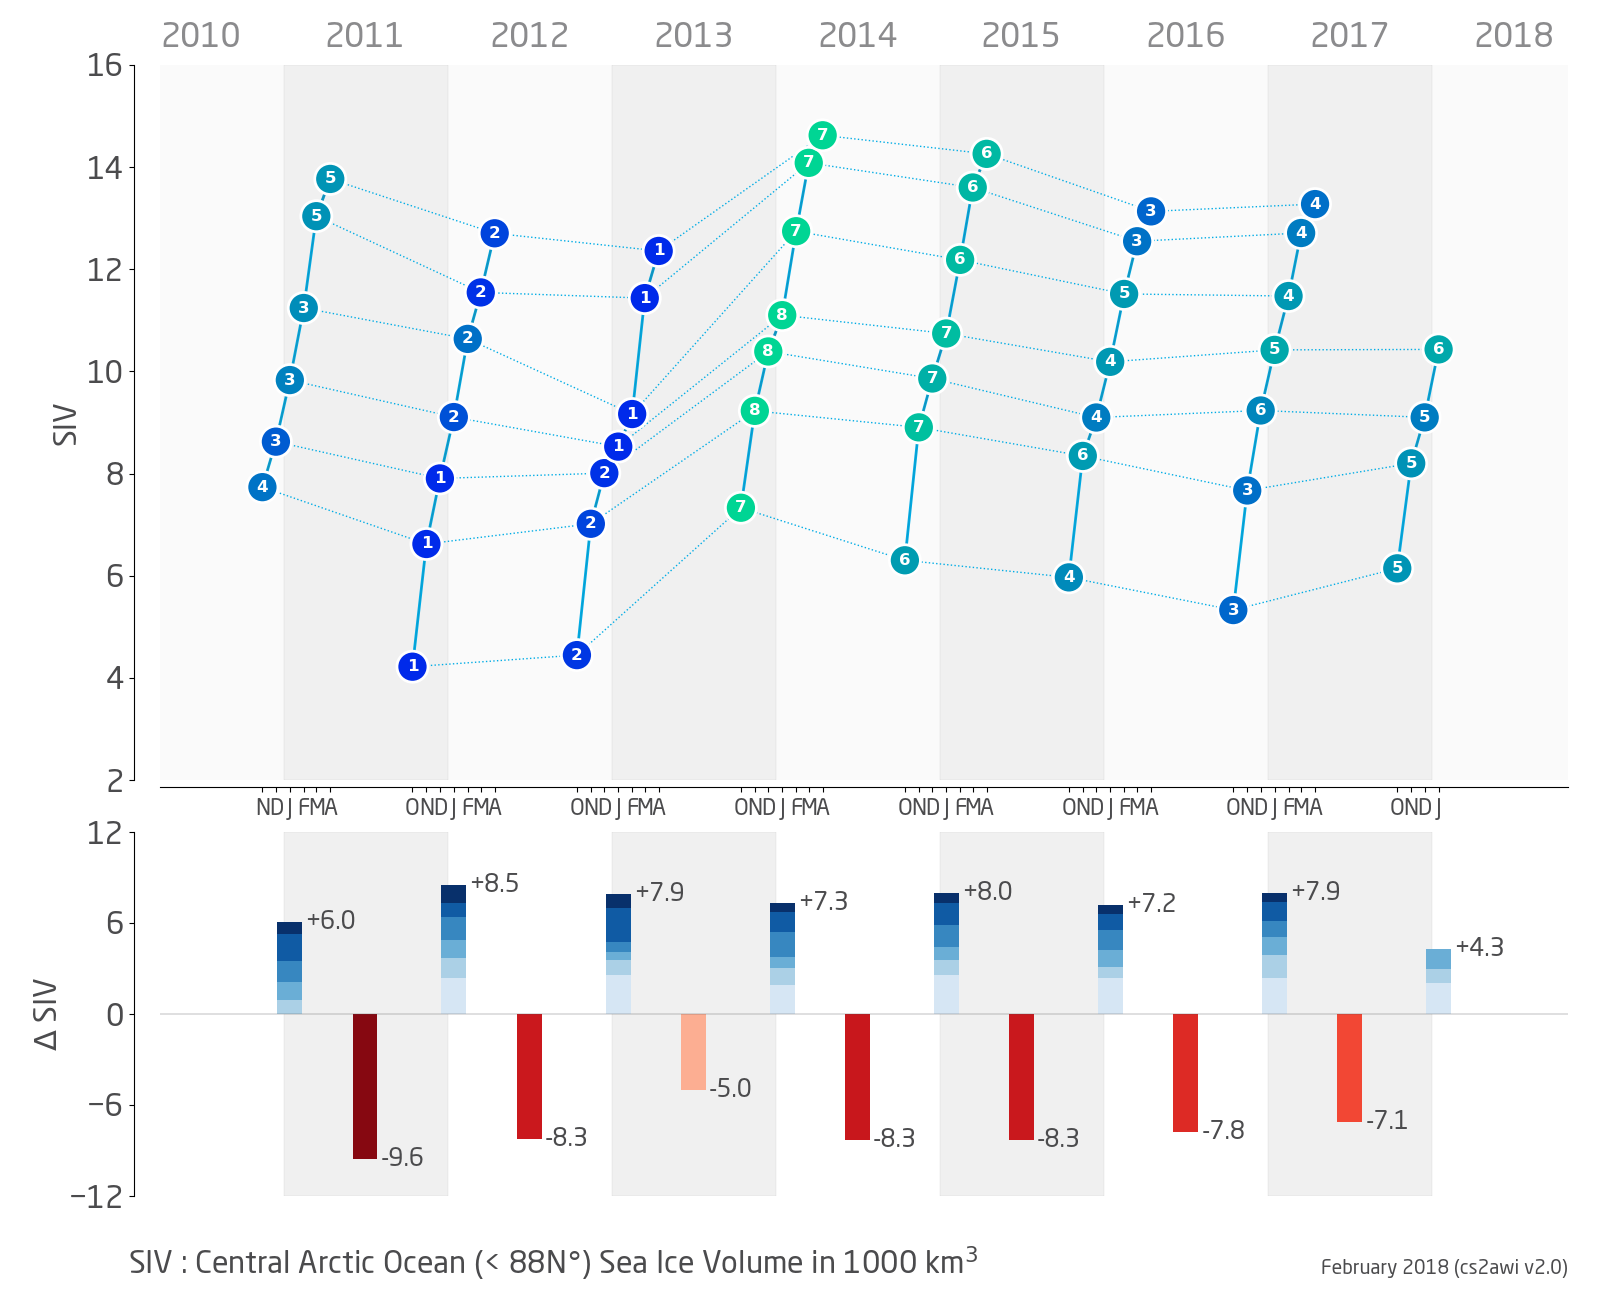

Short Facts
- December sea ice volume in the central Arctic was 6th lowest / 3rd highest in 8 years of CryoSat-2 observations: 10.43 km3
- highest: 11.10 km3 in Jan 2014
- lowest: 8.53 km3 in Jan 2013
- average: 10.04 km3
- Monthly sea ice volume gain (December through January) was highest in 8 years of CryoSat-2 observations: +1.33 km3
- lowest: +0.52 km3 in Jan 2013 (potential retrieval anomaly, under investigation)
- average: +1.02 km3
- Cummulative sea ice volume gain (October through January) was 4th lowest / 4th highest in 8 years of CryoSat-2 observations: +4.29 km3
- highest: +5.09 km3 in Jan 2017
- lowest: +3.77 km3 in Jan 2013 (potential retrieval anomaly, under investigation)
- average: +4.40 km3
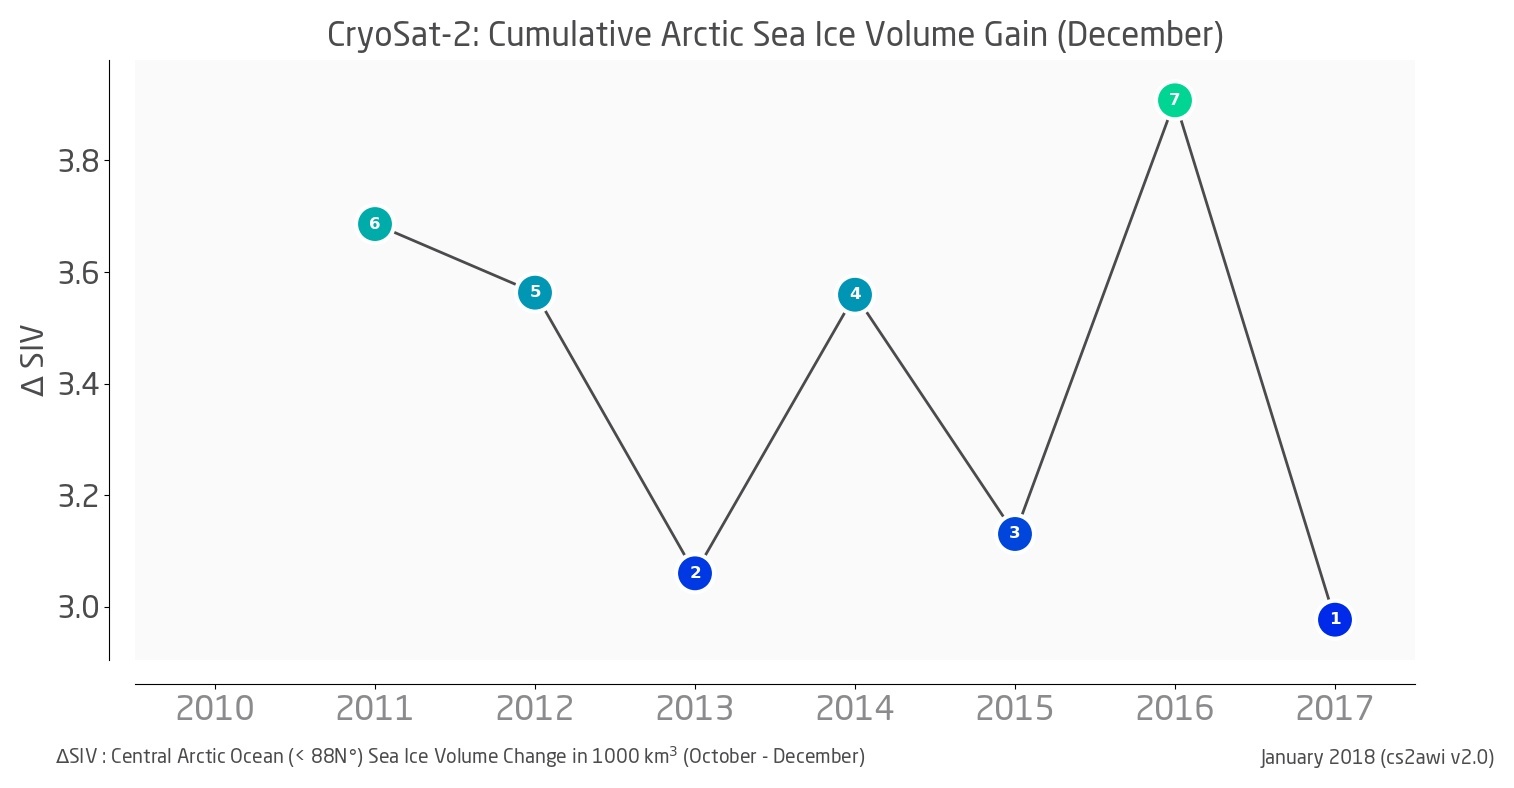
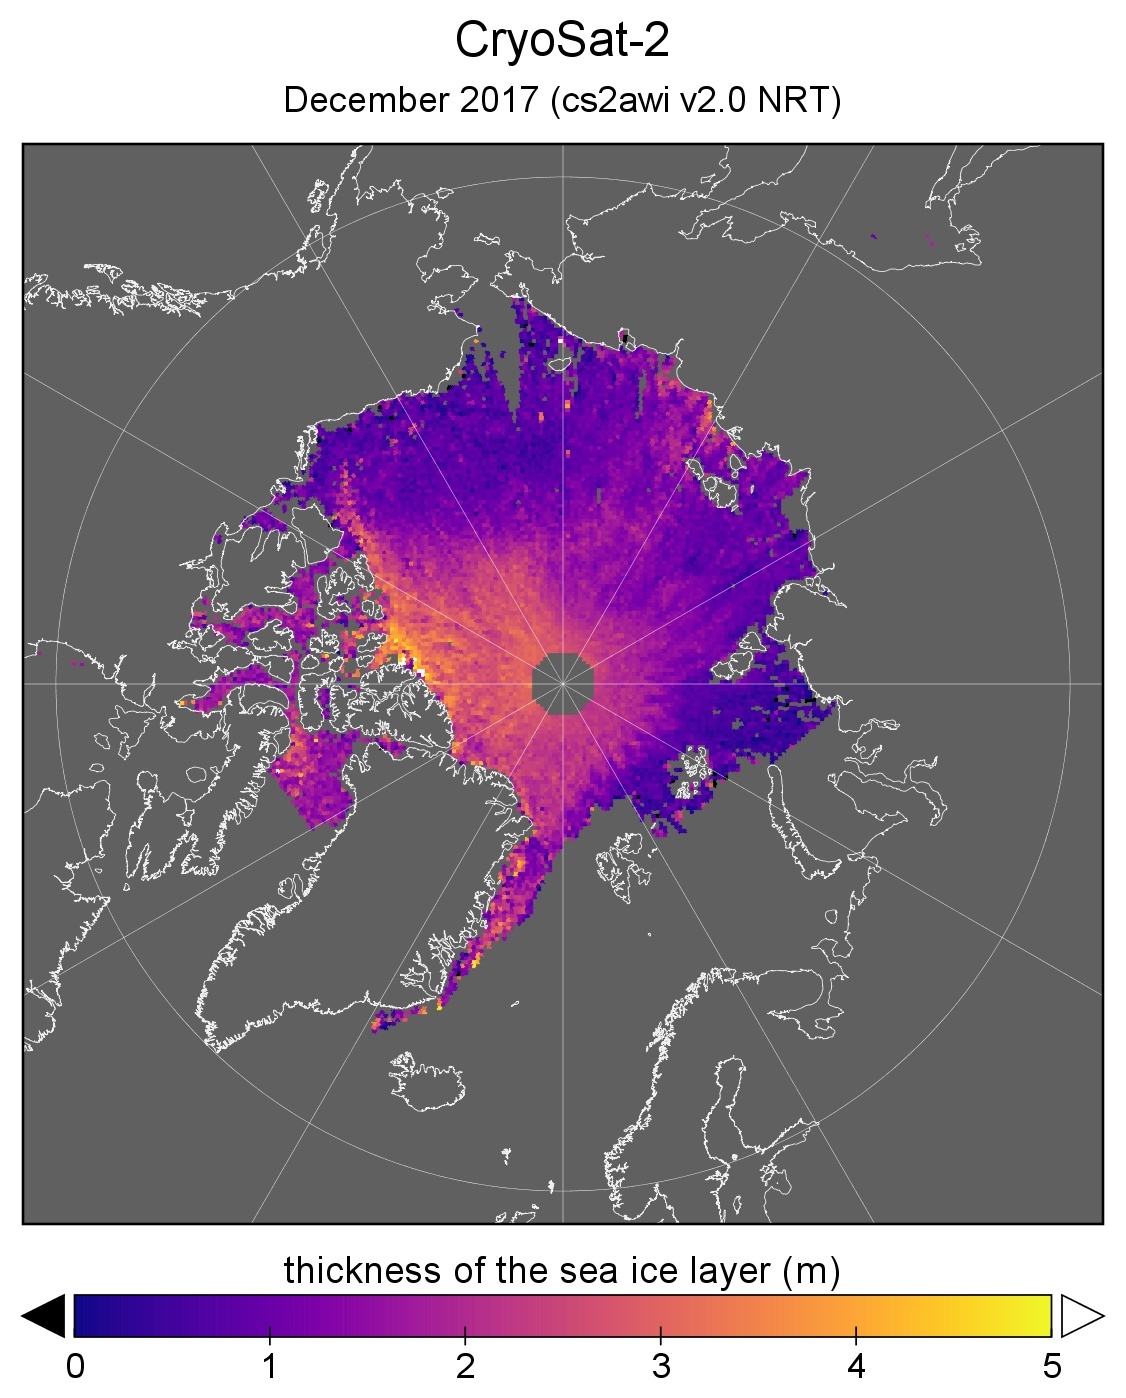
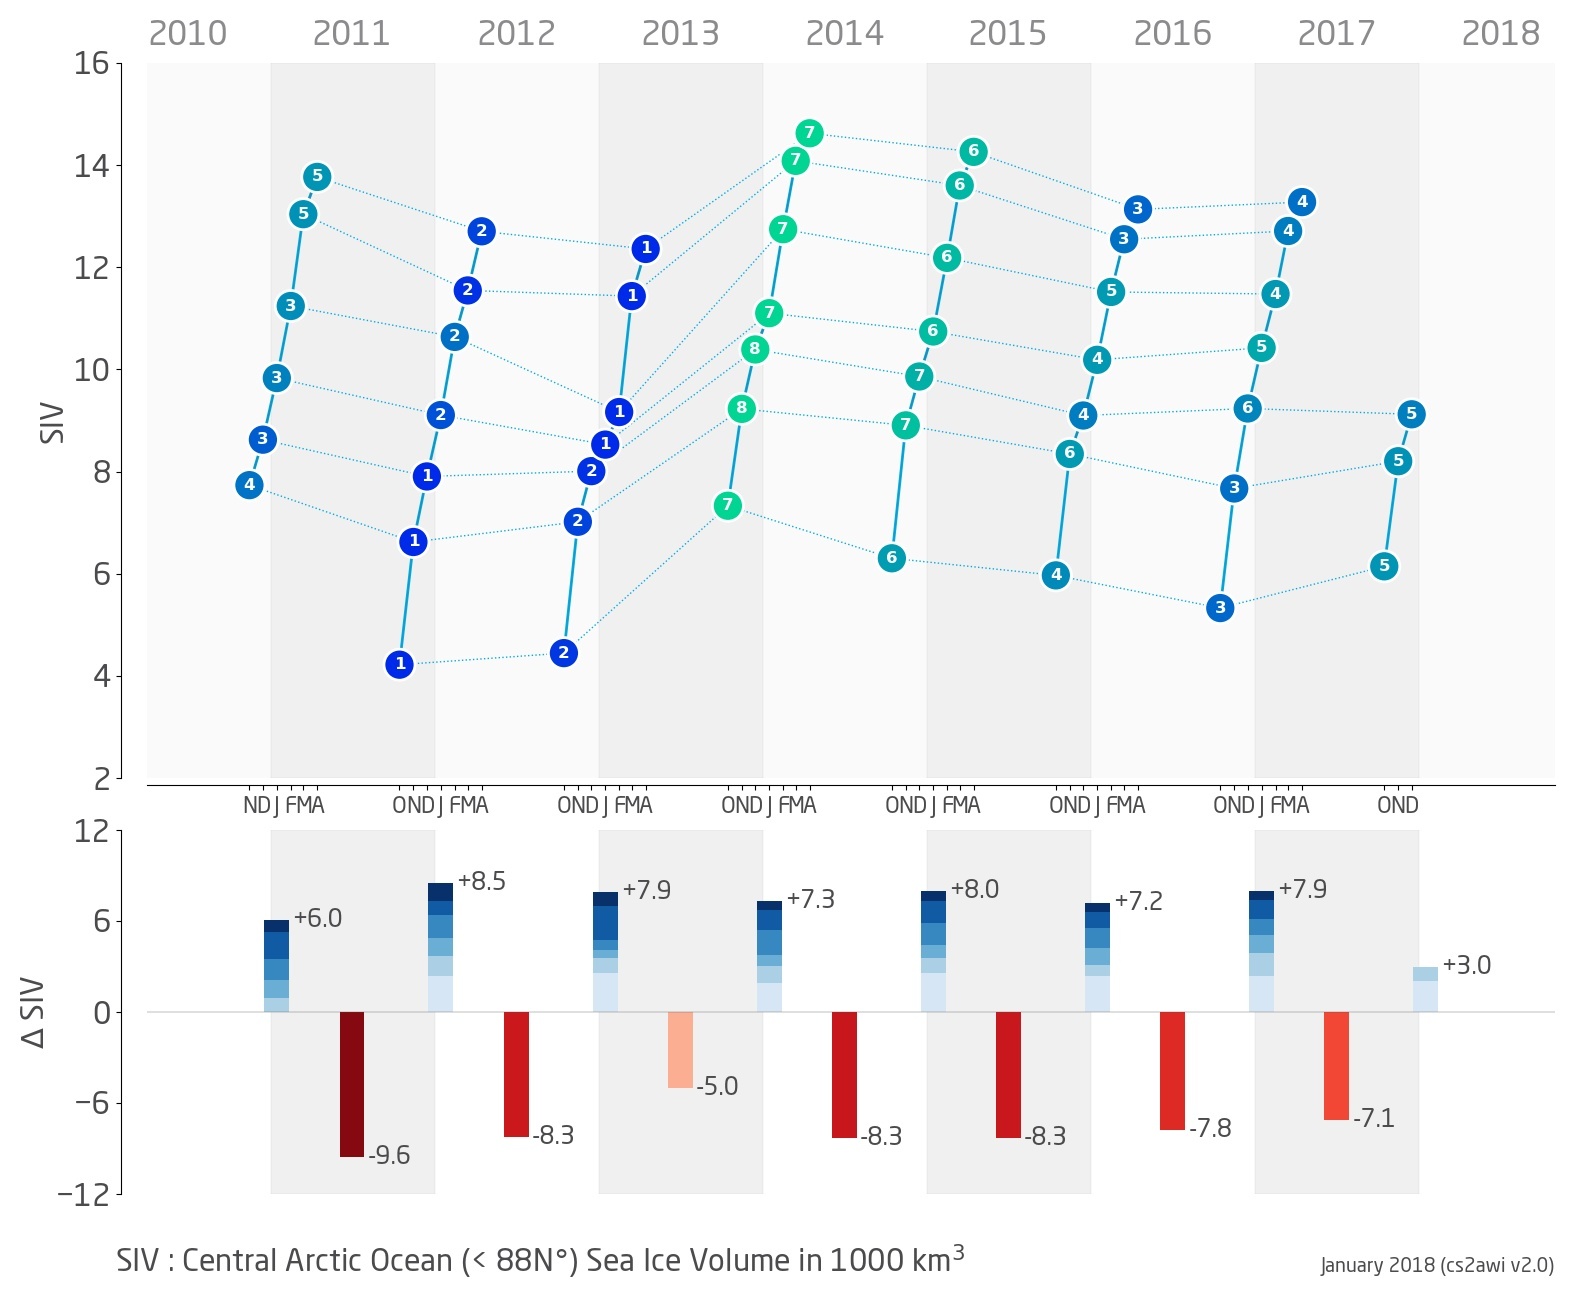
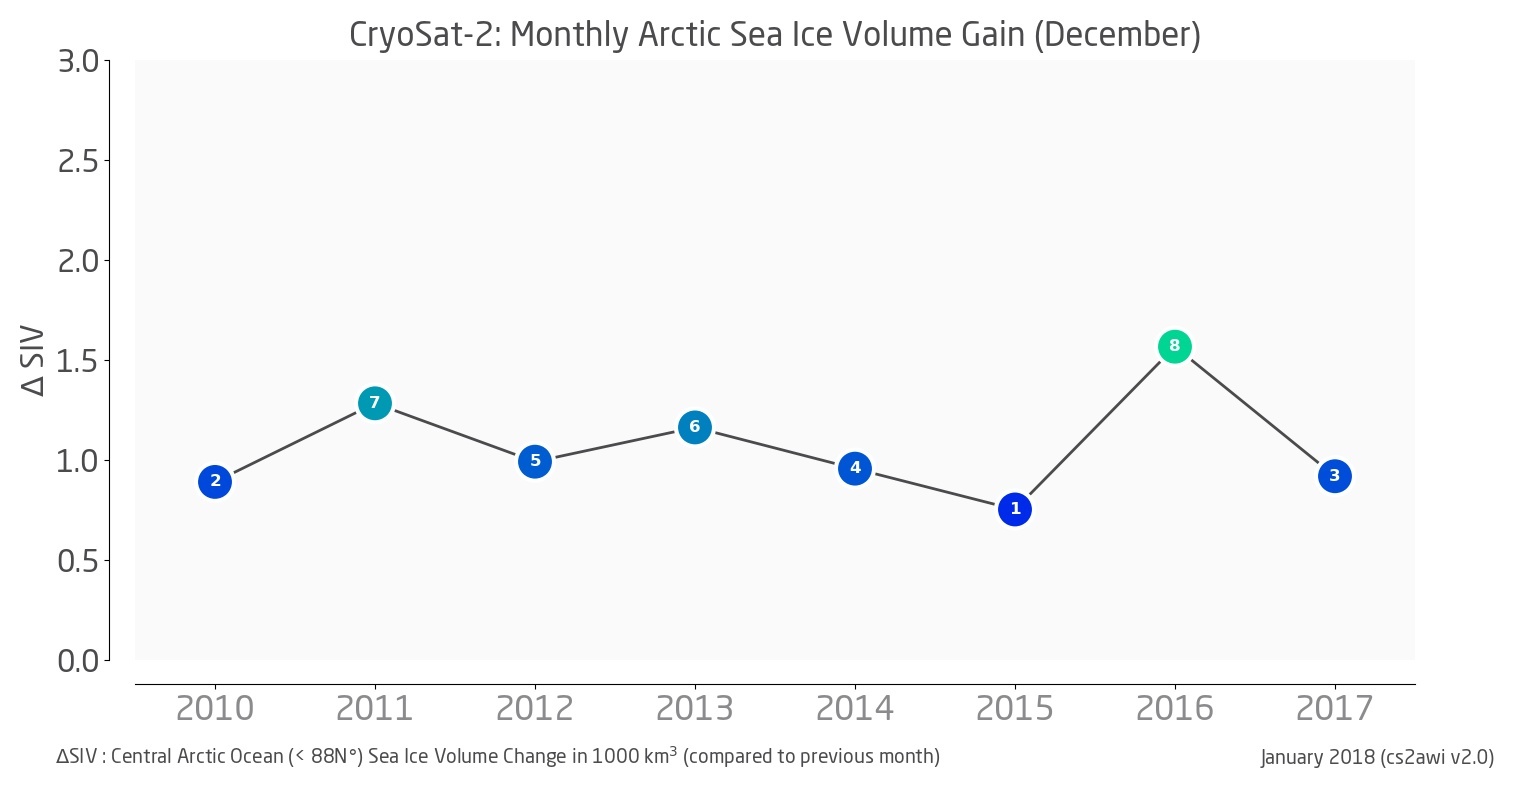
Arctic sea ice thickness information has been updated with NRT data for December 2017 and reprocessed data for November 2017. Daily, weekly and monthly products are available here: Reprocessed, Near-real time
Missing Input Data
CryoSat-2 NRT Level-1b input data was not available for December 16-17 on the ESA server. No sea ice data is available for these dates, which may affect estimates of sea ice volume and volume gain below.


Short Facts
- December sea ice volume in the central Arctic was 5th lowest in 8 years of CryoSat-2 observations: 9.12 km3
- highest: 10.39 km3 in Dec 2013
- lowest: 7.90 km3 in Dec 2011
- average: 9.03 km3
- Monthly sea ice volume gain (November through December) was 3rd lowest in 8 years of CryoSat-2 observations: +0.92 km3
- highest: +1.57 km3 in Dec 2016
- lowest: +0.75 km3 in Dec 2015
- average: +1.07 km3
- Cummulative sea ice volume gain (October through December) was lowest in 8 years of CryoSat-2 observations: +2.98 km3
- highest: +3.91 km3 in Dec 2016
- average: +3.41 km3
We started to work on online documentation of AWI sea ice radar altimetry (siral) data products. More content soon.