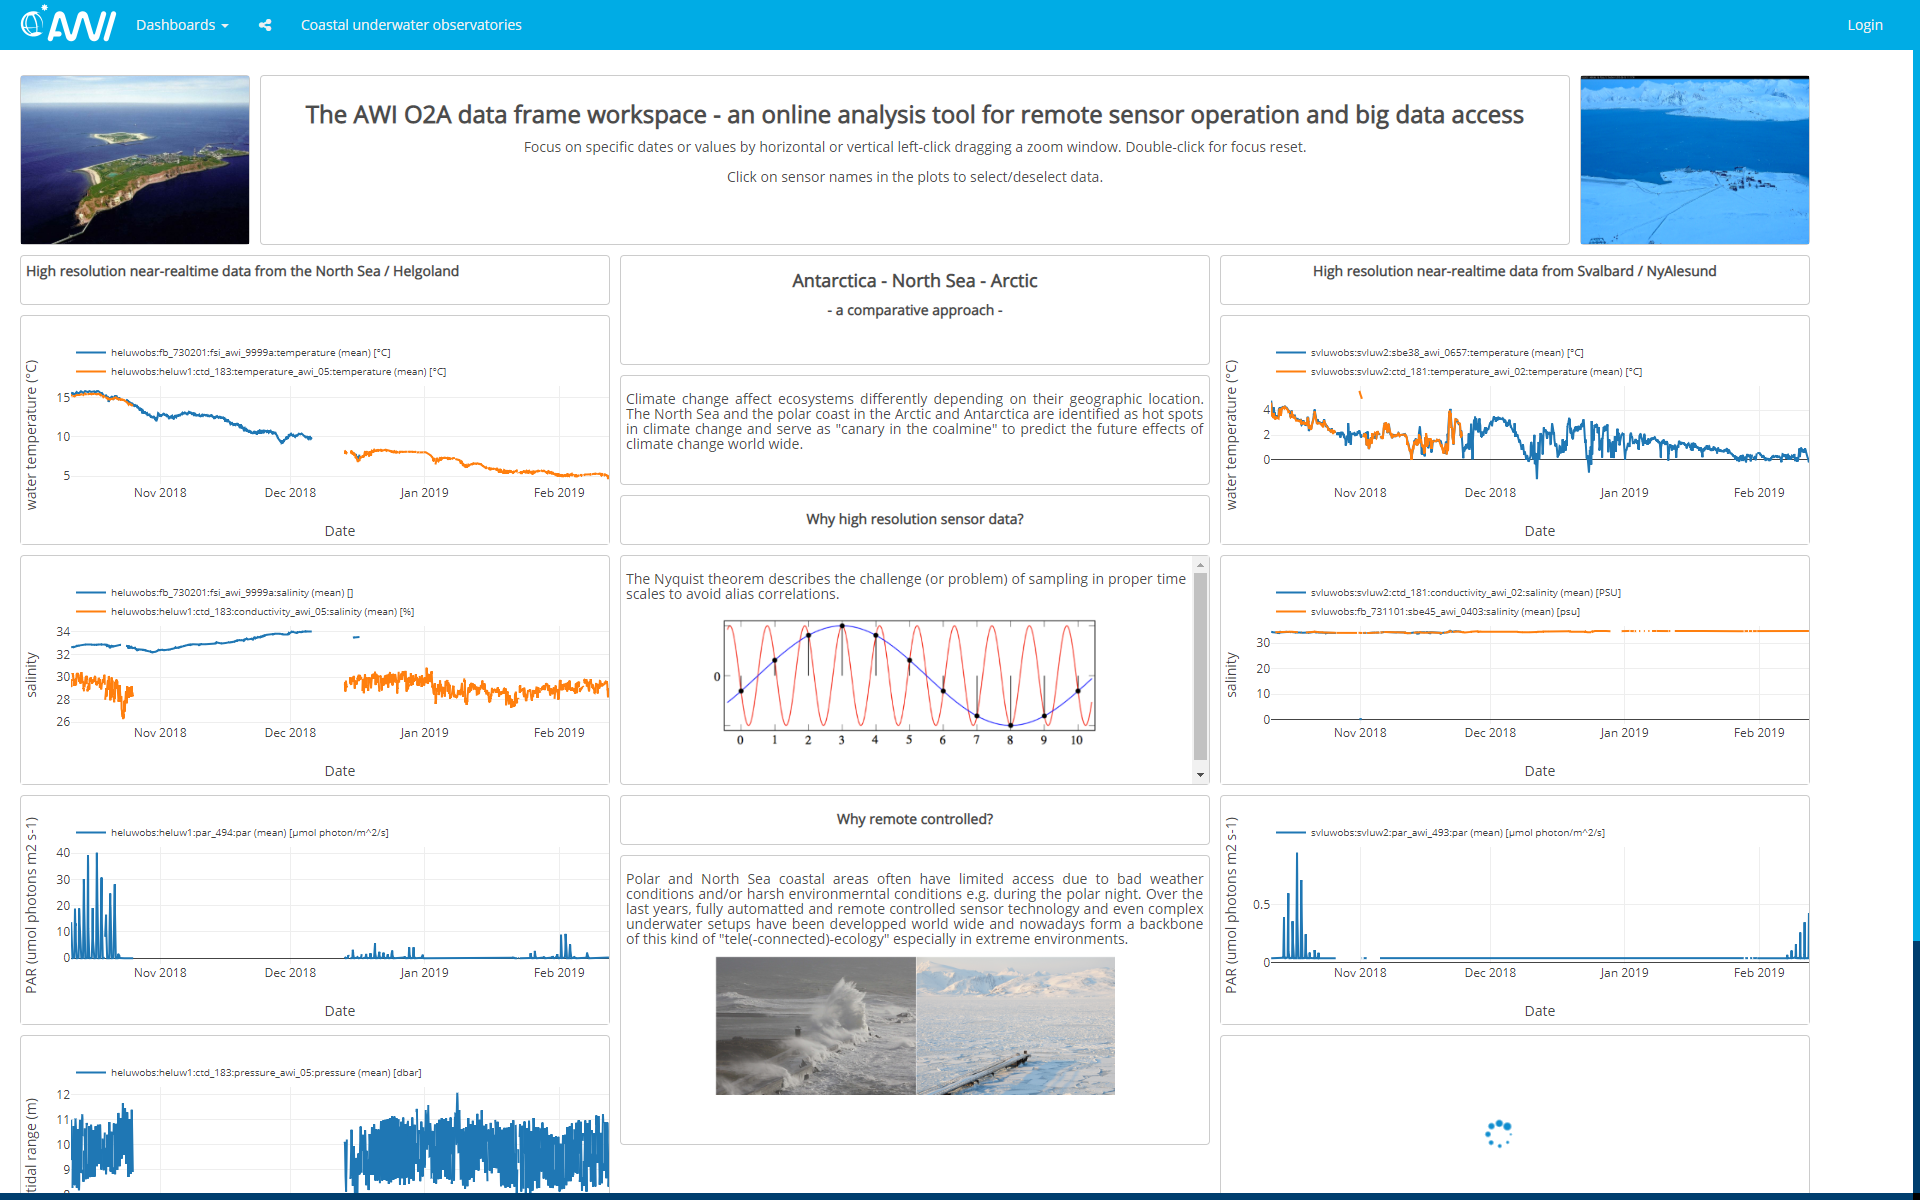
DASHBOARD.awi.de aims to display data streams for monitoring purposes. It supports:
- 2D graph widgets depicting changes in a parameter with time; X-axis may also display another parameter instead ot time as variable
- Heatmap widgets depicting changes in a parameter with time and depth/altitute including contour plot option; ideal for displaying bupy and mooring data
- Map widgets including color-coded paramterts; ideal for displaying data from ship-mounted instruments
- Statistical analysis of selected parameter
- Direct data download
- Machine-friendly data access via REST interface
- User-friendly change of aggregation and display settings
- Re-use widgets across distinct dashboards
- Publishing of individual dashboards (opened to all)
- Sharing of individual dashboard within a group
Contact
Questions, need an account?: ![]() o2a-support (at) awi.de
o2a-support (at) awi.de
Found a bug? ![]() o2a-bug (at) awi.de
o2a-bug (at) awi.de
Recommended Videos
Sharing an publishing a dashboard, Generating a heatmap, changing data aggregation and display, Showing statistics
Data Services
List of APIs: https://dashboard.awi.de/data-xxl/
Download and aggregate NRT data: https://dashboard.awi.de/data-xxl/overview.jsp
Data Analytics
Use cases: https://github.com/bgruening/galaxy-rna-workbench
Overview
Content Tools