Page History
Description
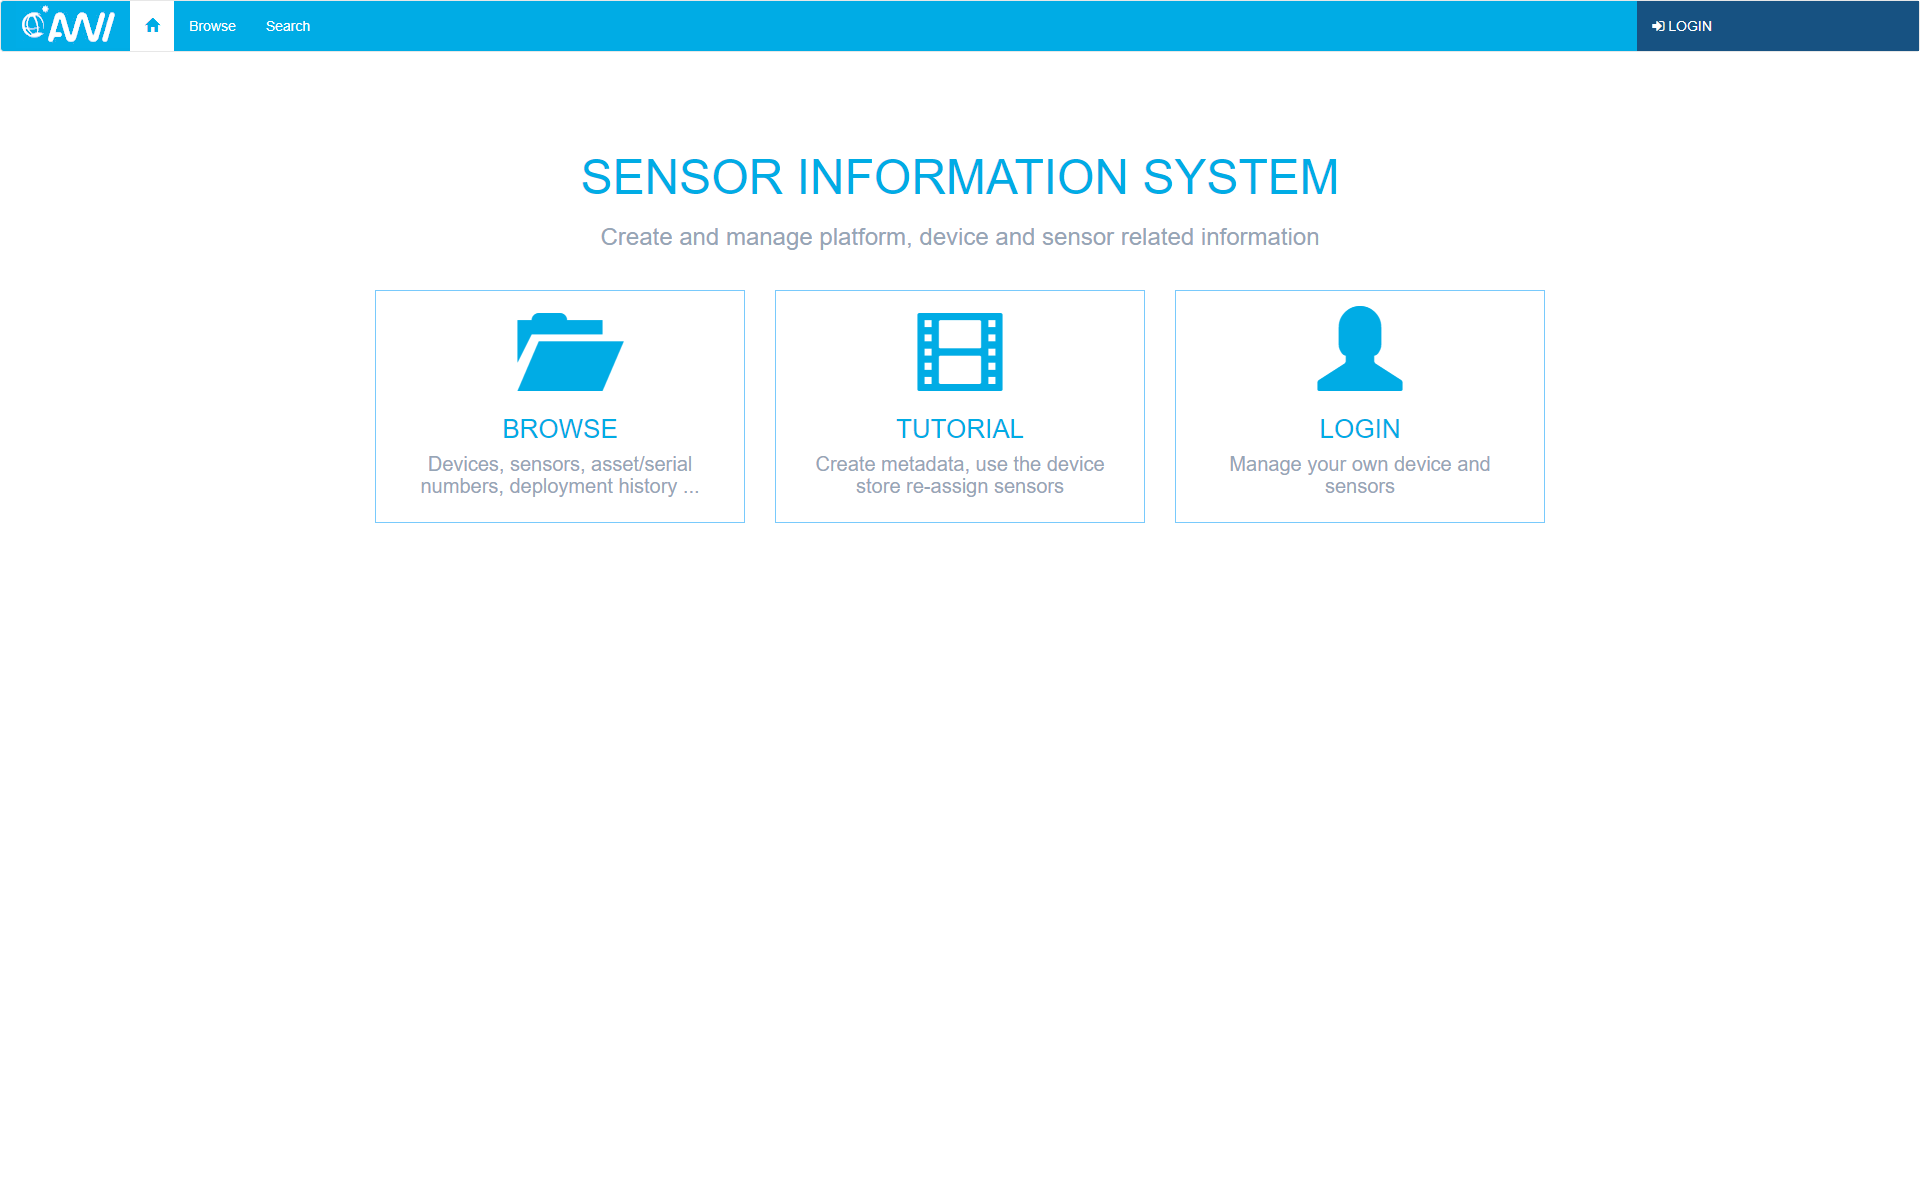
DASHBOARD aims to create an authoritative repository for managing platform, device and sensor-related information. It was launched in August 2016 and it will be continuously improved in the form of bi-annual release packages.It supports:
- Metadata versionning including minting of PIDs for individual versions along with citation. Example: https://hdl.handle.net/10013/sensor.7bdbc478-a4c9-4eb9-917d-9a89ee098774#subItemID=625&subItemEventID=3634
- Good-scientific pratice. Example: https://doi.pangaea.de/10.1594/PANGAEA.857507 links dataset in PANGAEA to sensor description, under event information
- Management and discovery of standard sensor-specific information (e.g. manufacturer information, inventory number, history of actions, precision, photos, etc),
- Management and discovery of data-specific information (calibration reports, physical characterization of individual sensors, etc),
- Bookkeeping of ownership/affiliation of devices
- Machine-friendly access to metadata. Example: OGC compliant output standards,
- Supports the use of sensor properties used in machine-friendly monitoring of data streams in near real-time (see DASHBOARD)
- Re-use in AWI-operated portals and various national and international service infrastructures. Example: https://data.awi.de/?site=platforms
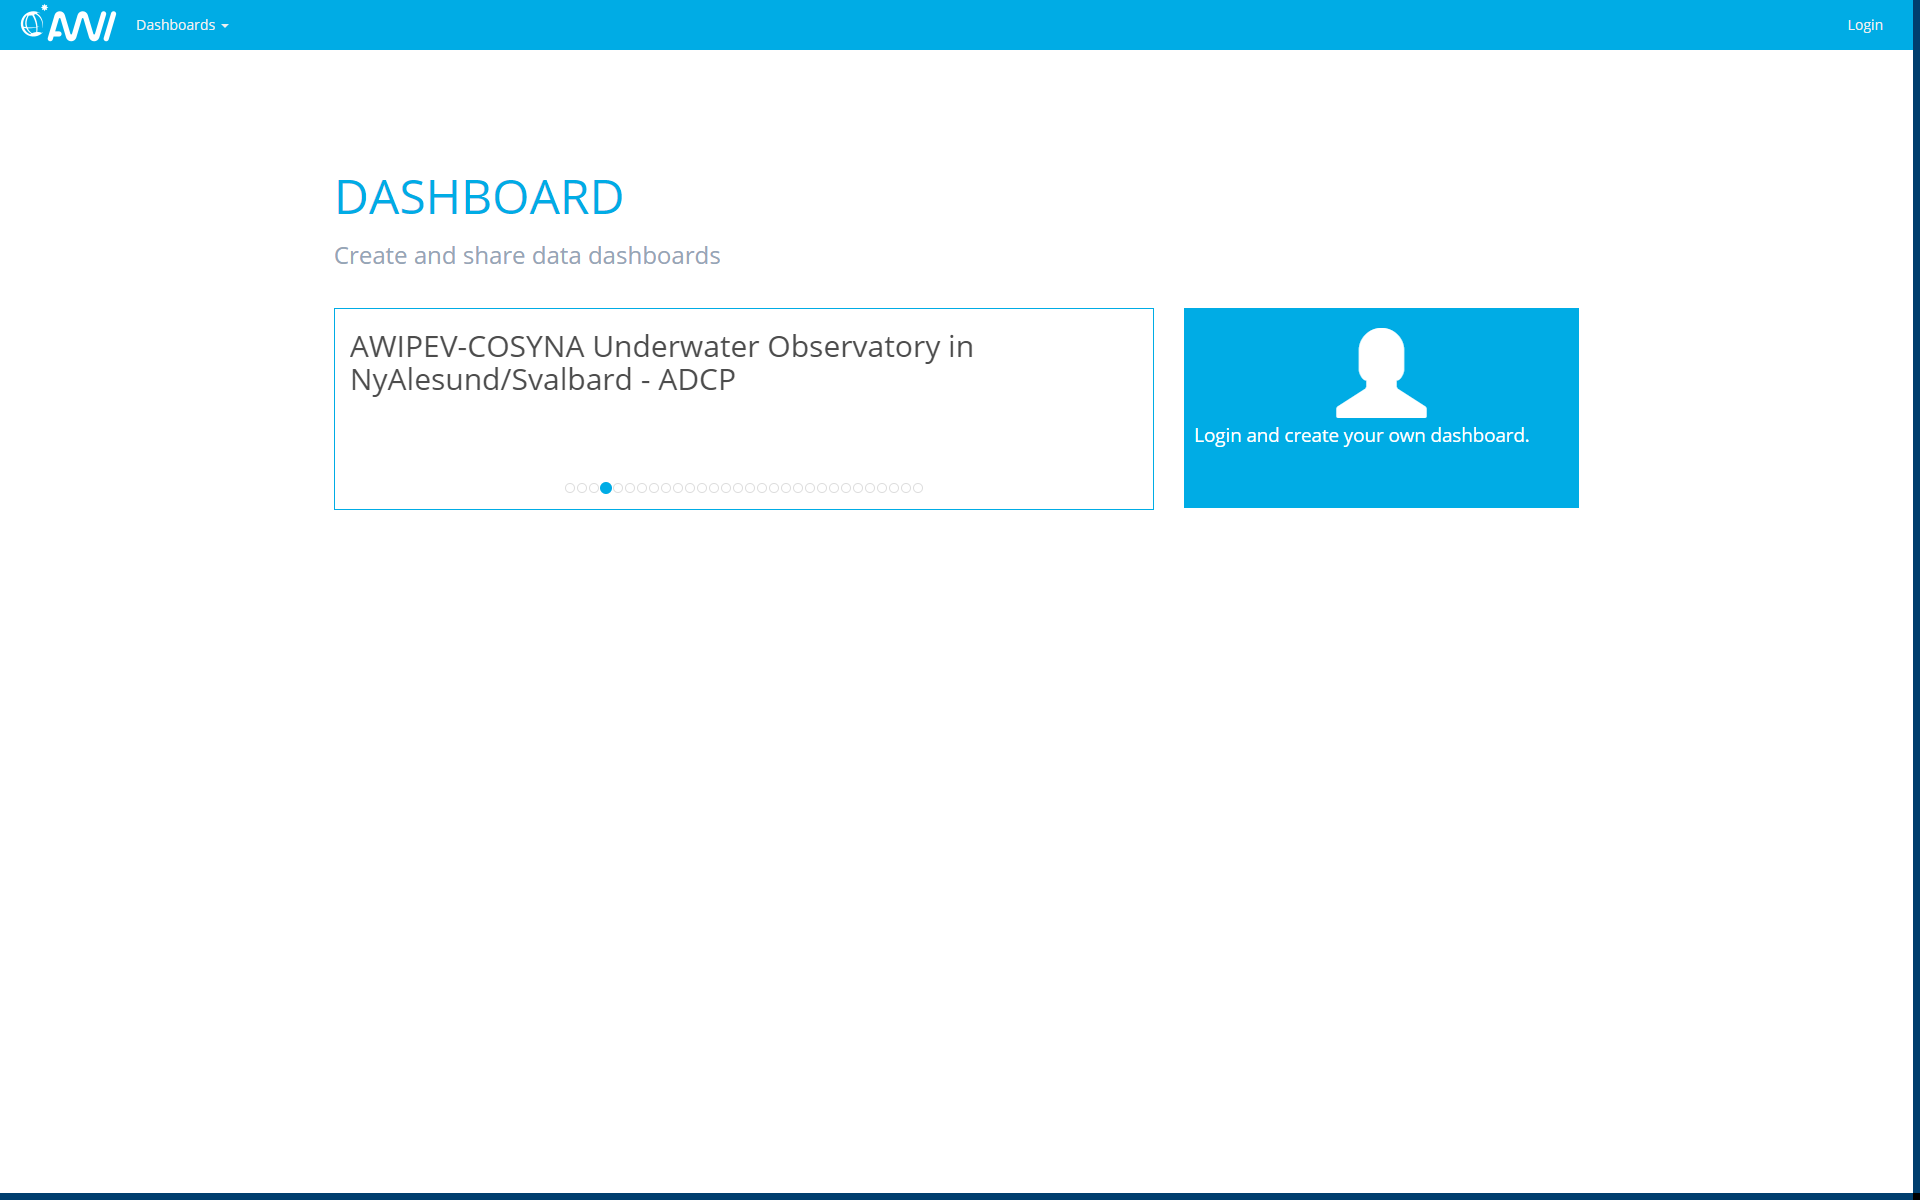
aims to display data streams for monitoring purposes. It supports:
- 2D graph widgets depicting changes in a parameter with time; X-axis may also display another parameter instead ot time as variable
- Heatmap widgets depicting changes in a parameter with time and depth/altitute including contour plot option; ideal for displaying bupy and mooring data
- Map widgets including color-coded paramterts; ideal for displaying data from ship-mounted instruments
- Statistical analysis of selected parameter
- Direct data download
- Machine-friendly data access via REST interface
- User-friendly change of aggregation and display settings
- Re-use widgets across distinct dashboards
- Publishing of individual dashboards (opened to all)
- Sharing of individual dashboard within a group
Contact
Questions, need an account?: ![]() o2a-support (at) awi.de
o2a-support (at) awi.de
Found a bug? ![]() o2a-bug (at) awi.de
o2a-bug (at) awi.de
Tutorials
Key Use cases
Generating a cite-enabled versionheatmap | Cloning a buoy or mooringSharing an publishing a dashboard
| Changing data aggregation and display
| Defining the affiliation of a device
|
|---|

Showing statistics
|
|---|

Janik Eilers


Robert Huber

Carsten Schirnick

Antonia Immerz

Phillip Fisher
FRAM
Ingo Schewe
PERMAFROST
Saskia BacherData Services
- API to REST services https://sensor.awi.de/api
- SensorML response, ID 625 as example https://sensor.awi.de/rest/sensors/device/getDeviceAsSensorML/625
- JSON response including childern, ID 458 as example https://sensor.awi.de/rest/sensors/device/getDetailedItem/458?includeChildren=true
Overview
Content Tools