DASHBOARD.awi.de aims to display data streams for monitoring purposes. It supports:
2D graph widgets depicting changes in a parameter with time; X-axis may also display another parameter instead ot time as variable
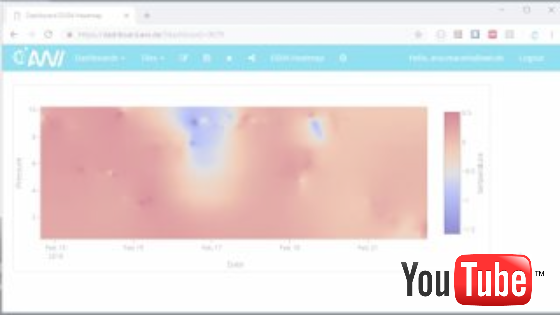
Heatmap widgets depicting changes in a parameter with time and depth/altitude including contour plot option; ideal for displaying mooring and CTD data
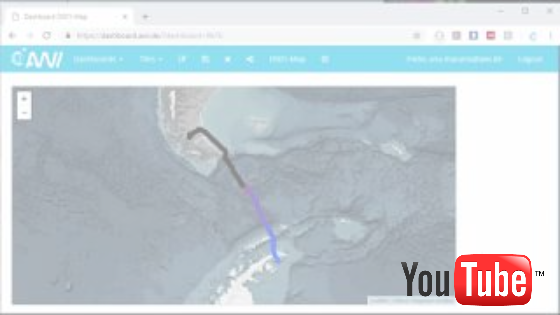
Map widgets including color-coded parameters; ideal for displaying data from ship-mounted instruments
Statistical analysis of selected parameter
Direct data download
Machine-friendly data access via REST interface
User-friendly change of aggregation and display settings
Re-use widgets across distinct dashboards
Publishing of individual dashboards (opened to all)
Sharing of individual dashboard within a group
Related Links
|
Questions, feature requests, bugs?: |