Page History
Description
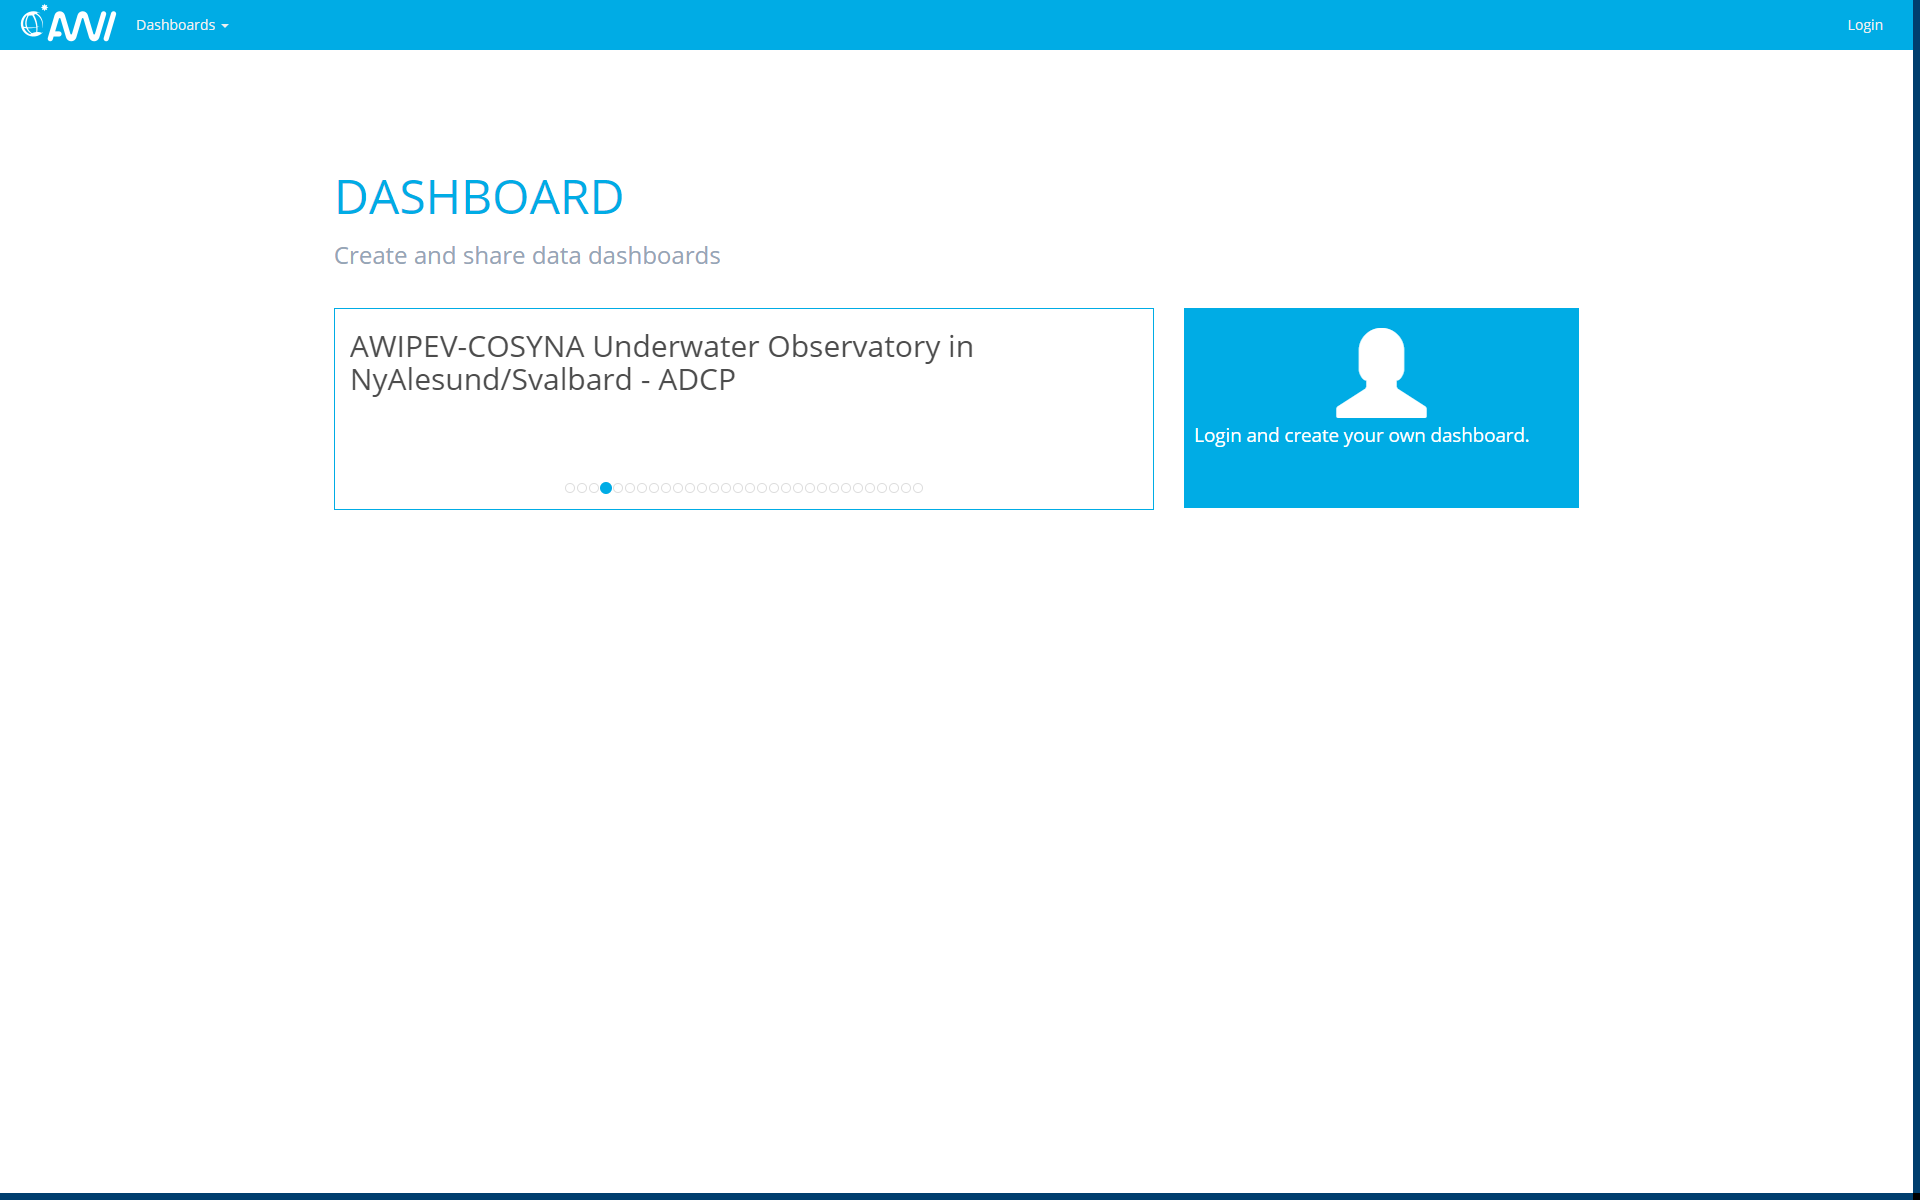
DASHBOARD
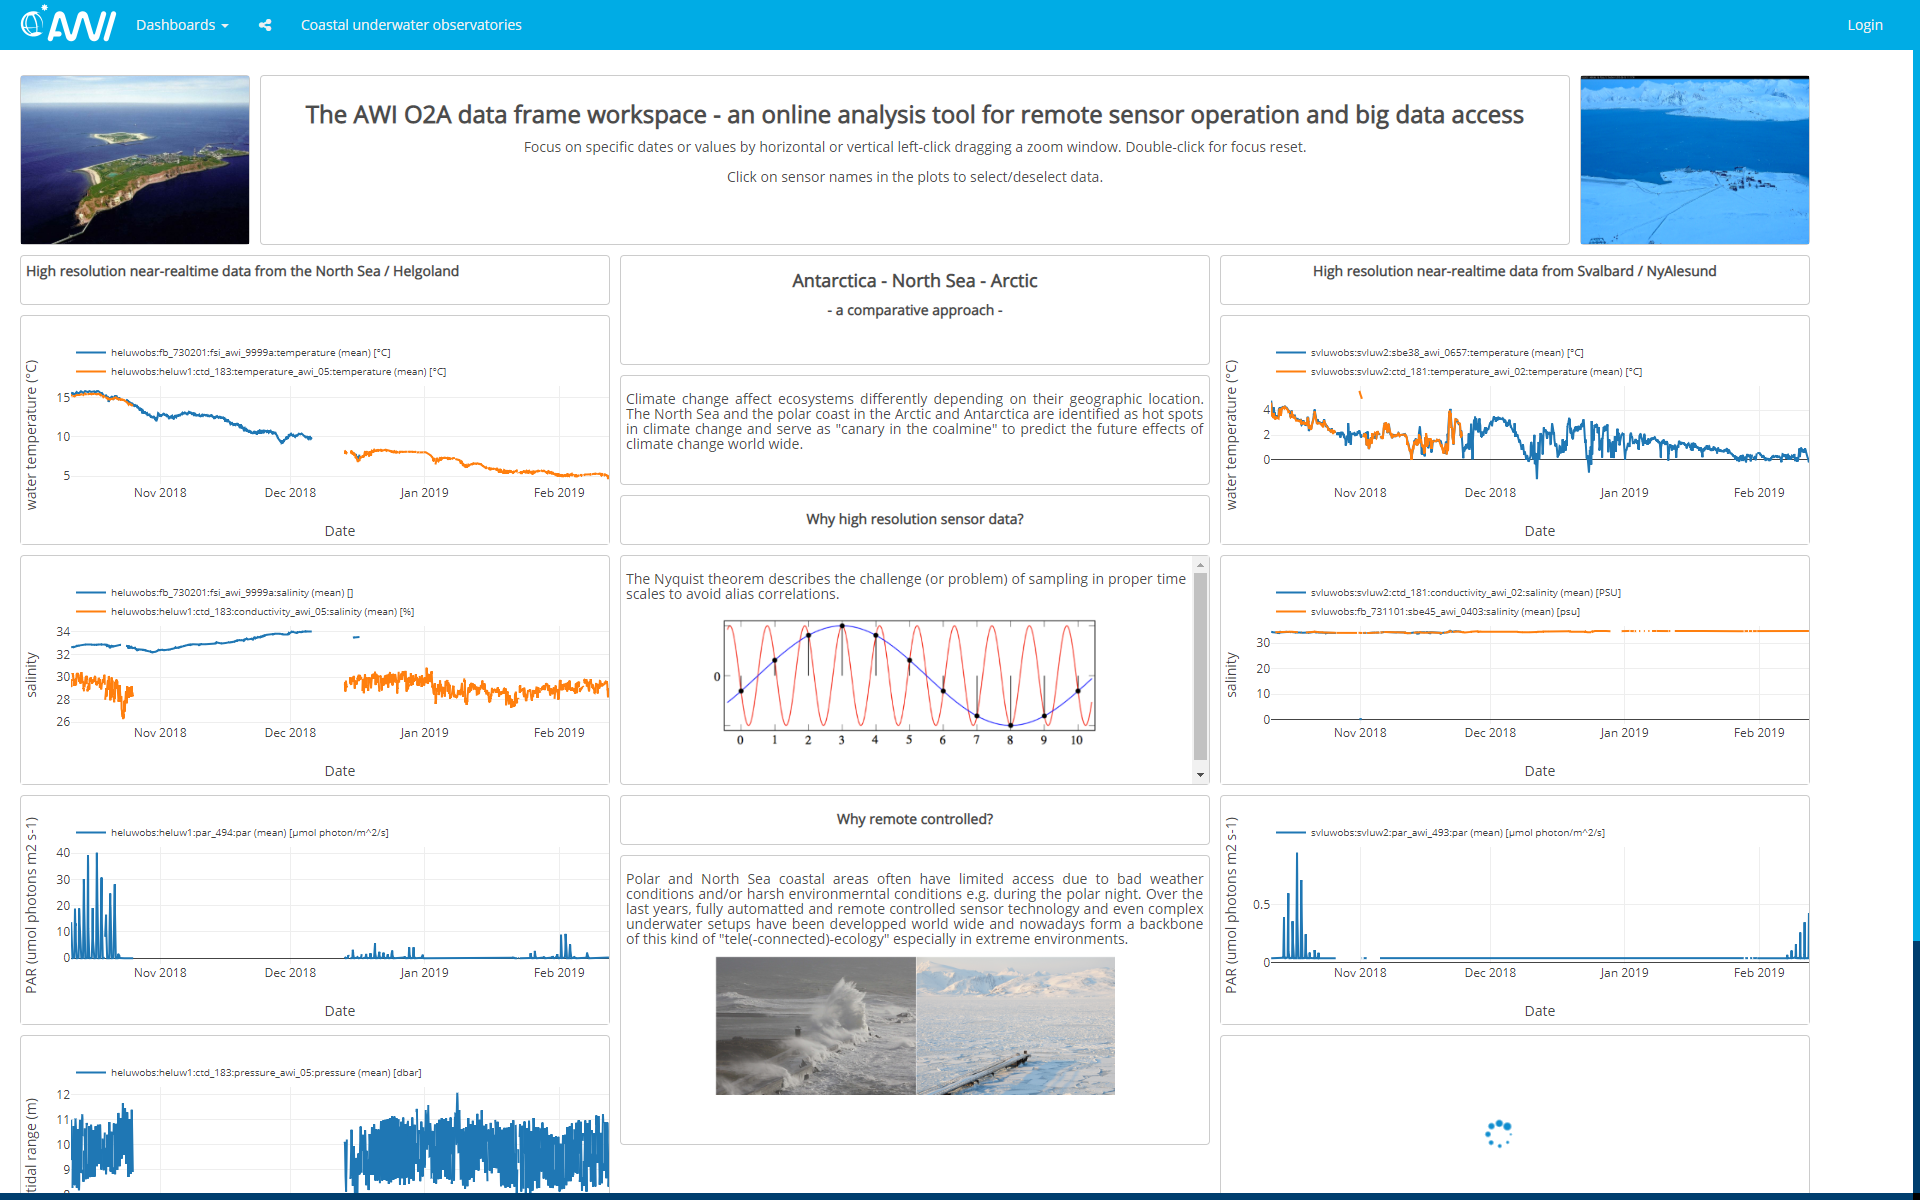
.awi.de aims to display data streams for monitoring purposes. It supports:
2D graph widgets depicting changes in a parameter with time; X-axis may also display another parameter instead ot time as variable
Heatmap widgets depicting changes in a parameter with time and depth/
altitutealtitude including contour plot option; ideal for displaying
bupymooring and
mooringCTD data
Map widgets including color-coded
paramtertsparameters; ideal for displaying data from ship-mounted instruments
Statistical analysis of selected parameter
Direct data download
Machine-friendly data access via REST interface
User-friendly change of aggregation and display settings
Re-use widgets across distinct dashboards
Publishing of individual dashboards (opened to all)
Sharing of individual dashboard within a group
Tutorials
Related Links
|
Recommended Videos
Tutorials
Key Use cases
Generating a heatmap
Sharing an publishing a dashboard
Changing data aggregation and display
Showing statistics
Data Services
API to REST services| Widget Connector | |||
|---|---|---|---|
|
|
|
|
|
| Widget Connector | |||
|---|---|---|---|
|
|
|
|
|
Overview
Content Tools