| Panel | ||||||
|---|---|---|---|---|---|---|
| ||||||
|
| Panel | ||||||||||||||||||
|---|---|---|---|---|---|---|---|---|---|---|---|---|---|---|---|---|---|---|
| ||||||||||||||||||
LinksProduct DescriptionDocumentESA Websites: Visualization of NetCDF data: | ||||||||||||||||||
| Panel | ||||||||||||||||||
| ||||||||||||||||||
Overview | ||||||||||||||||||
| Panel | ||||||||||||||||||
| ||||||||||||||||||
Product DescriptionOverviewTable 1: Overview of SMOS Product
File naming conventionNetCDF files are named using the following convention: <institution>-<product>-<processing level>-<parameter>-<platform(s)>-<mode>-<grid>-<time>-<version>.nc | ||||||||||||||||||
institution | Alfred Wegener Institute (AWI): awi | |||||||||||||||||
product | CryoSat-2/SMOS merged product: cs2smos | |||||||||||||||||
processing level | Level 4: l4 | |||||||||||||||||
parameter | Sea ice thickness: sithick | |||||||||||||||||
Platform(s) | Satellites: SMOS, CryoSat-2 | |||||||||||||||||
mode | Reprocessing: rep, near-real-time: nrt | |||||||||||||||||
grid | 25 km EASE2 grid, Northern Hemisphere: nh25km_ease2 | |||||||||||||||||
time | Time span: yyyymmdd - yyyymmdd | |||||||||||||||||
version | Version 2.0: fv2p0 |
Attribute | Value | |
|---|---|---|
title | Sea Ice Thickness derived from merging CryoSat-2 and SMOS ice thickness | |
descriptionWeekly Arctic sea-ice thickness derived from CryoSat-2 and SMOS using an optimal interpolation scheme | ||
summaryWeekly Arctic sea-ice thickness derived from CryoSat-2 and SMOS using an optimal interpolation scheme | ||
keywords | Cryosphere > Sea Ice > Sea Ice Thickness | |
product_versionfv2p0 | ||
processing_moderep | ||
time_of_creationMon Oct 22 17:27:55 2018 | ||
history | Mon Oct 22 17:27:55 2018 creation | |
ConventionsCF-1.6 ACDD-1.3 | ||
spatial_resolution | 25.0 km grid spacing | |
geospatial_lat_min16.623929977416992 | ||
geospatial_lat_max | 90.0 | |
geospatial_lon_min | -180.0 | |
geospatial_lon_max | 180.0 | |
geospatial_vertical_min | 0.0 | |
geospatial_vertical_max | 0.0 | |
time_coverage_start | 2018-0310-26T0028T00:00:00Z | |
time_coverage_end | 2018-0410-01T0028T23:0059:00Z | |
time_coverage_duration | P7DP1D | |
time_coverage_resolution | P7DP1D | |
platform | CryoSat-2, SMOS | |
project | CS2SMOS PDS: SMOS & CryoSat-2 Sea Ice Data Product Processing and Dissemination Service | |
institution | Alfred-Wegener-Institut Helmholtz Zentrum für Polar und Meeresforschung (AWI), http://www.awi.de | |
creator_name | Alfred-Wegener-Institut Helmholtz Zentrum für Polar und Meeresforschung (AWI), http://www.awi.de | |
creator_type | institution | |
creator_url | ||
publisher_email | ||
referencesRicker, R., Hendricks, S., Kaleschke, L., Tian-Kunze, X., King, J., and Haas, C.: A weekly Arctic sea-ice thickness data record from merged CryoSat-2 and SMOS satellite data, The Cryosphere, 11, 1607-1623, https://doi.org/10.5194/tc-11-1607-2017, 2017. | ||
_CoordSysBuilder | ucar.nc2.dataset.conv.CF1Convention |
Table 3: NetCDF file content. Note, that we use a scaling factor of 10^-3 and a fillvalue = -2147483647.
Variable | Description | Unit | Type | Dimension |
|---|---|---|---|---|
Lambert_Azimuthal_Grid | Add description | - | int | - |
time_bnds | Start and end time of the weekly retrieval | seconds since 1978-01-01 00:00:00 | int | 2 |
analysis_ice_thickness | CS2SMOS weekly merged sea ice thickness | m | Int | 1,432,432 |
background_ice_thickness | background field, interpolation using CS2 and SMOS sea ice thickness data | m | Int | 1,432,432 |
weighted_mean_ice_thickness | weighted mean of weekly CS2 and SMOS ice thickness retrievals | m | Int | 1,432,432 |
innovation | difference between background and analysis ice thickness | m | Int | 1,432,432 |
ice_conc | sea ice concentration | % | Int | 1,432,432 |
ice_type | sea ice type (OSI-403-c) | - | Int | 1,432,432 |
correlation_length_scale | correlation length scale of background ice thickness | m | Int | 1,432,432 |
analysis_thickness_unc | uncertainty of the merged sea ice thickness | m | Int | 1,432,432 |
smos_ice_thickness | weekly averaged SMOS ice thickness | m | Int | 1,432,432 |
cs2_ice_thickness | weekly averaged CryoSat-2 ice thickness | m | Int | 1,432,432 |
time | reference time of product (middle of the week) | seconds since 1978-01-01 00:00:00 | Int | 1 |
xc | x coordinate of projection (eastings) | km | Int | 432 |
yc | y coordinate of projection (northings) | km | Int | 432 |
lon | longitude coordinate | degrees_north | Int | 432,432 |
lat | latitude coordinate | degrees_east | int | 432,432 |
| Panel | ||||||
|---|---|---|---|---|---|---|
| ||||||
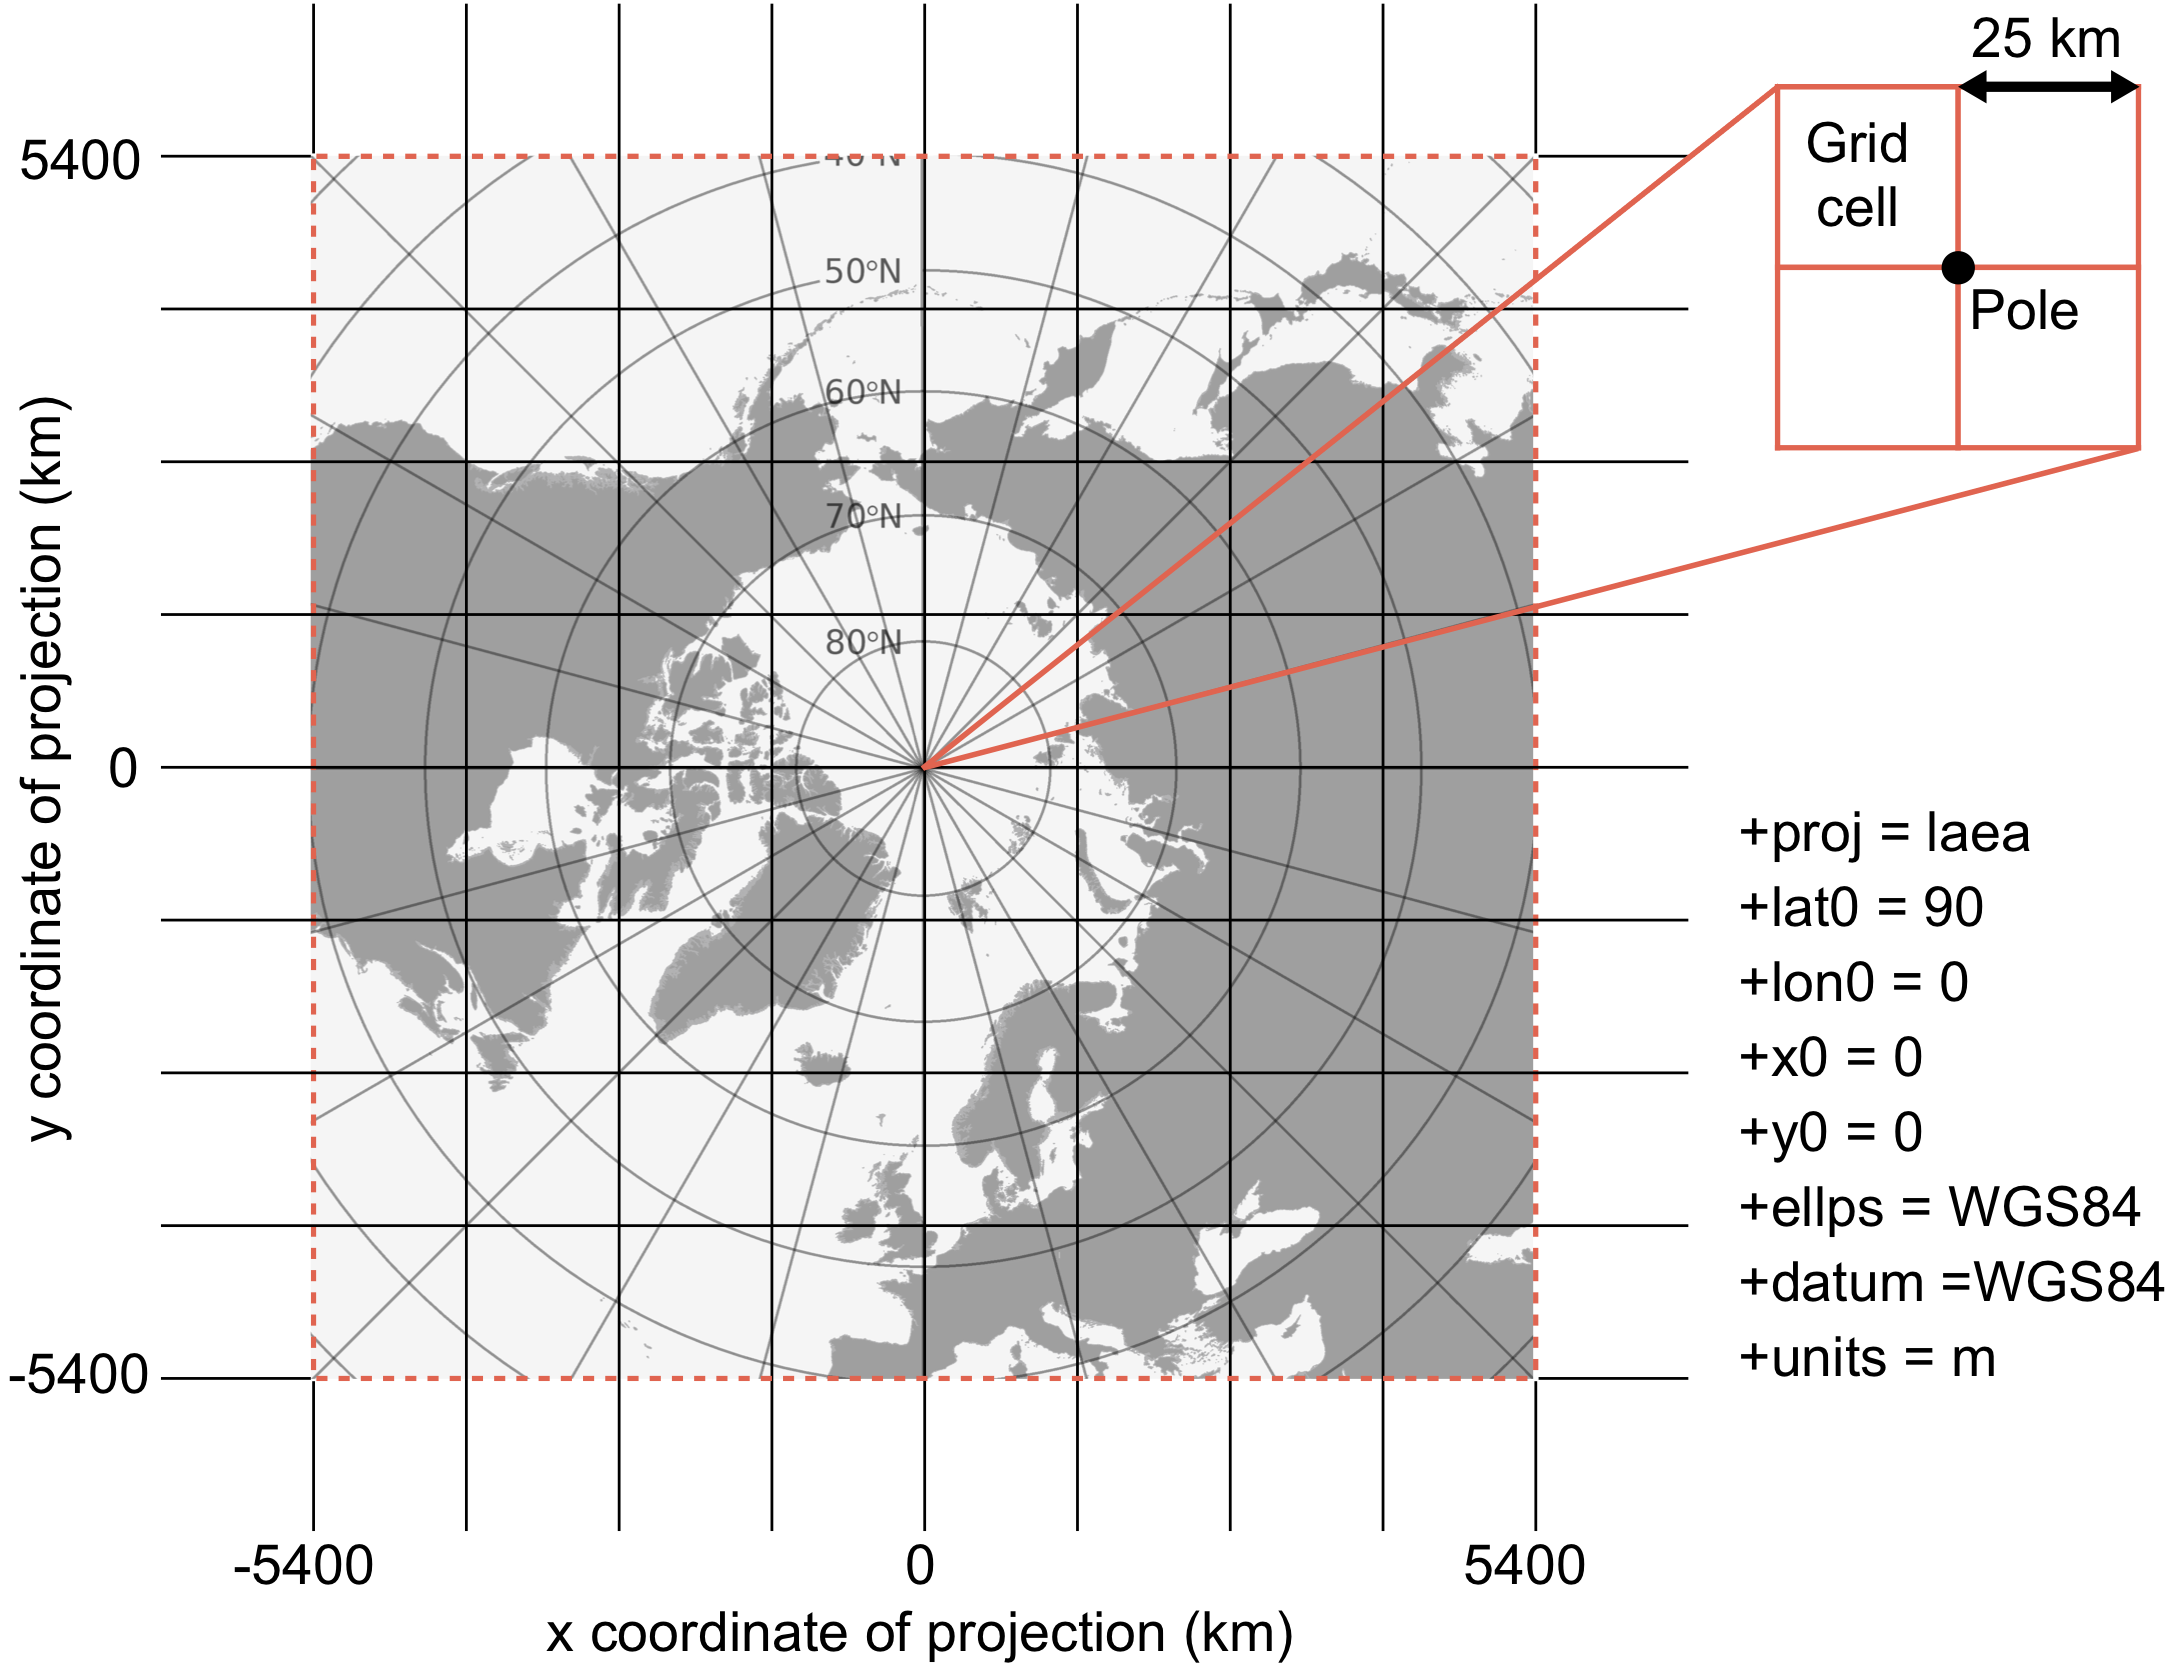
GridAll grids are projected onto the 25 km EASE2 Grid, which is based on a polar aspect spherical Lambert azimuthal equal-area projection (Brodzik et al., 2012). The grid dimension is 5400 km x 5400 km, equal to a 432 x 432 grid. The grid is centered on the geographic Pole, meaning that the Pole is located at the intersection of center cells (Figure 1).
|
| Panel | ||||||||
|---|---|---|---|---|---|---|---|---|
| ||||||||
LinksESA Websites: Visualization of NetCDF data: |
| Panel | ||||||||
|---|---|---|---|---|---|---|---|---|
| ||||||||
ContactLars Kaleschke Stefan HendricksFigure1: Specifications of the EASE2 25 km grid, which is used for the merged product. |