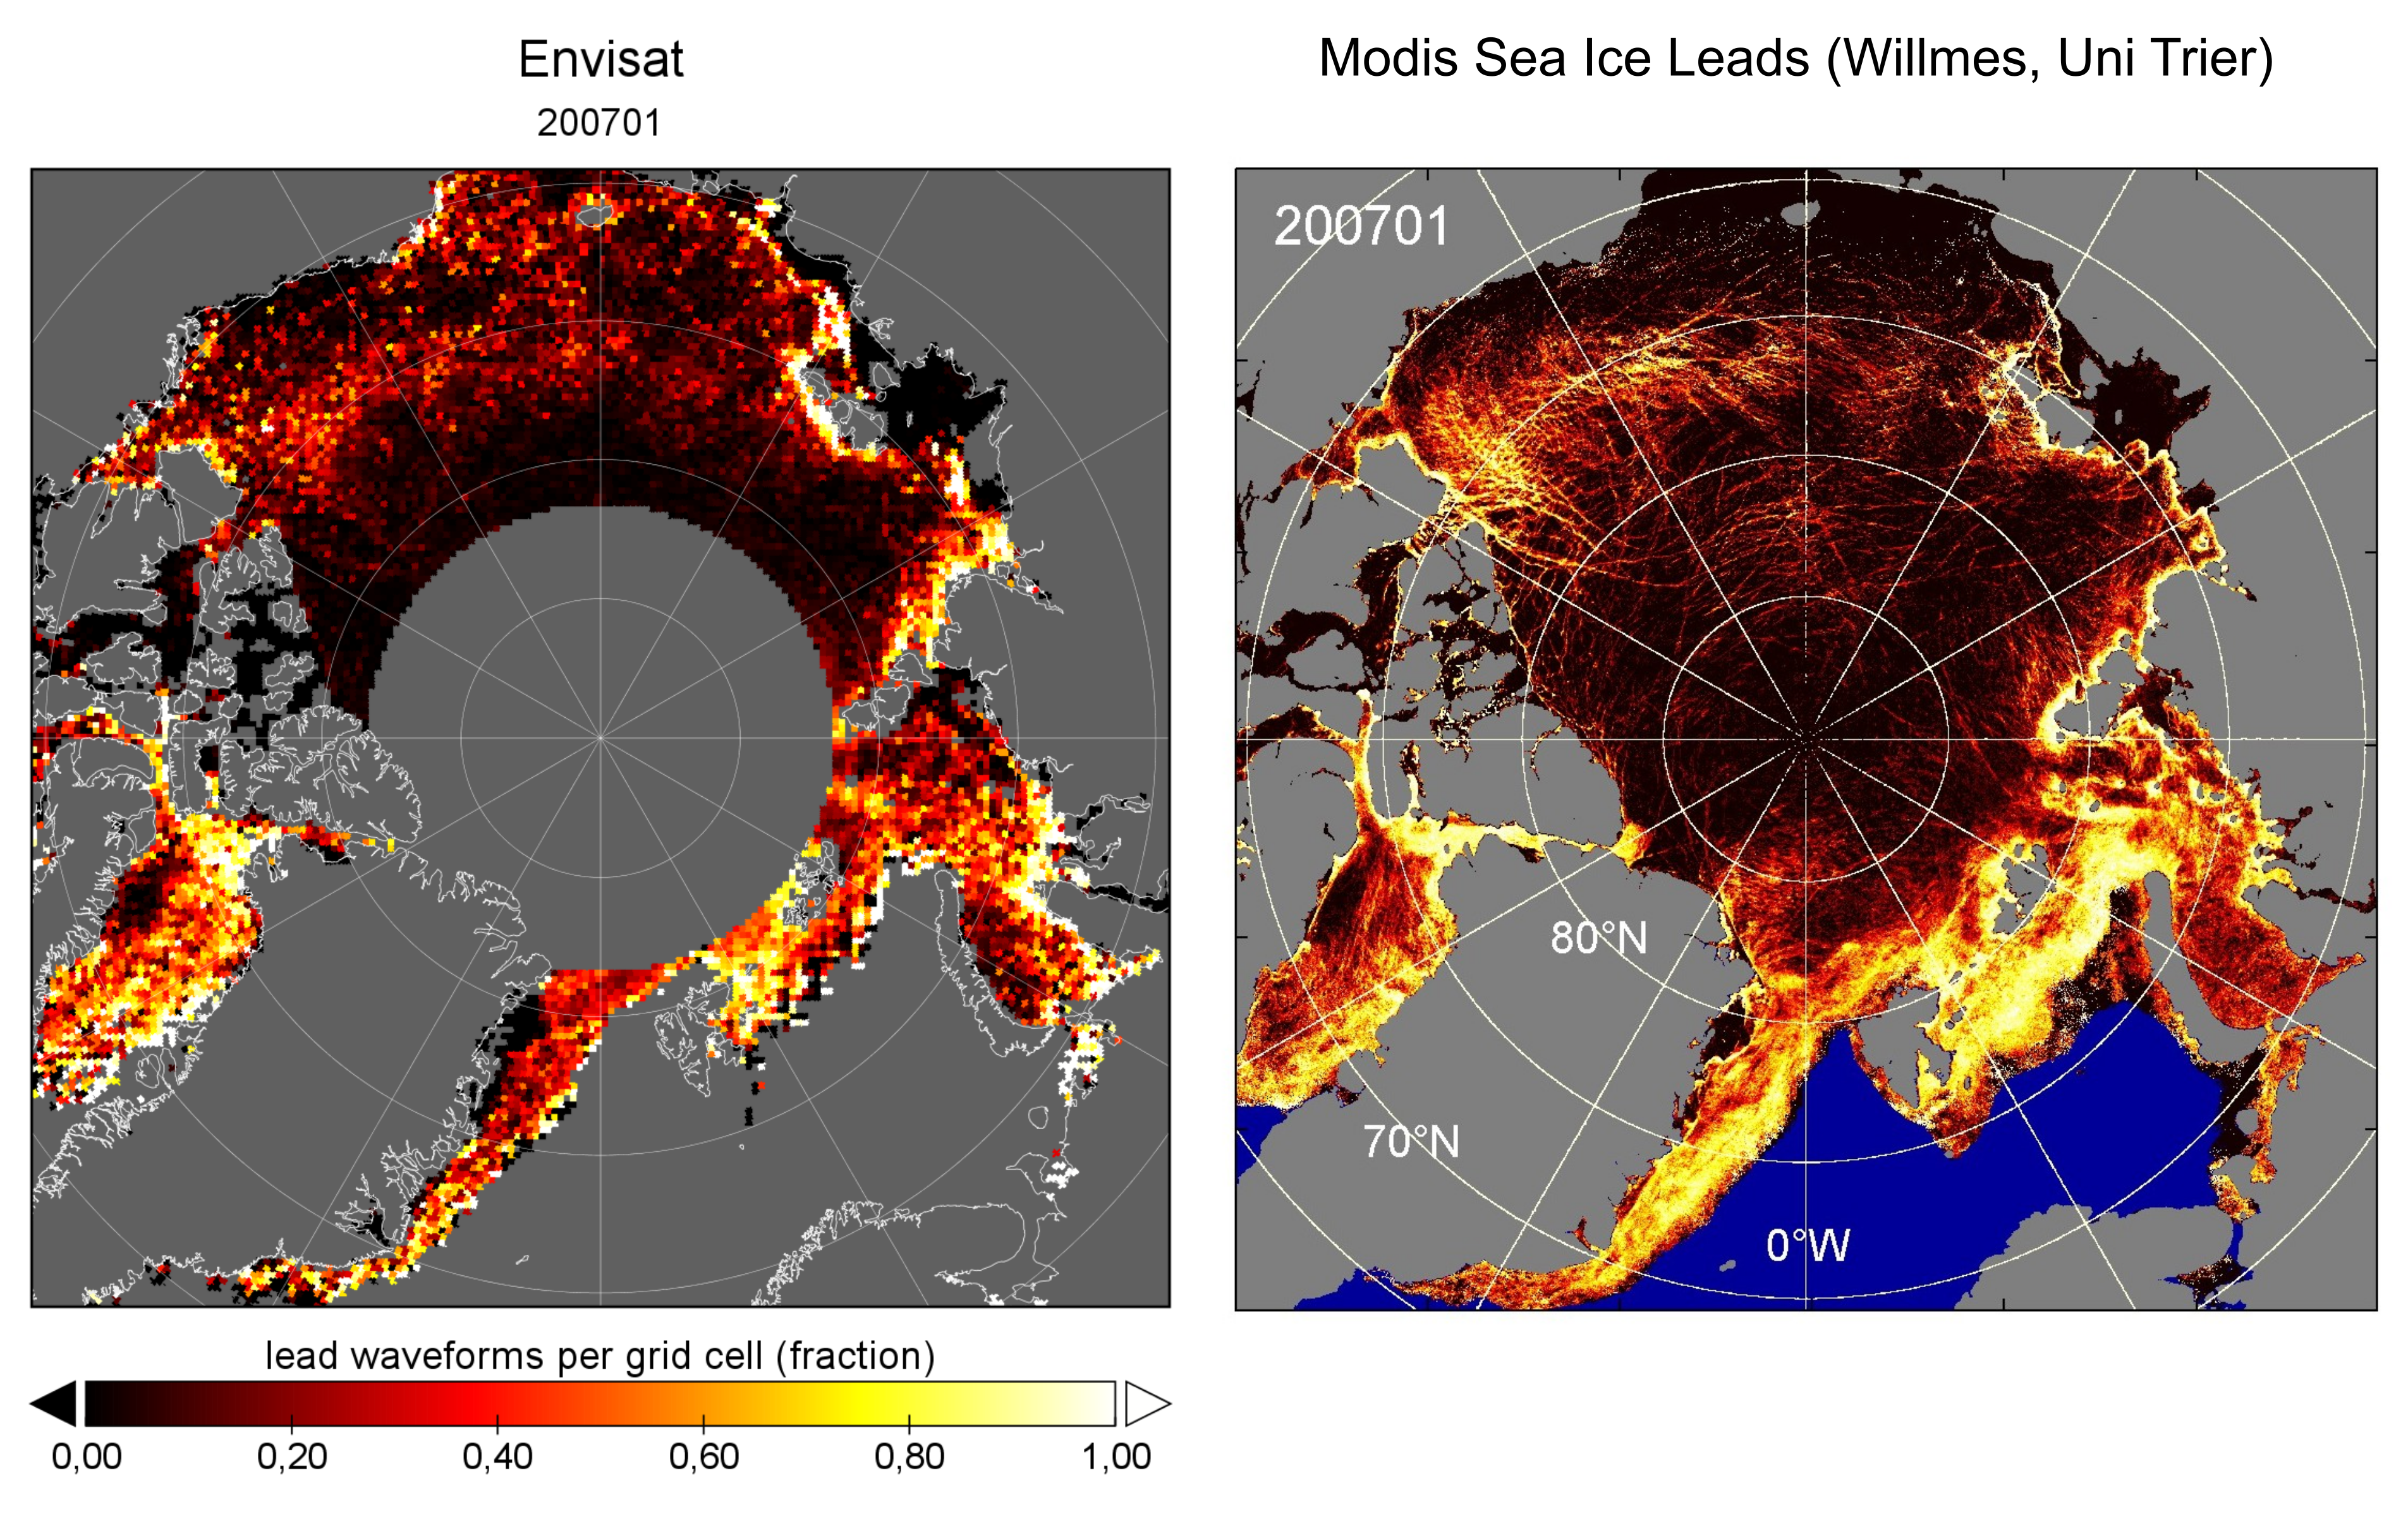
The detection of leads to estimate local sea surface height is one crucial step for remote sensing of sea ice thickness with radar altimetry. Algorithms that classify individual radar echoes into the category sea ice, lead, or mixed must return reliable results in all sea ice conditions. To verify the surface type classification algorithms, we use other observational sources as the Sea-ice lead detection in the Arctic from MODIS satellite imagery, 2013-2016 from the Univsersity of Trier.
Below one example of sea ice lead density in the Arctic from Envisat altimetry (left) and Modis (right) indicating a good regional agreement of lead detection with the two independent methods.
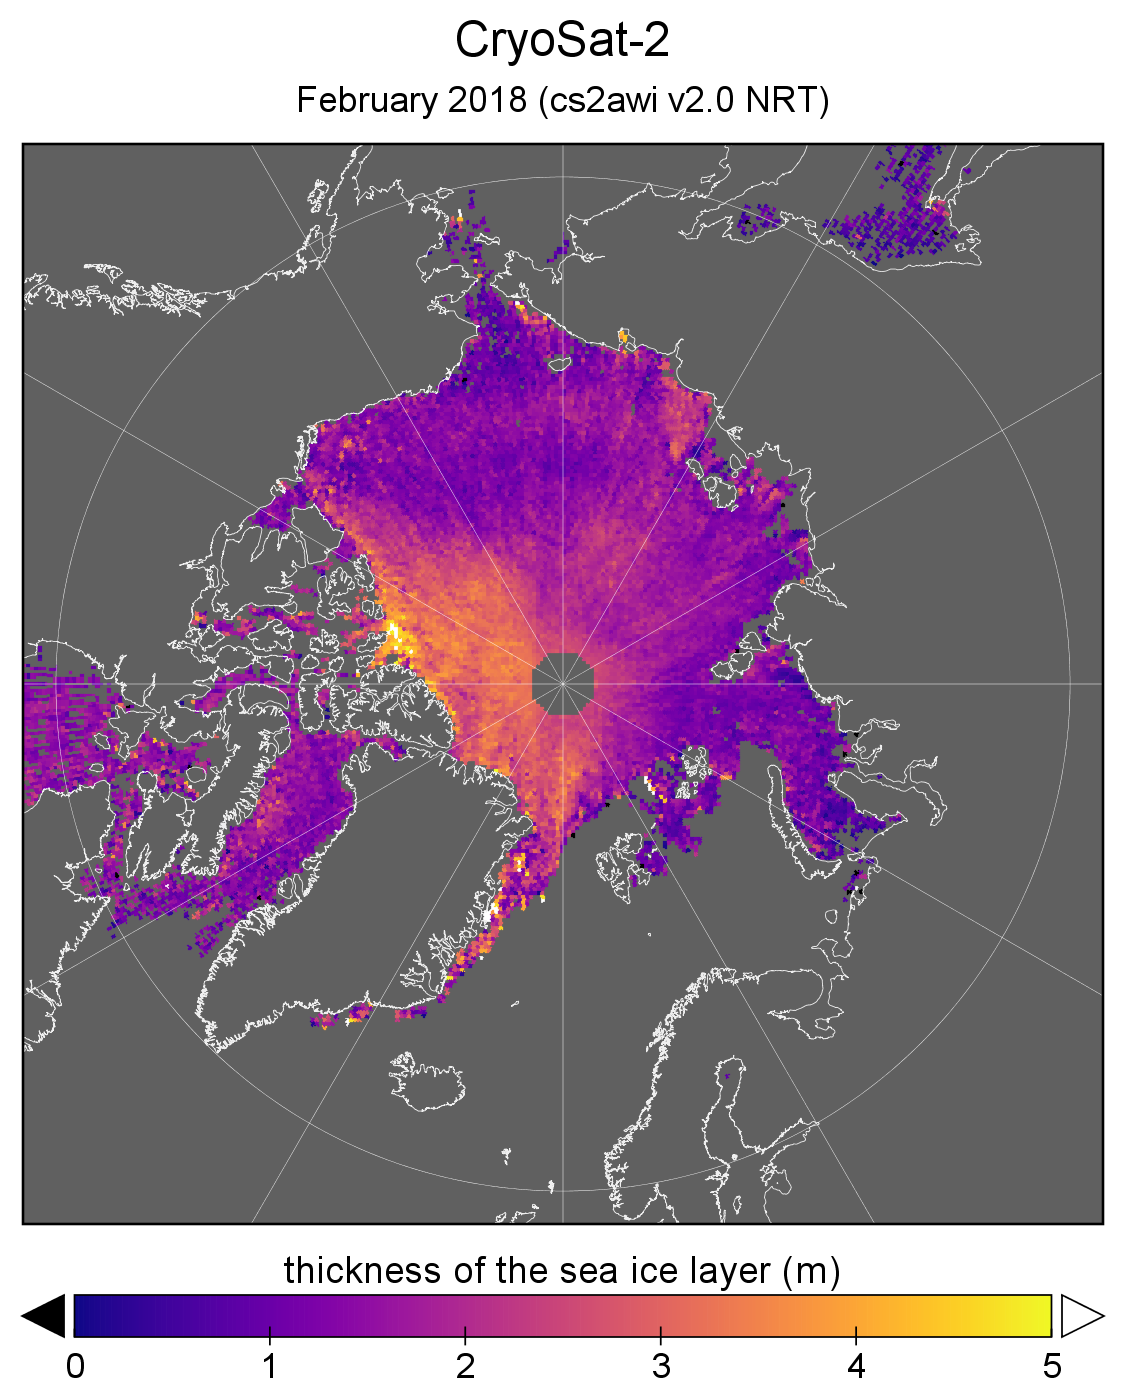
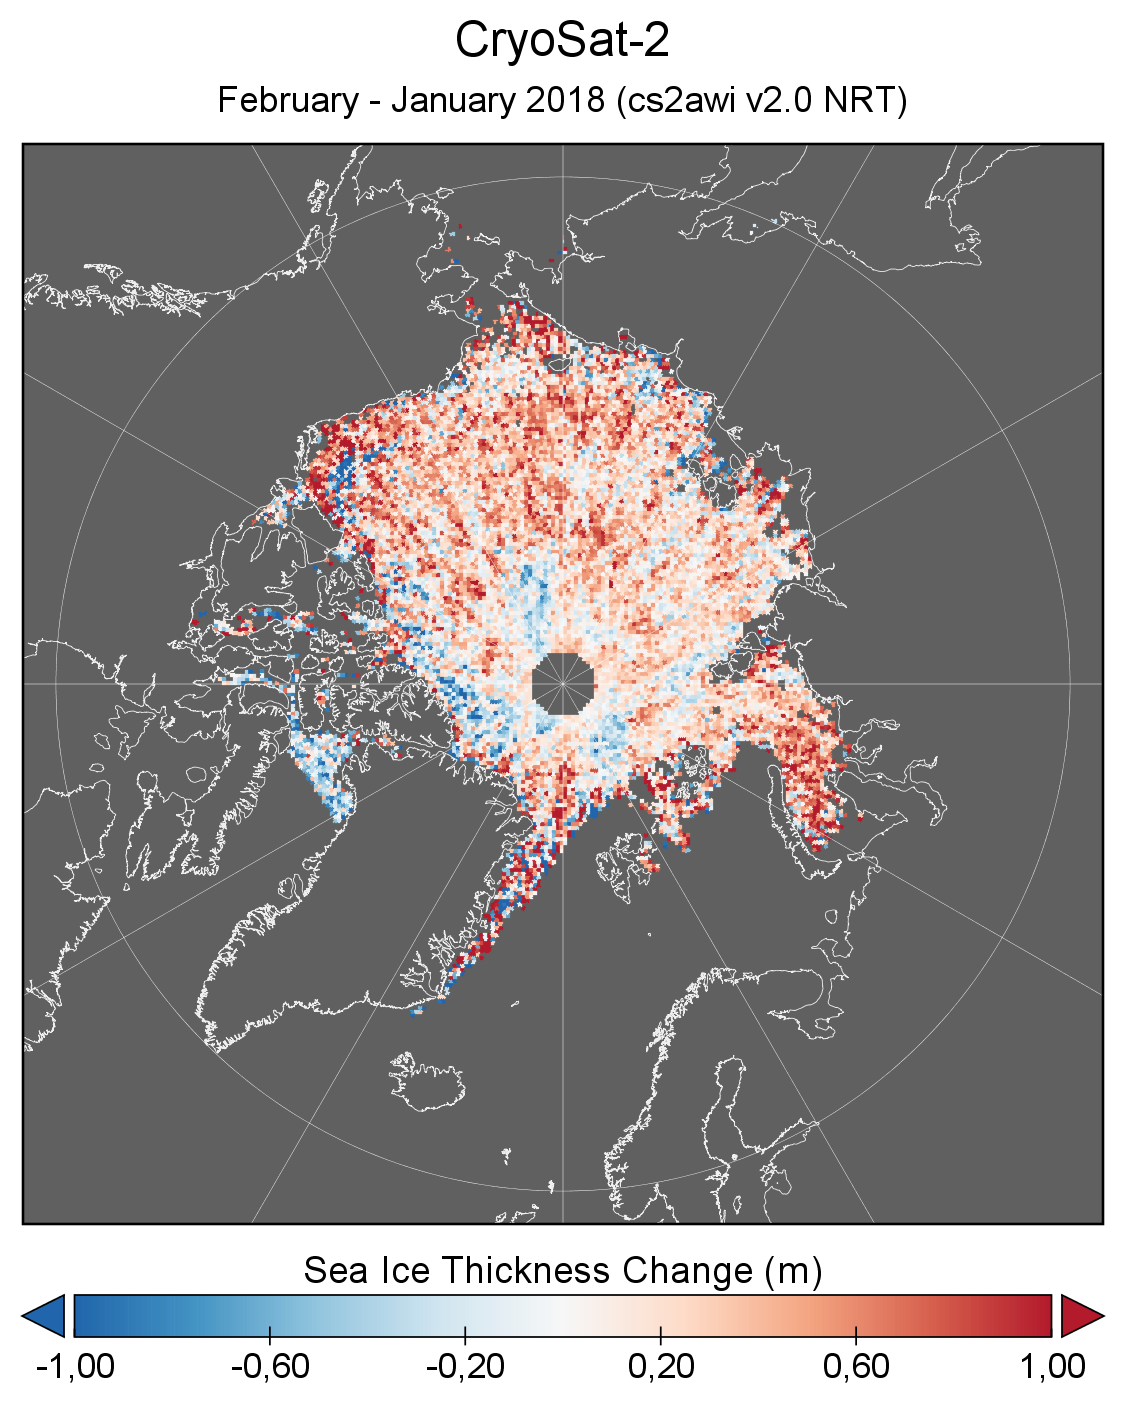
Arctic sea ice thickness information has been updated with NRT data for February 2018 and reprocessed data for January 2018. Daily, weekly and monthly products are available here: Reprocessed, Near-real time
")
Short Facts
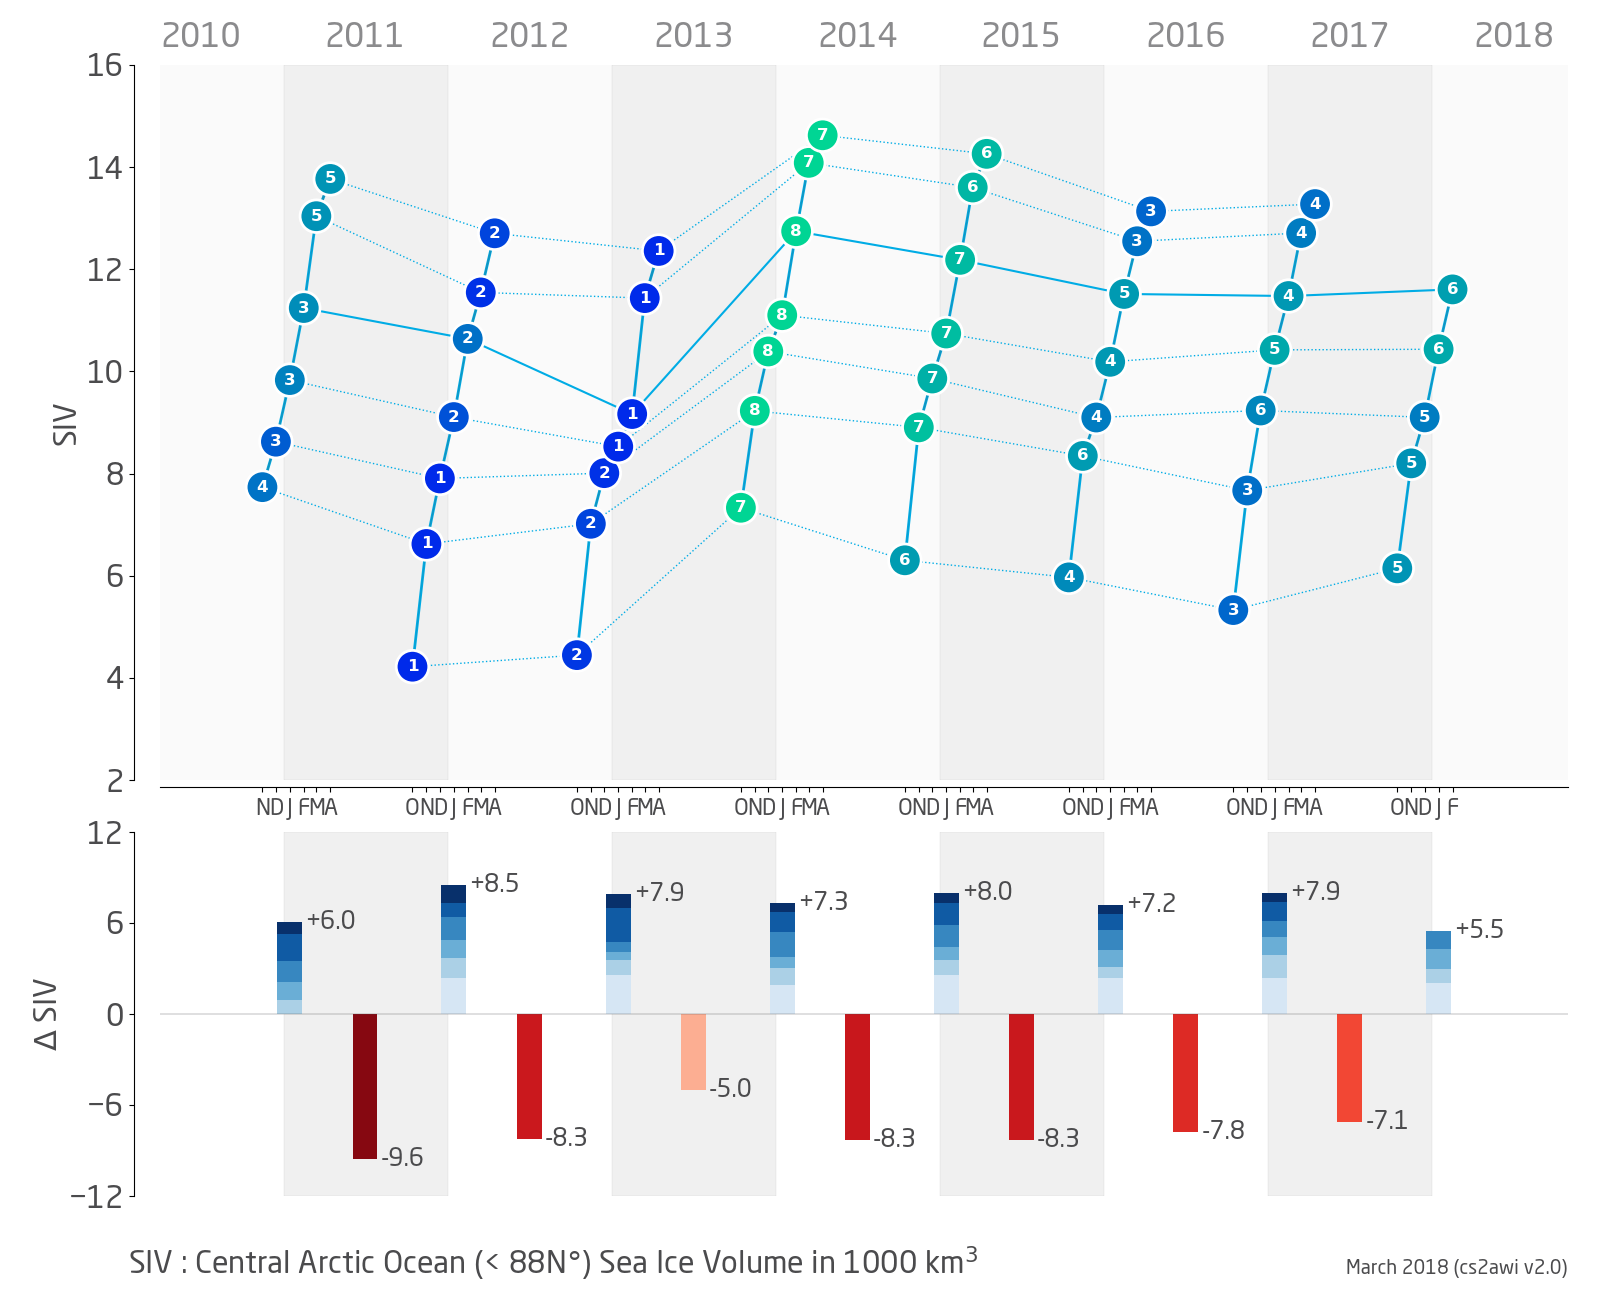
- February sea ice volume in the central Arctic was 6th lowest / 3rd highest in 8 years of CryoSat-2 observations: 11.61 • 103 km3
- highest: 12.75 • 103 km3 in Feb 2014
- lowest: 9.17 • 103 km3 in Feb 2013
- average: 11.32 • 103 km3
- February mean sea ice thickness in the central Arctic was 6th lowest / 3rd highest in 8 years of CryoSat-2 observations: 1.89 m
- highest: 2.07 m in Feb 2014
- lowest: 1.51 m in Feb 2013 (potential retrieval anomaly, under investigation)
- average: 1.85 m
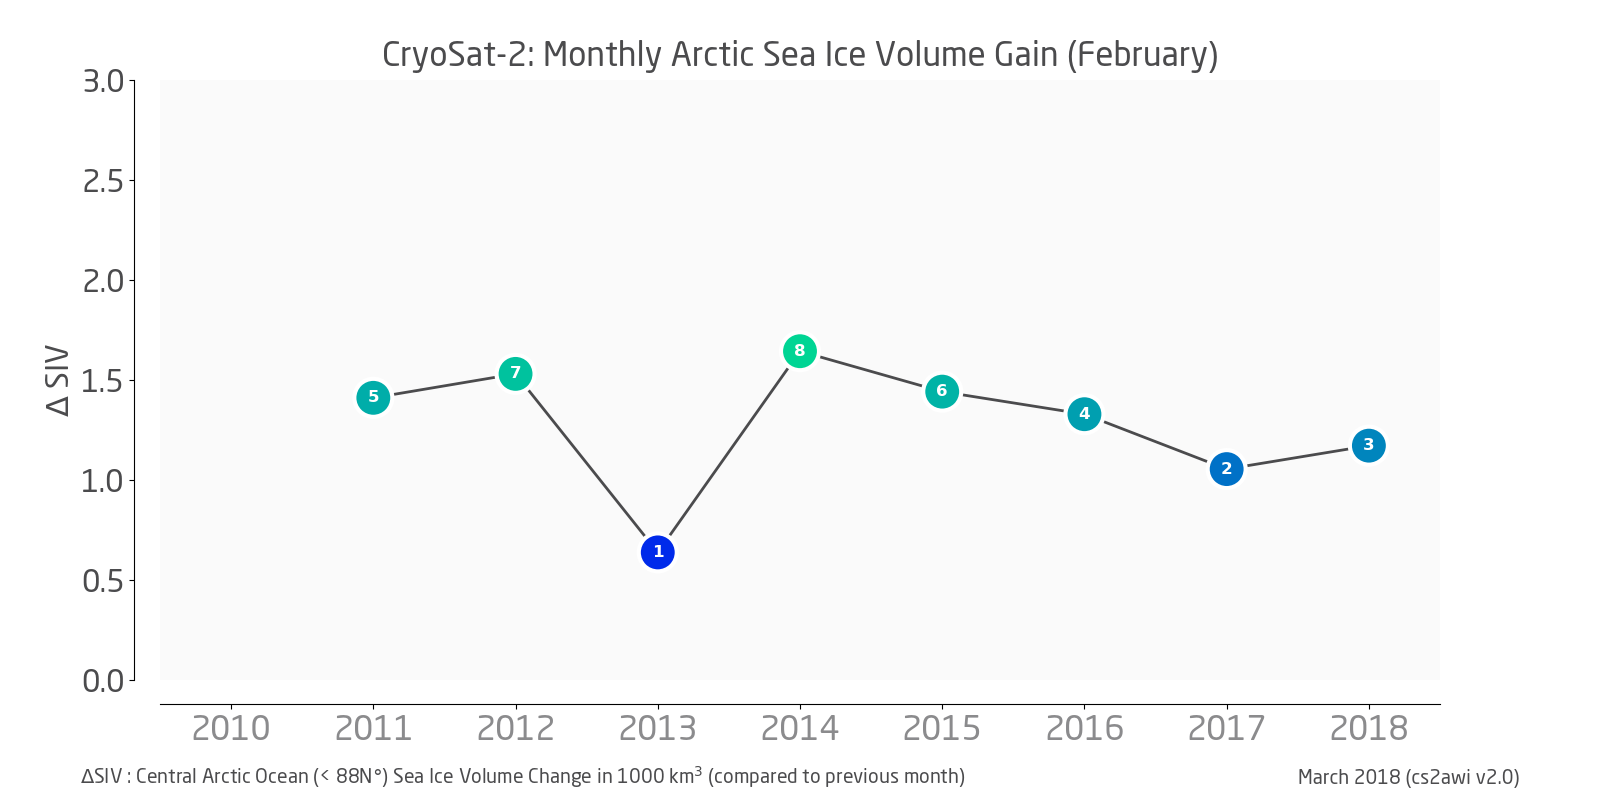
- Monthly sea ice volume gain (January through February) was 3rd lowest / 6th highest in 8 years of CryoSat-2 observations: +1.17 • 103 km3
- highest: +1.64 • 103 km3 in Feb 2014 (potential retrieval anomaly, under investigation)
- lowest: +0.64 • 103 km3 in Feb 2013 (potential retrieval anomaly, under investigation)
- average: +1.28 • 103 km3
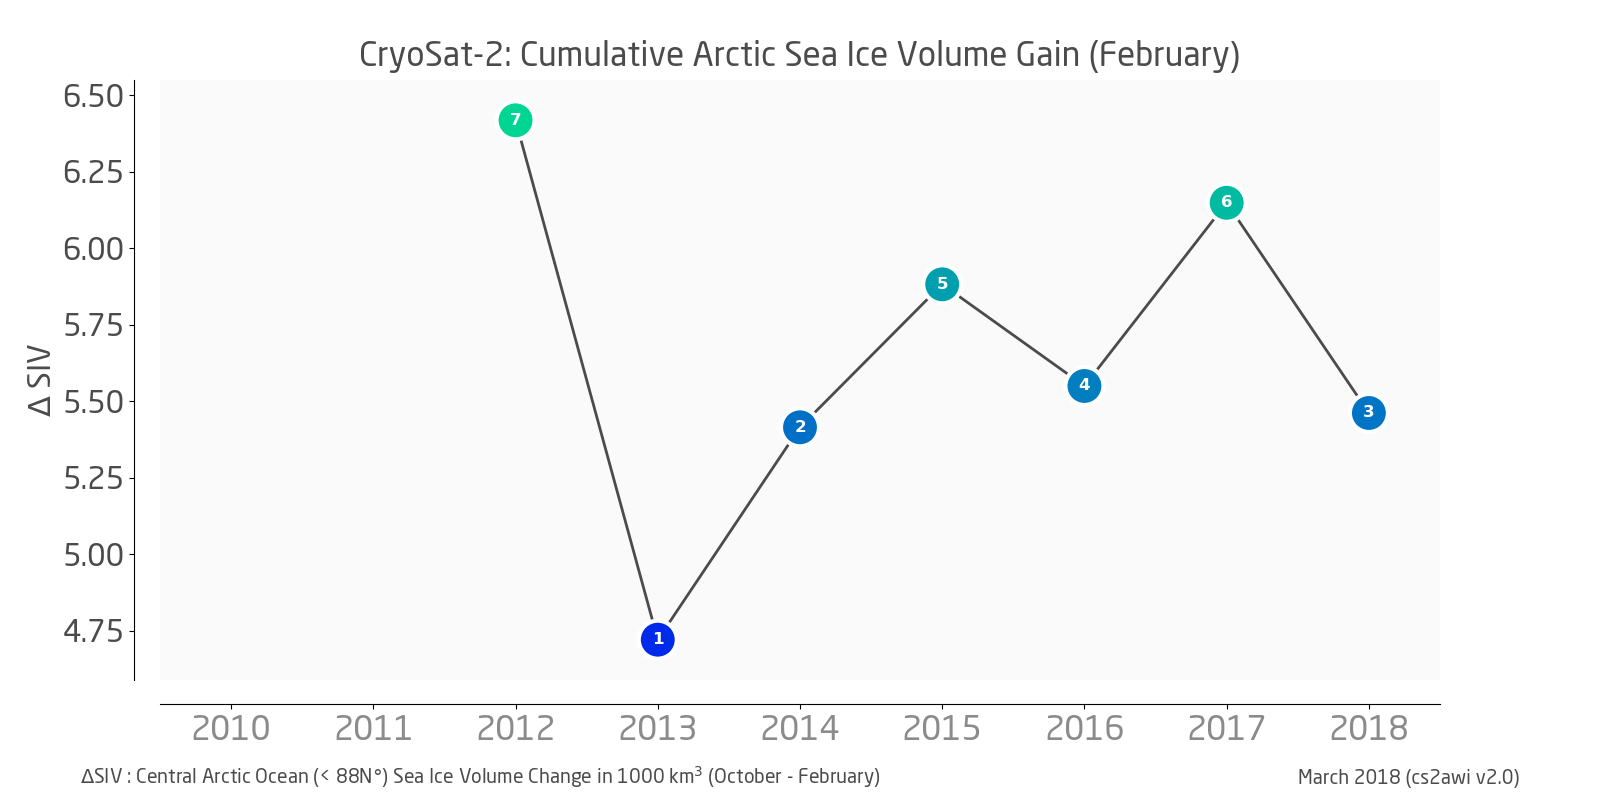
- Cummulative sea ice volume gain (October through February) was 3rd lowest / 6th highest in 8 years of CryoSat-2 observations: +5.46 • 103 km3
- highest: +6.42 • 103 km3 in Feb 2012
- lowest: +4.72 • 103 km3 in Fev 2013 (potential retrieval anomaly, under investigation)
- average: +5.66 • 103 km3