Near-realtime visualisation "DSHIP MapViewer"
MapViewer is a web-mapping tool on board of RV Polarstern which enables users to visualize sea ice information e.g. from satellites and models in relation to ship based data such as tracks, stations and waypoints. Data are made available from different providers in near-real time. The tool is browser-based and can be used on any connected PC/notebook/tablet. User data such as GeoTIFFs can be easily integrated on short notice. Please contact o2a-support@awi.de / team Data Logistics Support at Data Centre for any MapViewer related requests.
Available data products
The following data products are generally available onboard or, in some cases, need to be ordered before your expedition.
| Example Image | Name | Category | Description | Availability / Order Procedure | Data Provider | Responsible Contact |
|---|---|---|---|---|---|---|
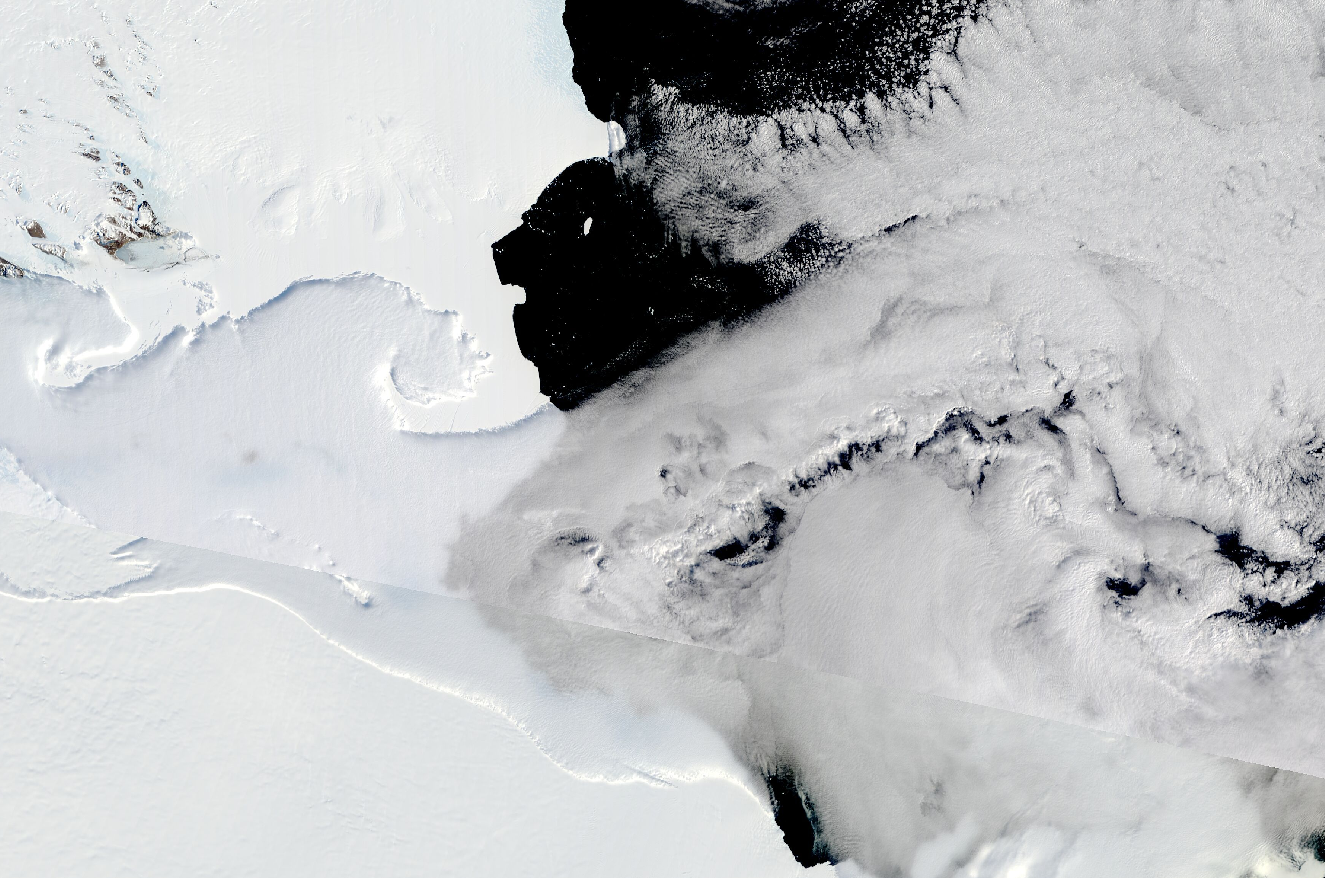
| Modis Terra | Satellite / Hyperspectral Imaging | Parameter: Surface reflectance (visible light) Resolution: 250 m Update interval: Daily Regions: Antarctic and Arctic, tiles decided by cruise leader / captain The Moderate Resolution Imaging Spectroradiometer (MODIS) is a satellite-based sensor used for earth and climate measurements. There are two MODIS sensors in Earth orbit: one on board the Terra (EOS AM) satellite, launched by NASA in 1999; and one on board the Aqua (EOS PM) satellite, launched in 2002. With its high temporal resolution although low spatial resolution, MODIS data are useful to track changes in the sea ice coverage over time. Daily updates are provided in tiles covering the research area and neighboring regions. |  Always active Always active | Drift Noise GmbH (support@driftnoise.com) | |
| EDEN - Optical | Satellite / Hyperspectral Imaging | Parameter: Surface Reflectance (visible light) Resolution: See MODIS layer Update Interval: 5 minutes Regions: Centered around Polarstern The EDEN Optical layer shows sea ice drift-corrected optical satellite imagery. Factoring in the constant movement of the ice, the layer aims at visualizing the current, true position of surrounding sea ice. The sea ice drift is estimated using the best available of the following methods: Nearby buoys, image matching from ice radar images and estimating the drift from on-board wind measurements. The calculated translation shift is then applied to a recent satellite image. |
| ||
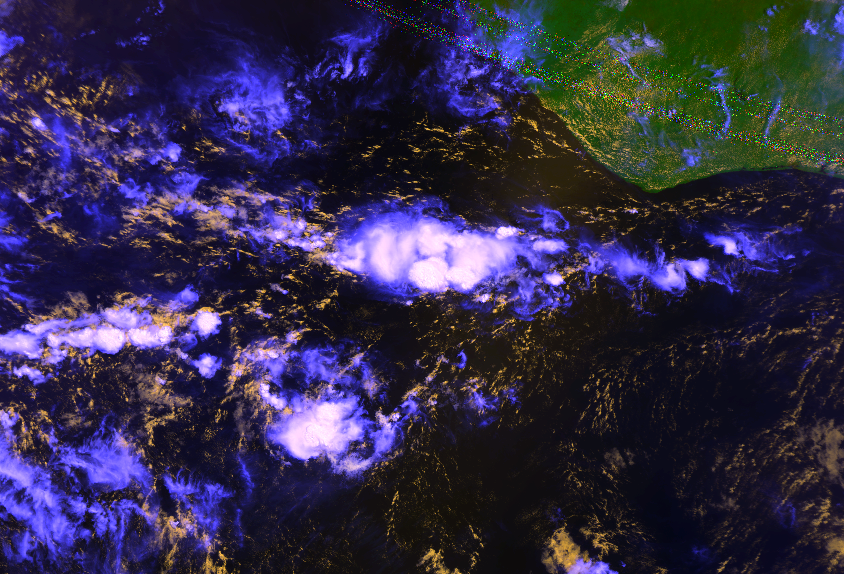
| HRPT | Satellite / Hyperspectral Imaging | Parameter: Optic camera Resolution: ~1.1 km Update interval: Multiple satellite passes per day | Always active | Polarstern onboard system | AWI Vessel Coordination (schiffskoord@awi.de) |
| Sea Ice Drift (9-day forecast) | Model | Parameter: Sea ice drift Resolution: ~100km, daily Update interval: daily Regions: Global The sea ice drift layer visualizes the forecasted ice drift over a period of nine days. Arctic forecasts are based on the neXtSIM sea ice model (Link Copernicus) while Antarctic forecasts are based on the Mercator ocean model (Link Copernicus). | Always active | Drift Noise GmbH (support@driftnoise.com) | |
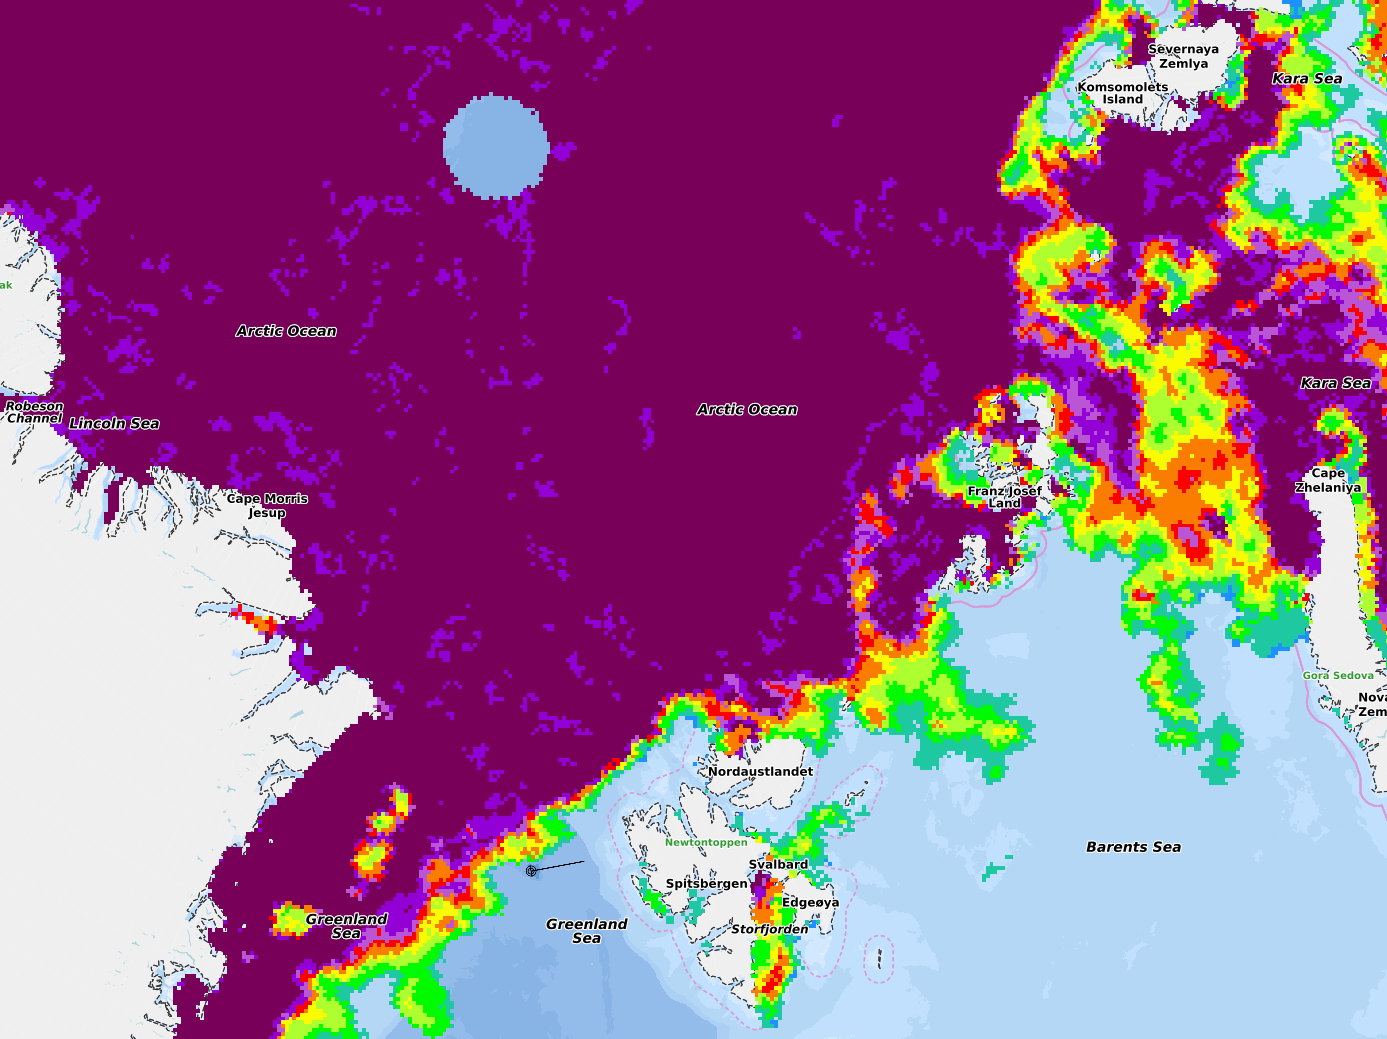
| Sea Ice Concentration from GCOM W1 AMSR2 | Satellite / Sea Ice Concentration | Parameter: Sea Ice Concentration Resolution: 3 km Update interval: Multiples per day Regions: Antarctic and Arctic Sea ice concentration images for the Arctic and Antarctic are generated hourly from the 3 km spatial resolution AMSR2 data. A running composite is a combination of multiple swaths of data; the latest swath extends the data of the previous composite image. Please be aware that sea ice concentrations of 10% and less can not be confidently characterized by the sensor/algorithm. This product thus might show "no ice" where there is still some ice. | Always active | Drift Noise GmbH (support@driftnoise.com) Algorithm by University of Bremen: | |
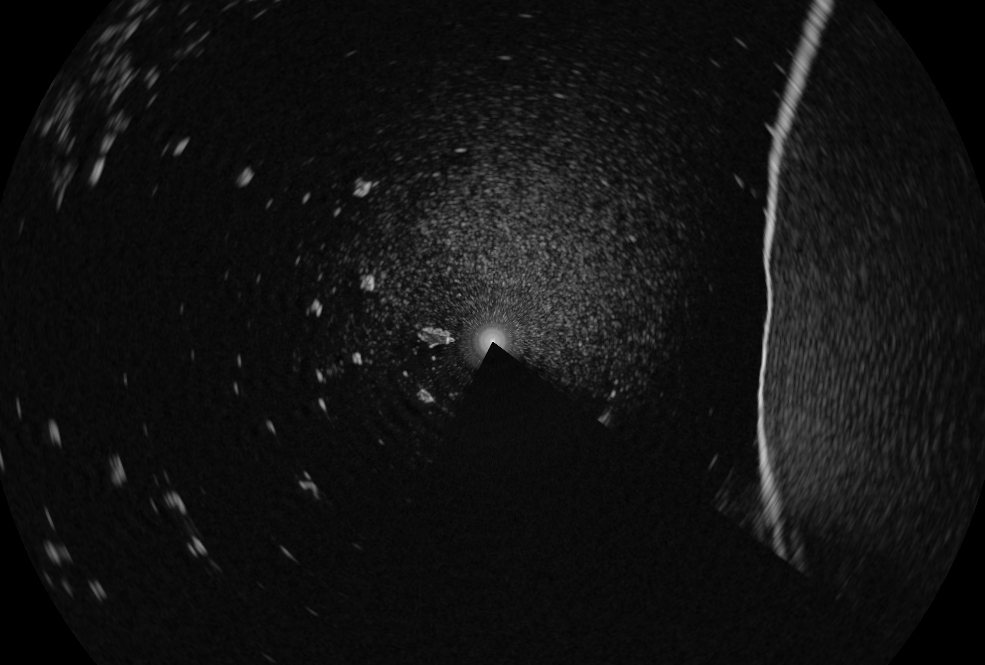
| Sigma S6 Ice Radar | Shipboard Radar / Sea Ice | Parameter: Radar Update interval: 5 minutes A X-band radar manufactured by Rutter Inc. is a fixed device onboard of the Polarstern. The highly resolved radar images around the ship body are used for navigation purposes and can also be visualized as a layer in the MapViewer charting system for additional information of the users. | | Polarstern onboard system | AWI Vessel Coordination (schiffskoord@awi.de) |
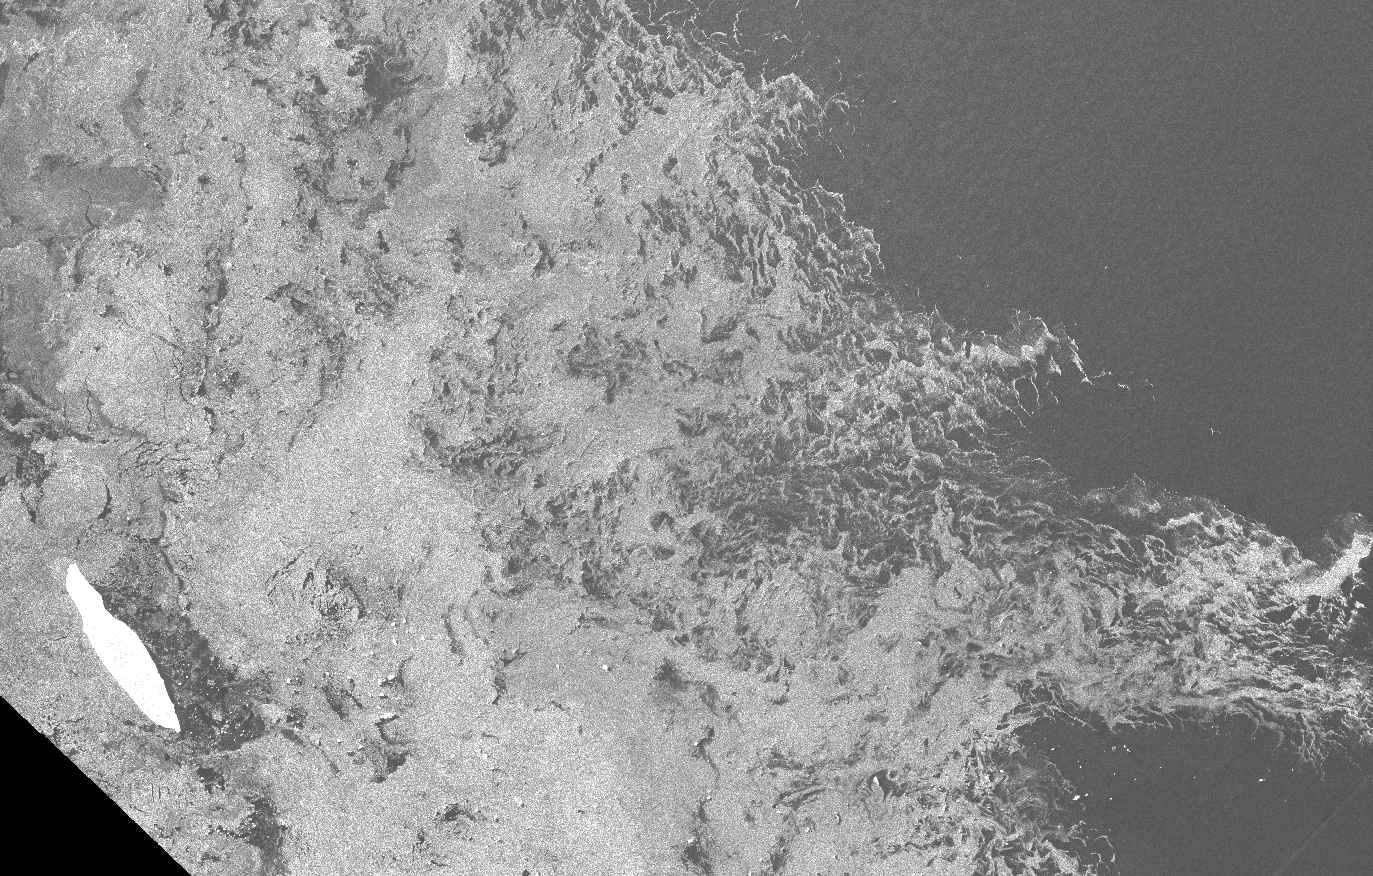
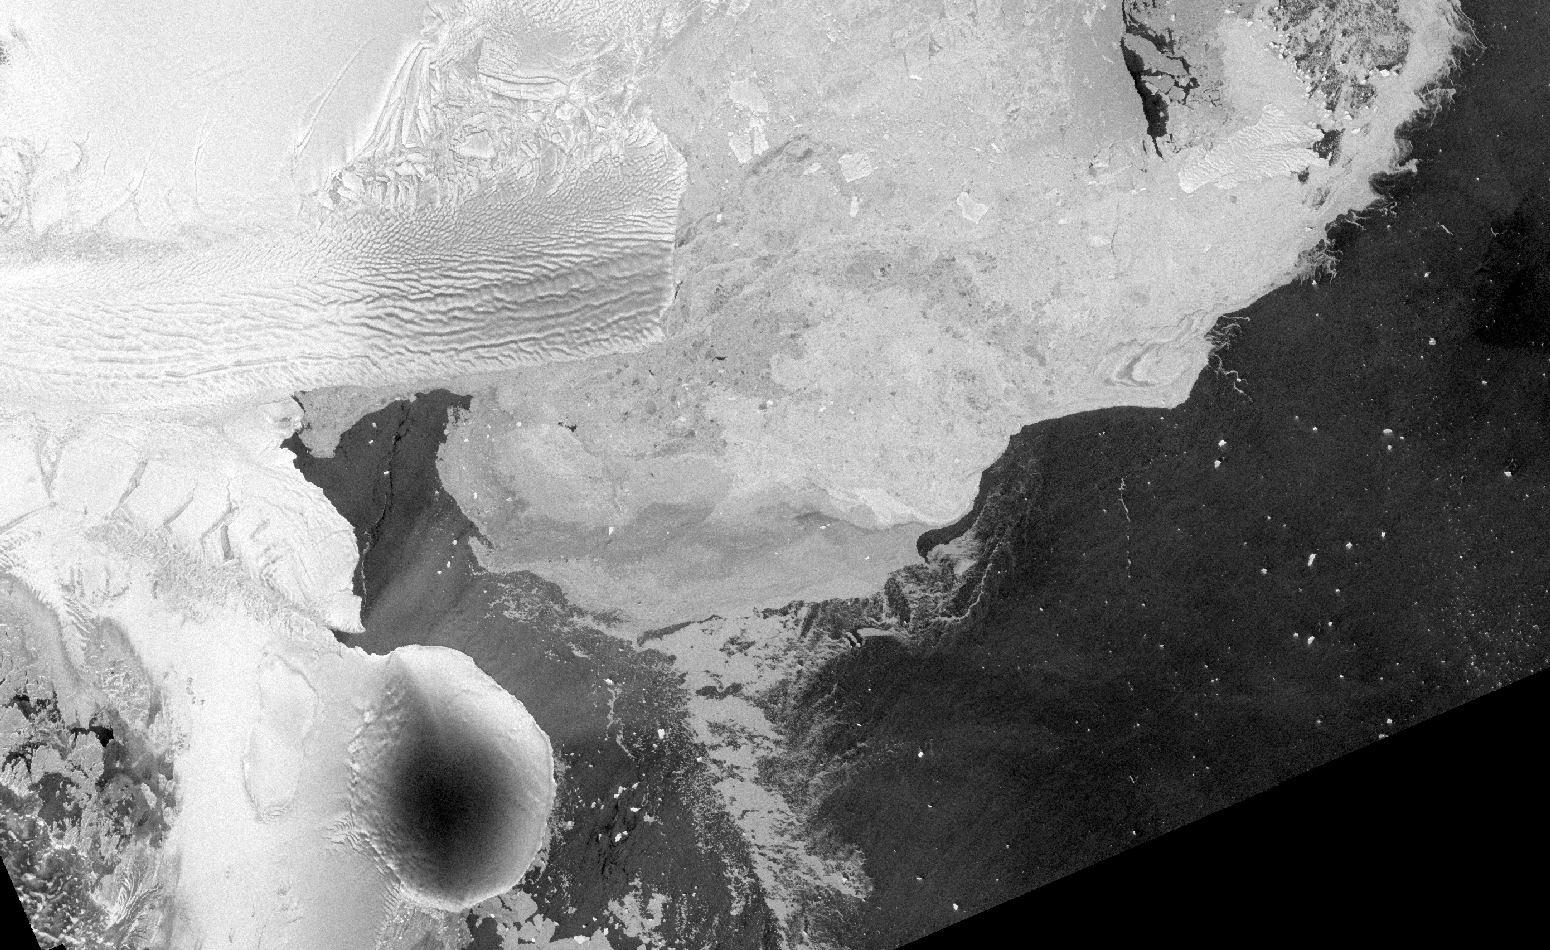
| RCM (RADARSAT Constellation Mission) | Satellite / Radar | Parameter: Radar backscatter, C-band Resolution: >= 30 m Update interval: < weekly Regions:
The RADARSAT Constellation Mission (RCM) is a three-spacecraft fleet of Earth observation satellites operated by the Canadian Space Agency. A key SAR capability is to be able to 'look' through clouds and produce images centered around surface characteristics like roughness. The primary goal of RCM is to provide continuous C-band SAR data with a higher frequent area coverage especially in the Arctic. Apart from the centered images, new scenes are also available as regularly spaced tiles to allow for a coverage beyond Polarstern's position. |
| Drift Noise GmbH (support@driftnoise.com) Original data source: | |
| Sentinel 1 SAR | Satellite / Radar | Parameter: Radar backscatter, C-band Resolution: 30 m Update interval: < weekly Regions:
The Sentinel-1 ESA mission comprises a constellation of two polar-orbiting satellites, operating day and night performing C-band synthetic aperture radar imaging, enabling them to acquire imagery independent of cloud coverage. Sentinel-1 works in a pre-programmed operation mode to avoid conflicts and to produce a consistent long-term data archive built for applications based on long time series. If new scenes are available, images are centered around the ship and sent on board. |
| Drift Noise GmbH (support@driftnoise.com) Original data: | |
| EDEN - Sentinel 1 | Satellite / Radar | Parameter: Radar backscatter, C-band Resolution: See original S1/RCM layer Update Interval: 5 minutes Regions: Centered around Polarstern The EDEN Sentinel-1 / RCM layer shows sea ice drift-corrected Sentinel-1 or RCM SAR imagery. Factoring in the constant movement of the ice, the layer aims at visualizing the current, true position of surrounding sea ice. The sea ice drift is estimated using the best available of the following methods: Nearby buoys, image matching from ice radar images and estimating the drift from on-board wind measurements. The calculated translation shift is then applied to a recent satellite image. |
| ||
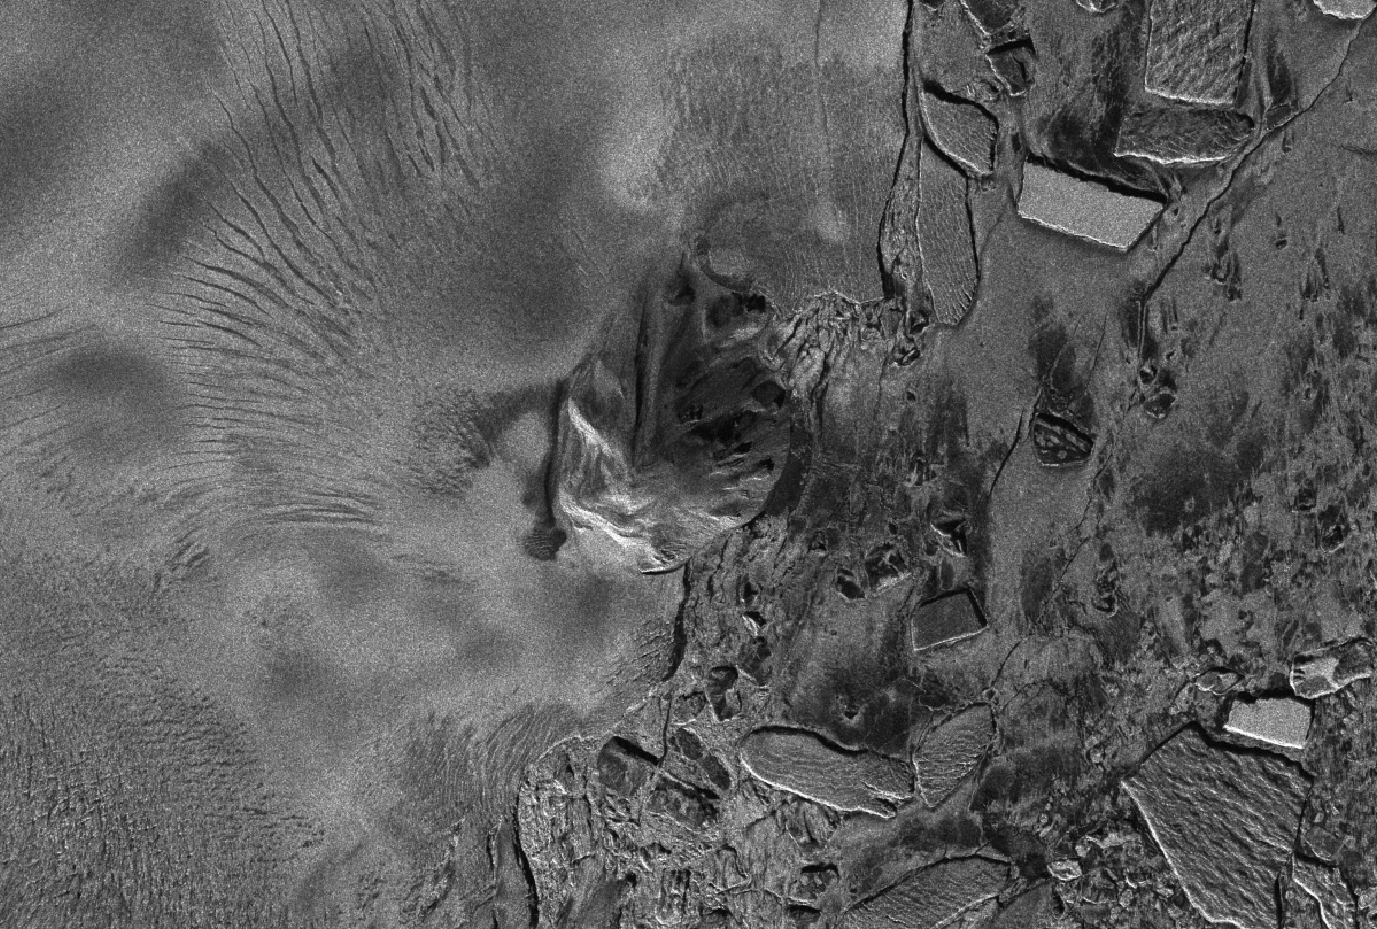
| TerraSAR-X | Satellite / SAR | Parameter: Radar backscatter, X-band Resolution: Mode-dependet, typically 30-40 m, best 13 m. Update interval: < weekly Regions: As ordered TerraSAR-X images are high-resolution radar satellite data from polar orbiting satellites, operating day and night with a X-band synthetic aperture radar. The images are taken upon request that needs to be placed by the expedition leader no later than 17 hours before the requested time. After recording, the data are downloaded by the next possible down link to the receiving station. After the reception of the data, the images are pre-processed and compacted to a zip-file with a size of max. 2 MB. The zip-file contains a georeferenced png (only usable for GIS when the related xml and wld is in the same folder) and is send via email or ftp download link to the expedition leader and the MapView pull software. Mean delivery delay is between 30 min and 2 hours. Images from the German TerraSAR-X satellite are distributed commercially and are restricted to license agreements between the user and the German Aerospace Center (DLR). AWI has signed a license agreement for images requested for the voyages against the background to support a smooth operation. |
In best case mention it in expedition coordination meeting. | DLR https://www.dlr.de/de/forschung-und-transfer/projekte-und-missionen/terrasar-x | AWI Vessel Coordination (schiffskoord@awi.de) |
| EDEN - TerraSAR-X | Satellite / SAR | Parameter: Radar backscatter, C-band Resolution: See original TerraSAR-X layer Update Interval: 5 minutes Regions: Centered around Polarstern The EDEN TerraSAR-X layer shows sea ice drift-corrected TerraSAR-X SAR imagery. Factoring in the constant movement of the ice, the layer aims at visualizing the current, true position of surrounding sea ice. The sea ice drift is estimated using the best available of the following methods: Nearby buoys, image matching from ice radar images and estimating the drift from on-board wind measurements. The calculated translation shift is then applied to a recent satellite image. |
| ||
| Chlorophyll | Satellite / Hyperspectral Imaging | Parameter: Chlorophyll concentration Processing: L4 NRT, gapfree Resolution: 4x4 km Update interval: Daily | Always available | Met Office (UK) via Copernicus Original data: | AWI Data Centre / Data Logistics Support |
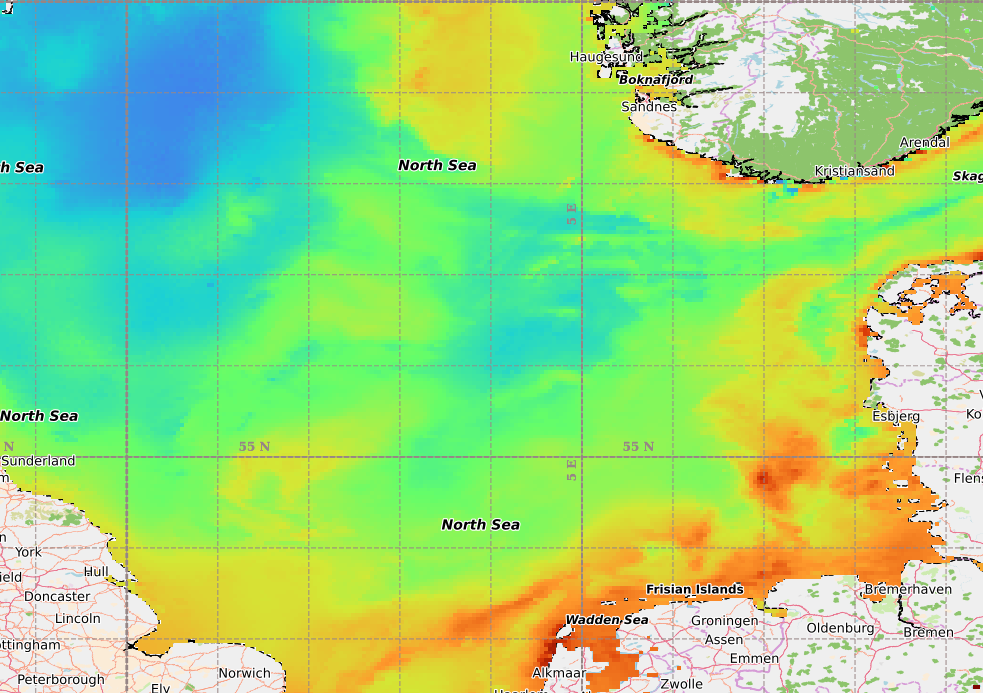
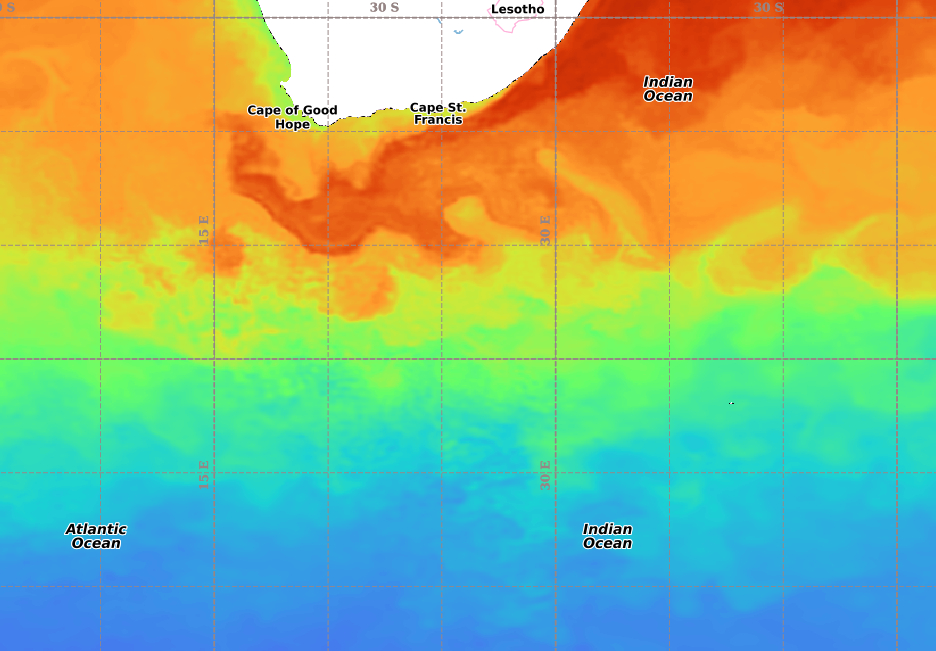
| Sea Surface Temperature | Satellite / Hyperspectral Imaging | Parameter: Analysed Sea Surface Temperature Processing: L4 merge of various satellite systems Resolution: 0.05° × 0.05° Update interval: Daily, 12:00 UTC | Always available | ACRI (France) via Copernicus Original data: | AWI Data Centre / Data Logistics Support |
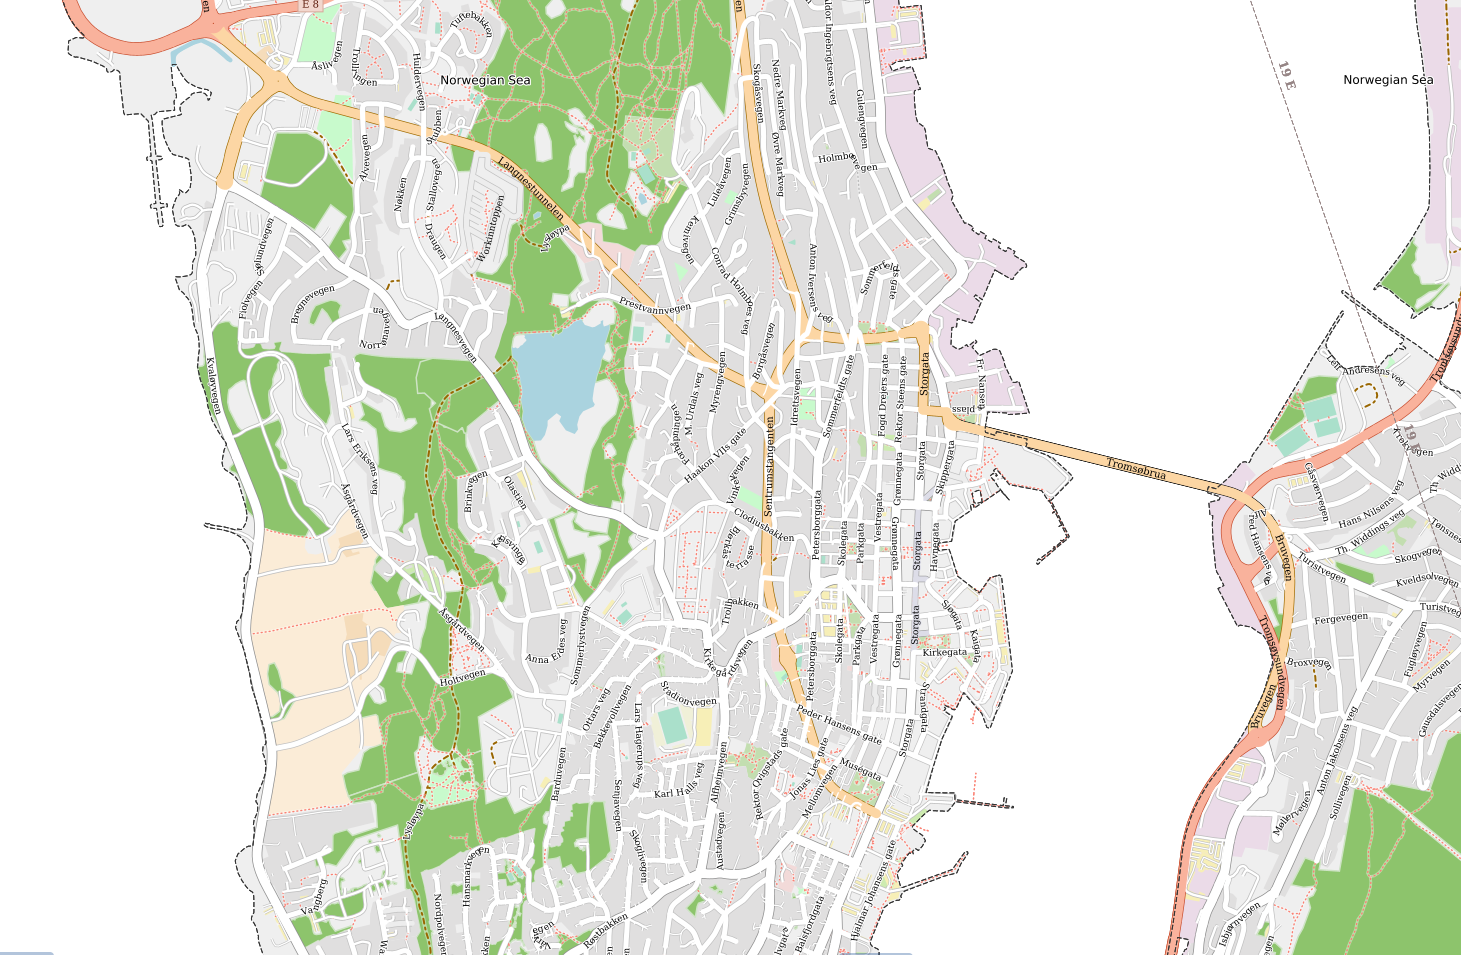
| Open Street Map | Coastlines | Parameter: Vector coastlines Update interval: No periodical updates. Regions: Global |
| Werum Software & Systems AG, original data from https://www.openstreetmap.org/ | AWI Data Centre / Data Logistics Support |
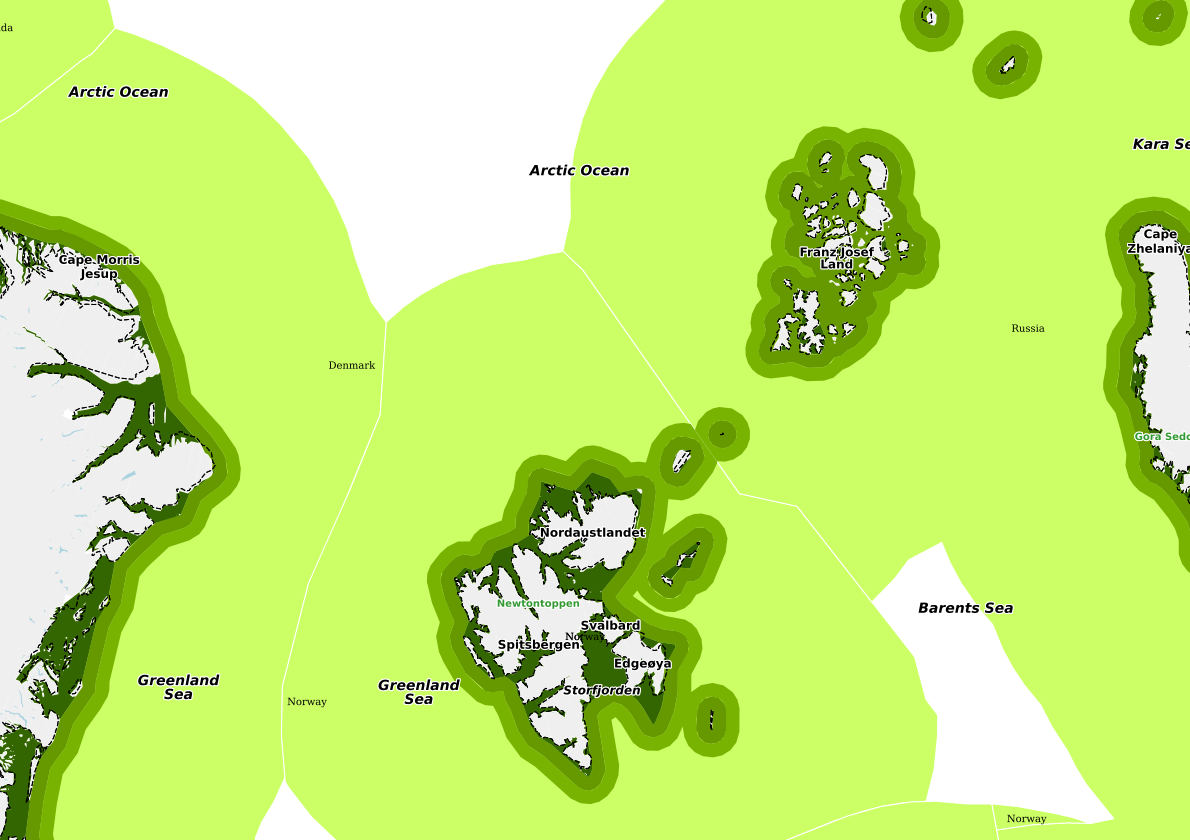
| Marine Regions | Maritime Boundaries | Parameter:
Version: v11 (2019) Update interval: No periodical updates. |
| Original data: Marine Regions (https://doi.org/10.14284/386) | AWI Data Centre / Data Logistics Support |
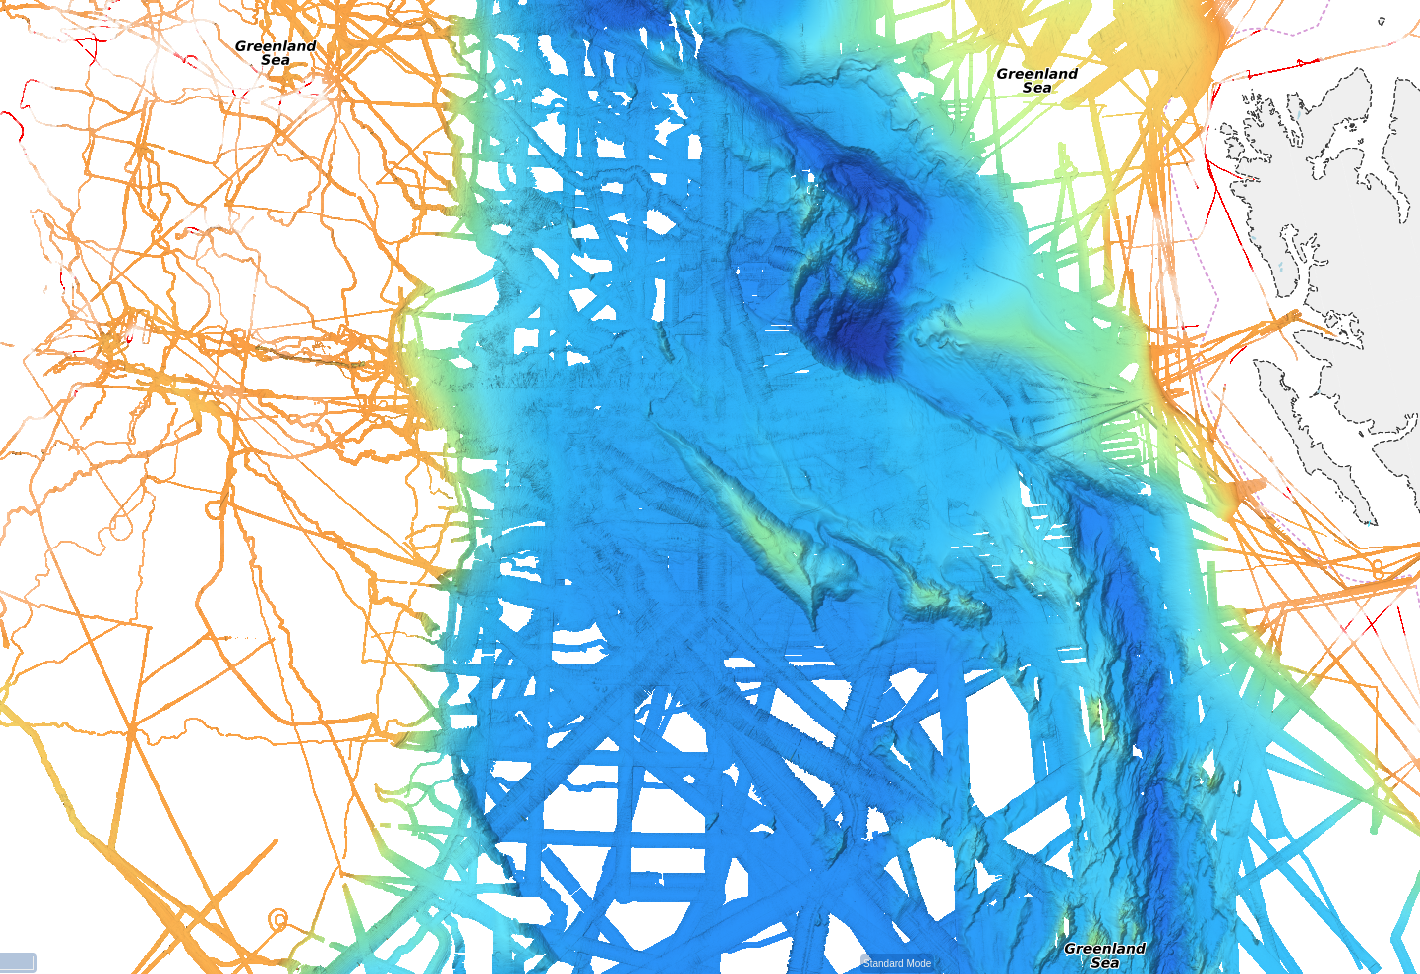
| AWI Bathymetry | Multibeam Echosounding / Bathymetry | Parameter: Bathymetry / Water depth rasters acquired by AWI Bathymetry group either on RV Polarstern or on other vessels Update interval: 1-2 per year Regions: Global |
| AWI Bathymetry Group (bathymetry@awi.de) | |
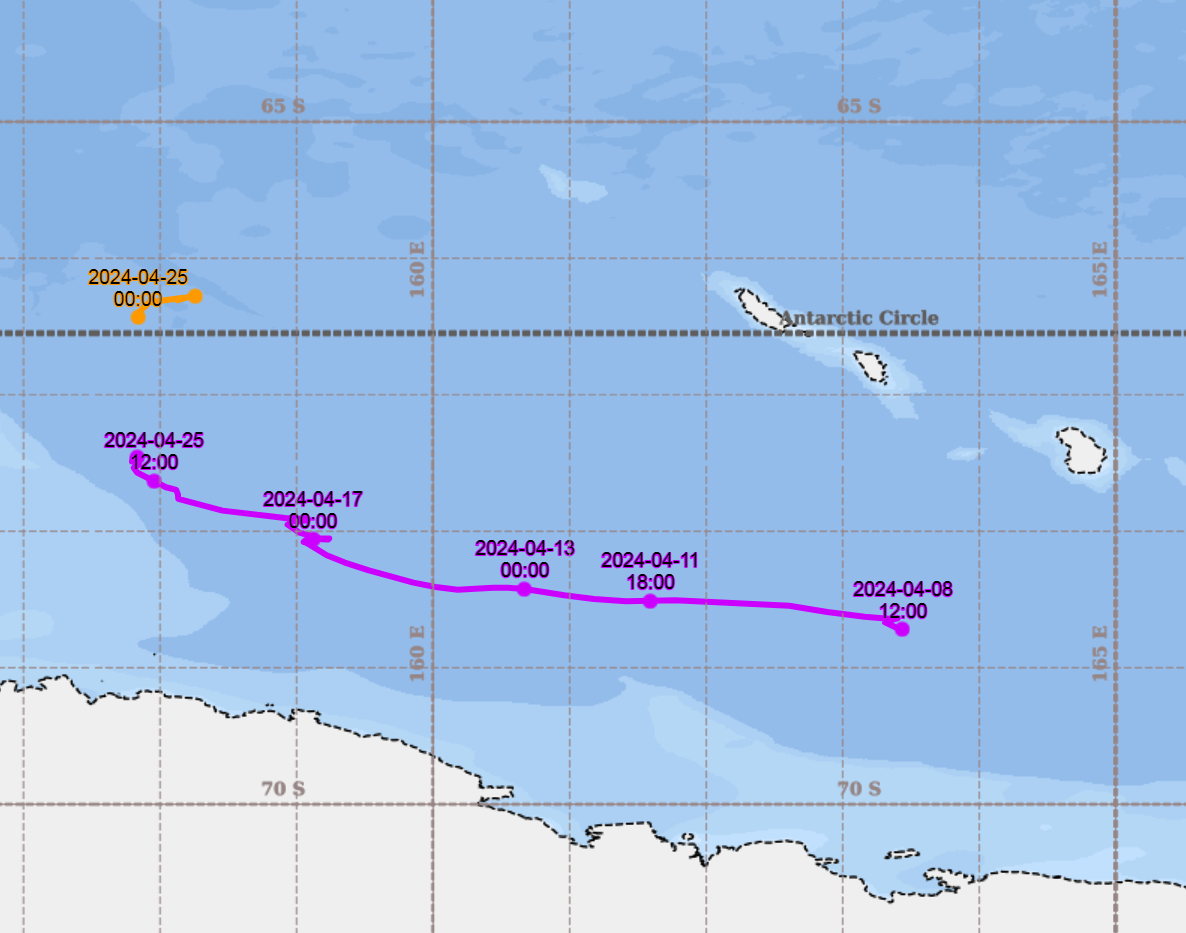
| Drift Buoys | Position Tracker | Deliver as CSV and everything might be fine |
| This depends on your bouys! | AWI Data Centre / Data Logistics Support |
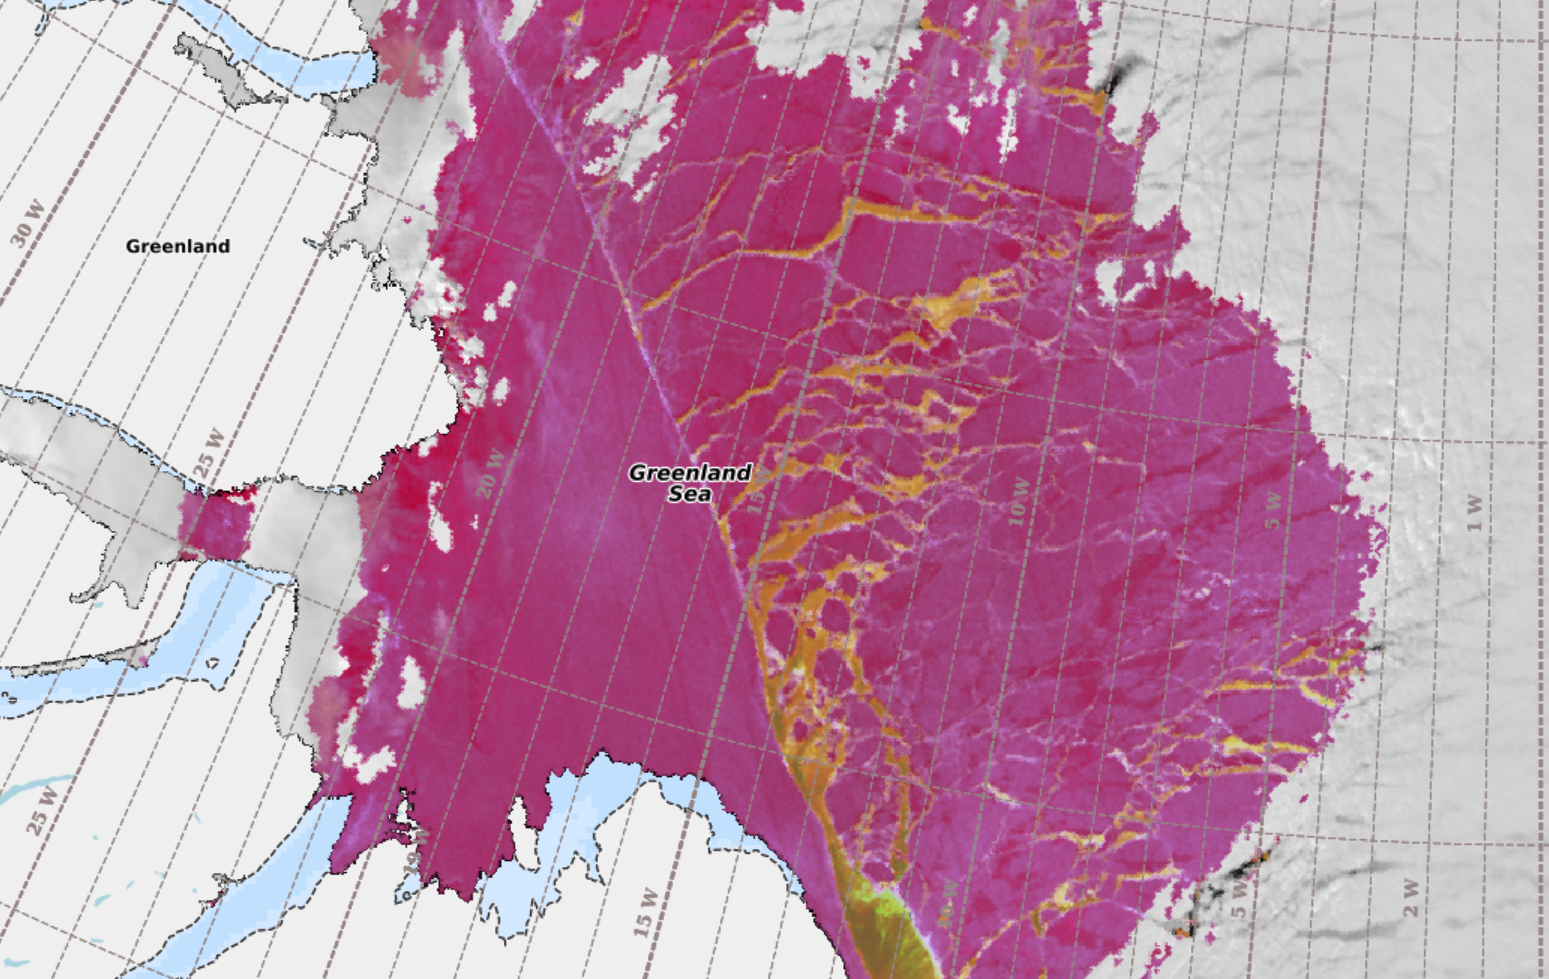
| Sea Ice Classes | Satellite / Sea Ice Classification | Parameter: Optical image ice & snow classification Update interval: Daily Regions: Global The Sentinel-3 constellation consists of 2 satellites carrying multispectral optical instruments. Through the wide swath width large areas can be viewed at once. The images are differentiated into detailed classes specializing in the snow cover of the ice. |
| Drift Noise GmbH (support@driftnoise.com) Original data: | Drift Noise GmbH (support@driftnoise.com) |
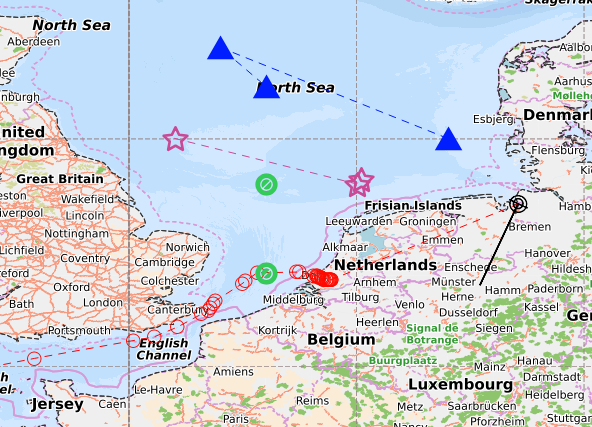
| Scientific Waypoints Custom Position Lists Ship Waypoints |

Add your data to MapViewer
You can integrate new geo data layers in MapViewer in the following ways:
- Update/add your mission-related data such as waypoints, route planning directly on board
- On short notice / during your campaign you can locally upload your geo data as a user layer to the MapViewer.
- For longterm support you may request a new geo data flow
Mission data
| Purpose | Short notice / on-campaign visualization of mission-related features such as waypoints or route planning |
| Deployment time | < 10 min |
| Data formats supported | GeoTIFF |
| Geographic projections | |
| Contact / support | Vessel's system administrator during campaign; or o2a-support@awi.de / team Data Logistics Support at Data Centre beforehand |
User layers
| Purpose | Short notice / on-campaign visualization of user data |
| Deployment time | < 1h |
| Data formats supported | GeoTIFF |
| Geographic projections | |
| Contact / support | o2a-support@awi.de / team Data Logistics Support at Data Centre beforehand; vessel's system administrator during campaign |
New data product
| Purpose | Long-term visualization of continuously provided geo data as an automated data flow from shore |
| Deployment time | Typically 4 weeks for data flow and format evaluation phase, handover on board |
| Data formats supported | GeoTIFF, Shapefile |
| Geographic projections |
|
| Contact / support | o2a-support@awi.de / team Data Logistics Support at Data Centre |
| Required support by you: |
|
