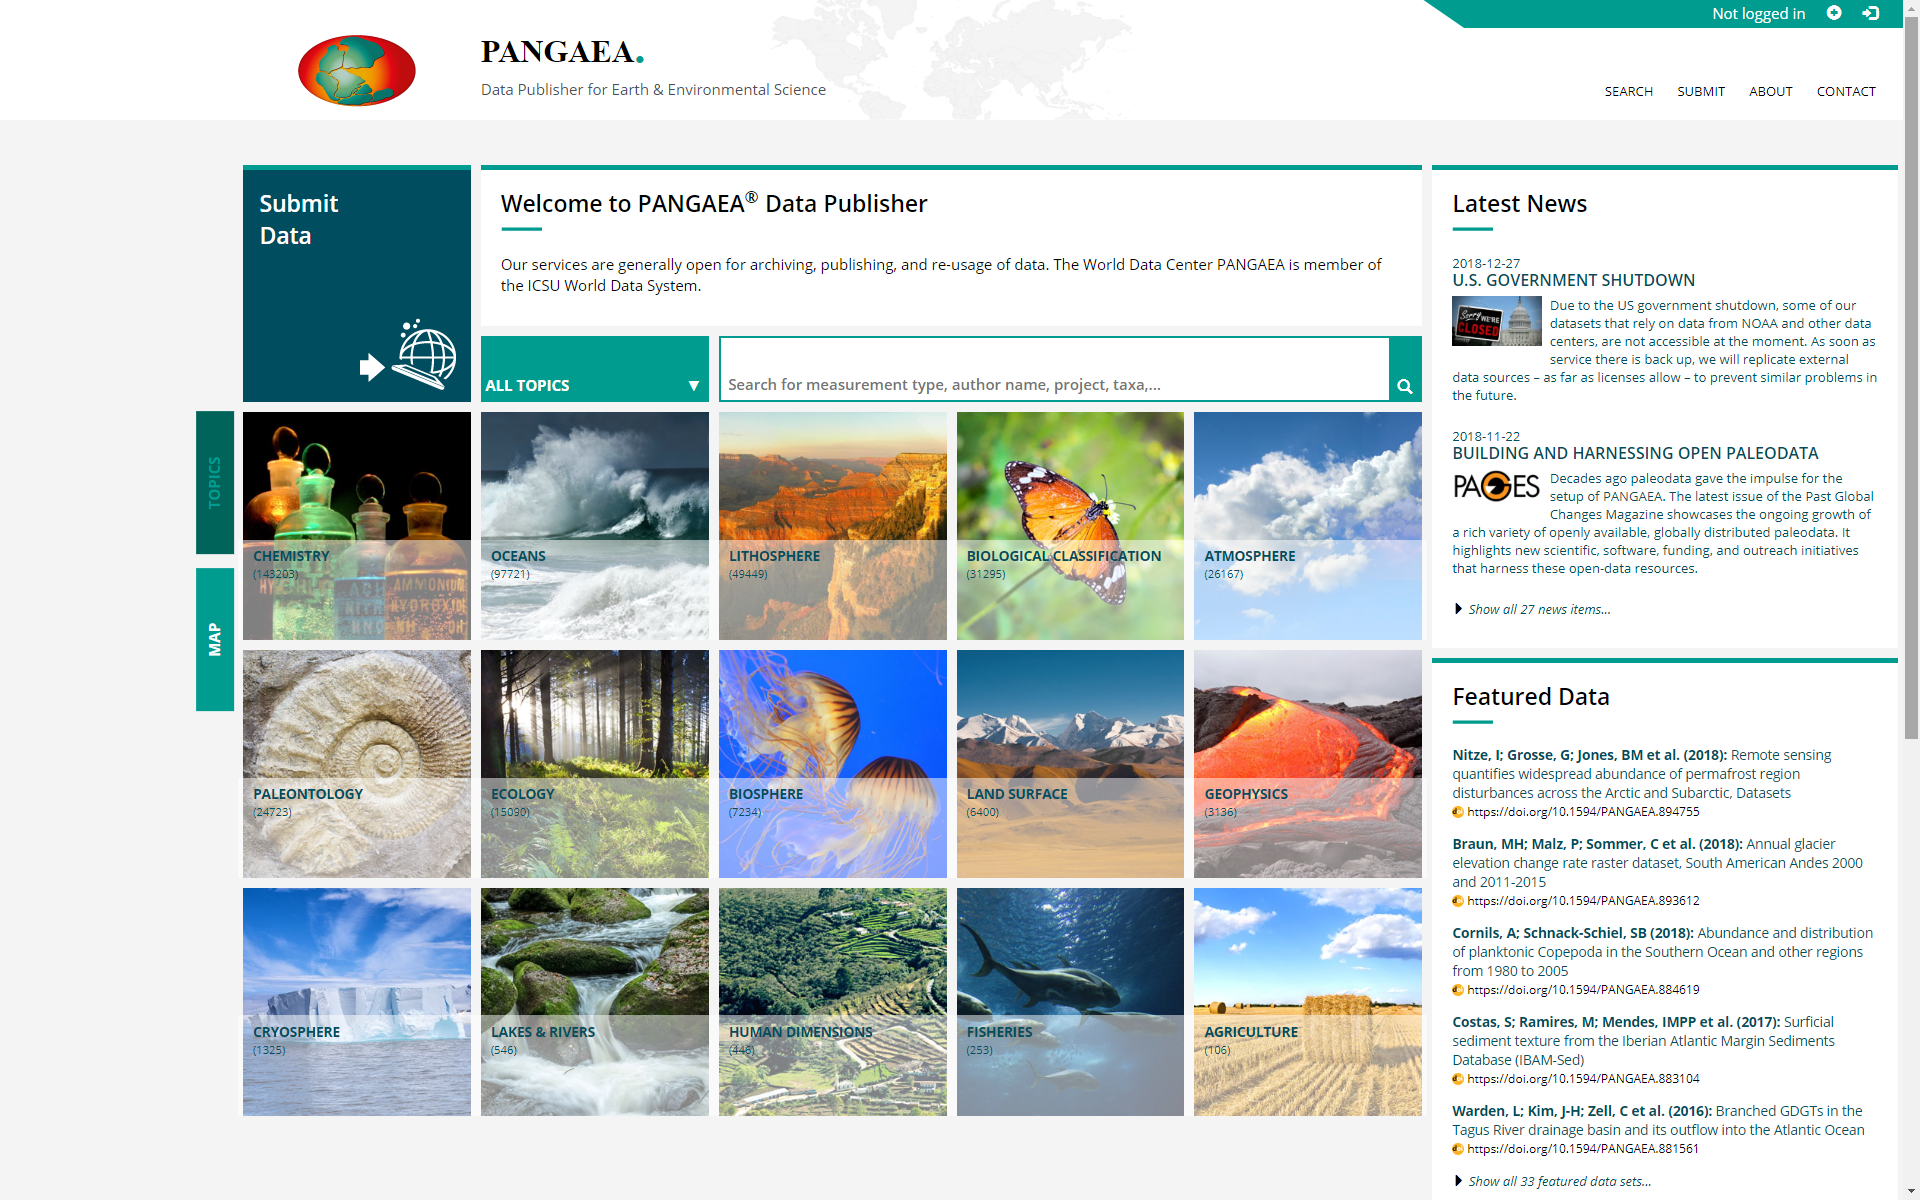
PANGAEA.de is a repository for aims to display data streams for monitoring purposes. It supports:
- 2D graph widgets depicting changes in a parameter with time; X-axis may also display another parameter instead ot time as variable
- Heatmap widgets depicting changes in a parameter with time and depth/altitute including contour plot option; ideal for displaying bupy and mooring data
- Map widgets including color-coded paramterts; ideal for displaying data from ship-mounted instruments
- Statistical analysis of selected parameter
- Direct data download
- Machine-friendly data access via REST interface
DATA SERVICES
Download http://ws.pangaea.de/dds-fgp/
OAI-PMH http://ws.pangaea.de/oai/provider?verb=Identify
DATA ANALYTICS
Use cases in https://github.com/bgruening/galaxy-rna-workbench
___________________________________________________________________________________________________________________________________________________________________
Contact: info(at)pangaea.de
WIKI: https://wiki.pangaea.de
EPIC.awi.de is a repository for aims to display data streams for monitoring purposes. It supports:
- 2D graph widgets depicting changes in a parameter with time; X-axis may also display another parameter instead ot time as variable
- Heatmap widgets depicting changes in a parameter with time and depth/altitute including contour plot option; ideal for displaying bupy and mooring data
- Map widgets including color-coded paramterts; ideal for displaying data from ship-mounted instruments
- Statistical analysis of selected parameter
- Direct data download
- Machine-friendly data access via REST interface
- User-friendly change of aggregation and display settings
- Re-use widgets across distinct dashboards
- Publishing of individual dashboards (opened to all)
- Sharing of individual dashboard within a group
OAI-PMH Base URL:
___________________________________________________________________________________________________________________________________________________________________
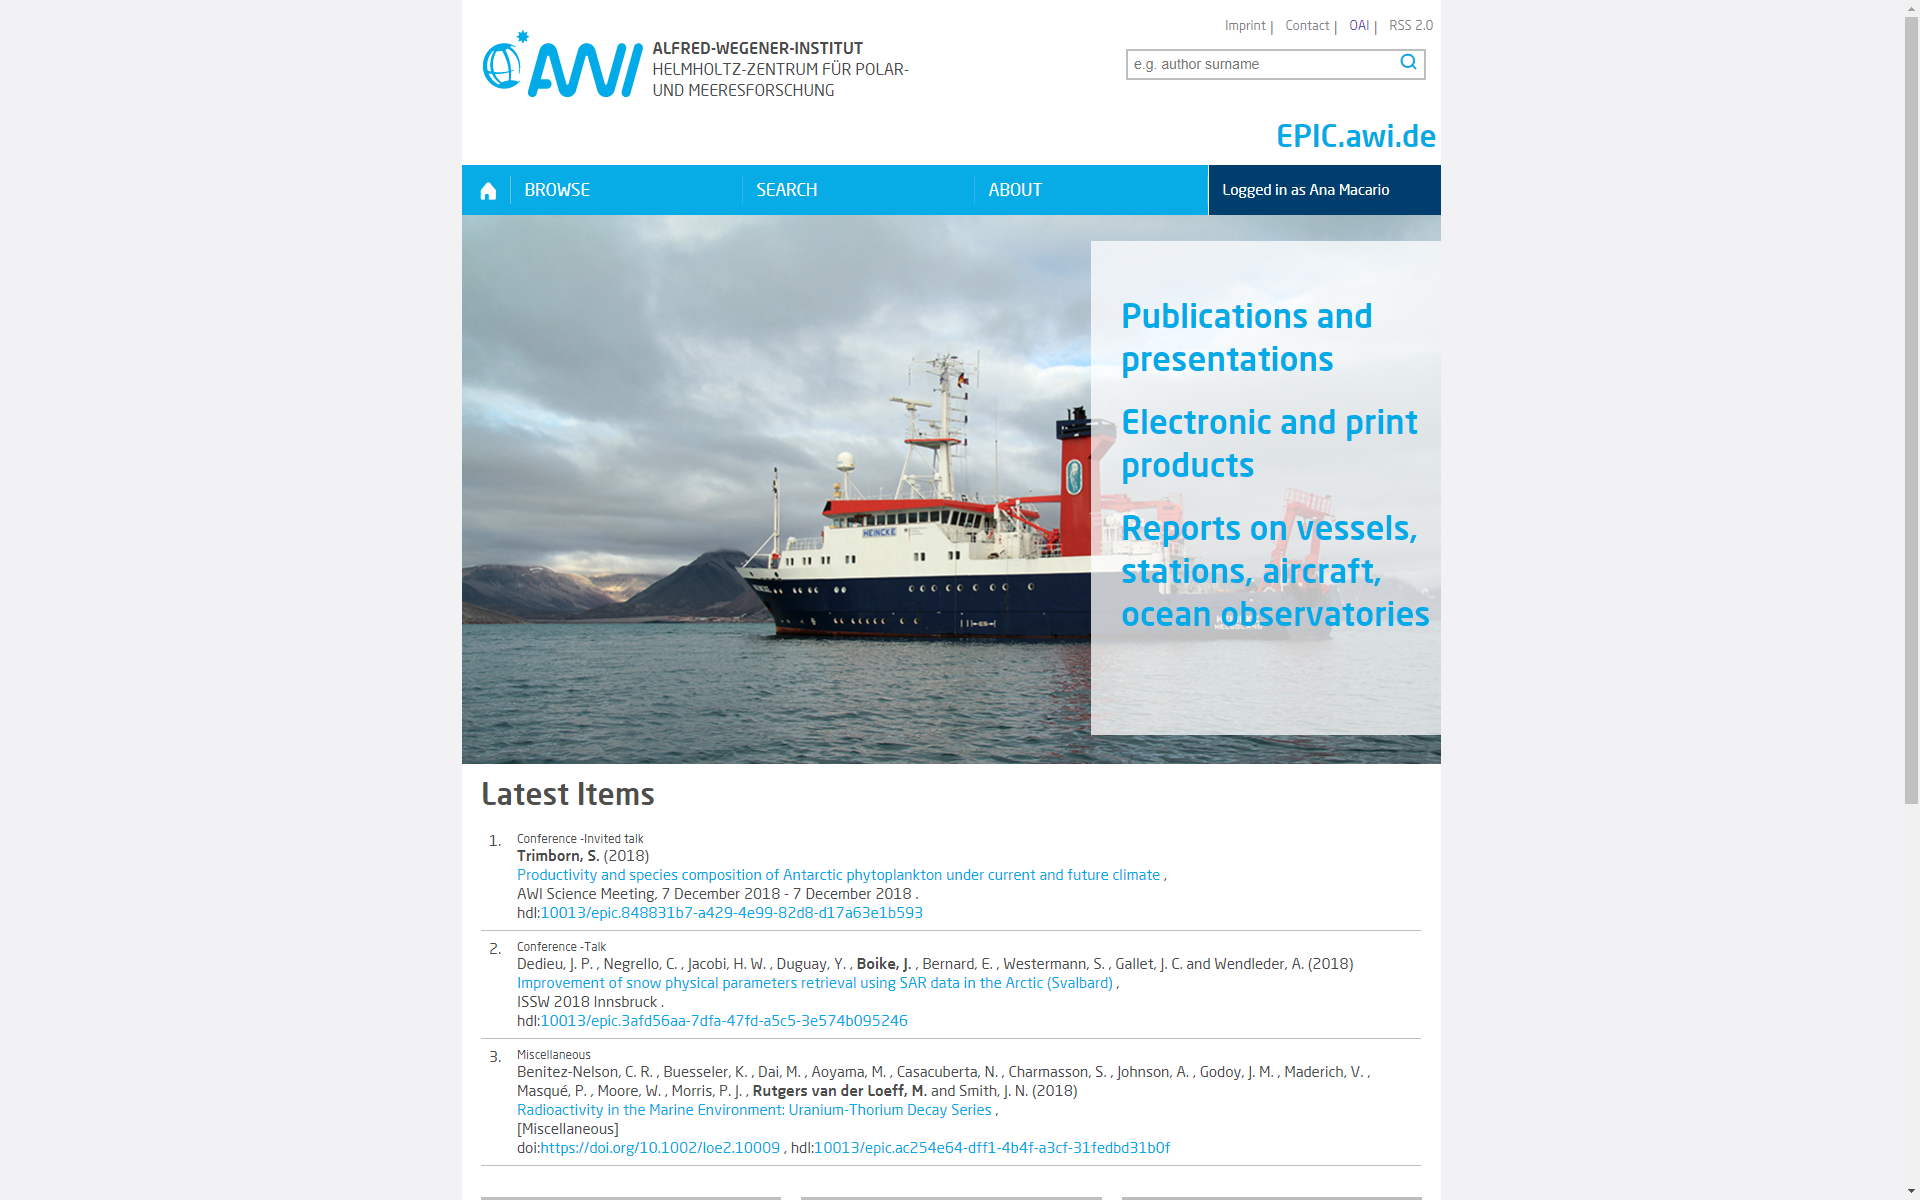
Contact: epic(at)awi.de
DATA.awi.de is a repository for aims to display data streams for monitoring purposes. It supports:
- 2D graph widgets depicting changes in a parameter with time; X-axis may also display another parameter instead ot time as variable
- Heatmap widgets depicting changes in a parameter with time and depth/altitute including contour plot option; ideal for displaying bupy and mooring data
- Map widgets including color-coded paramterts; ideal for displaying data from ship-mounted instruments
- Statistical analysis of selected parameter
- Direct data download
- Machine-friendly data access via REST interface
- User-friendly change of aggregation and display settings
- Re-use widgets across distinct dashboards
- Publishing of individual dashboards (opened to all)
- Sharing of individual dashboard within a group
OAI-PMH Base URL:
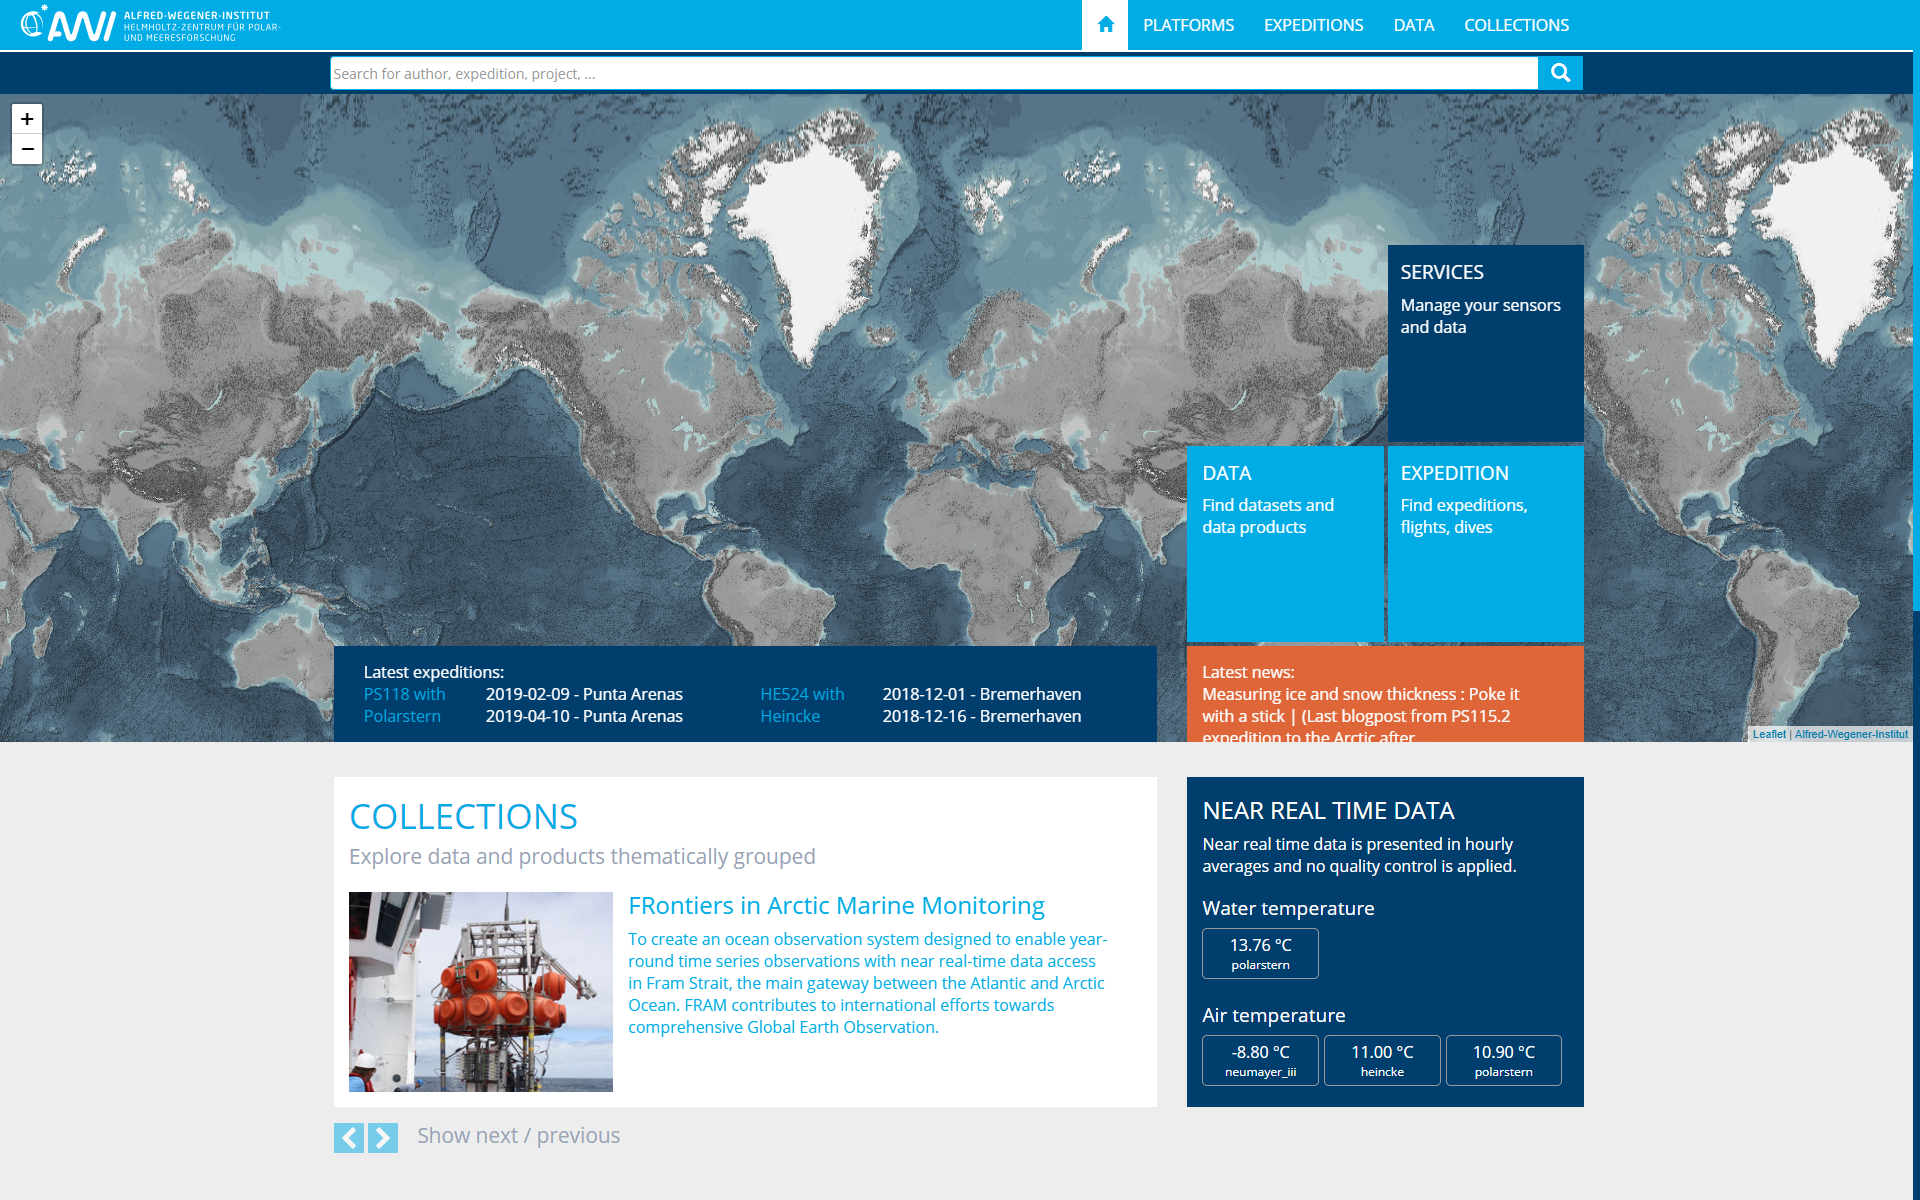
Contact: data(at)awi.de
Overview
Content Tools