Page History
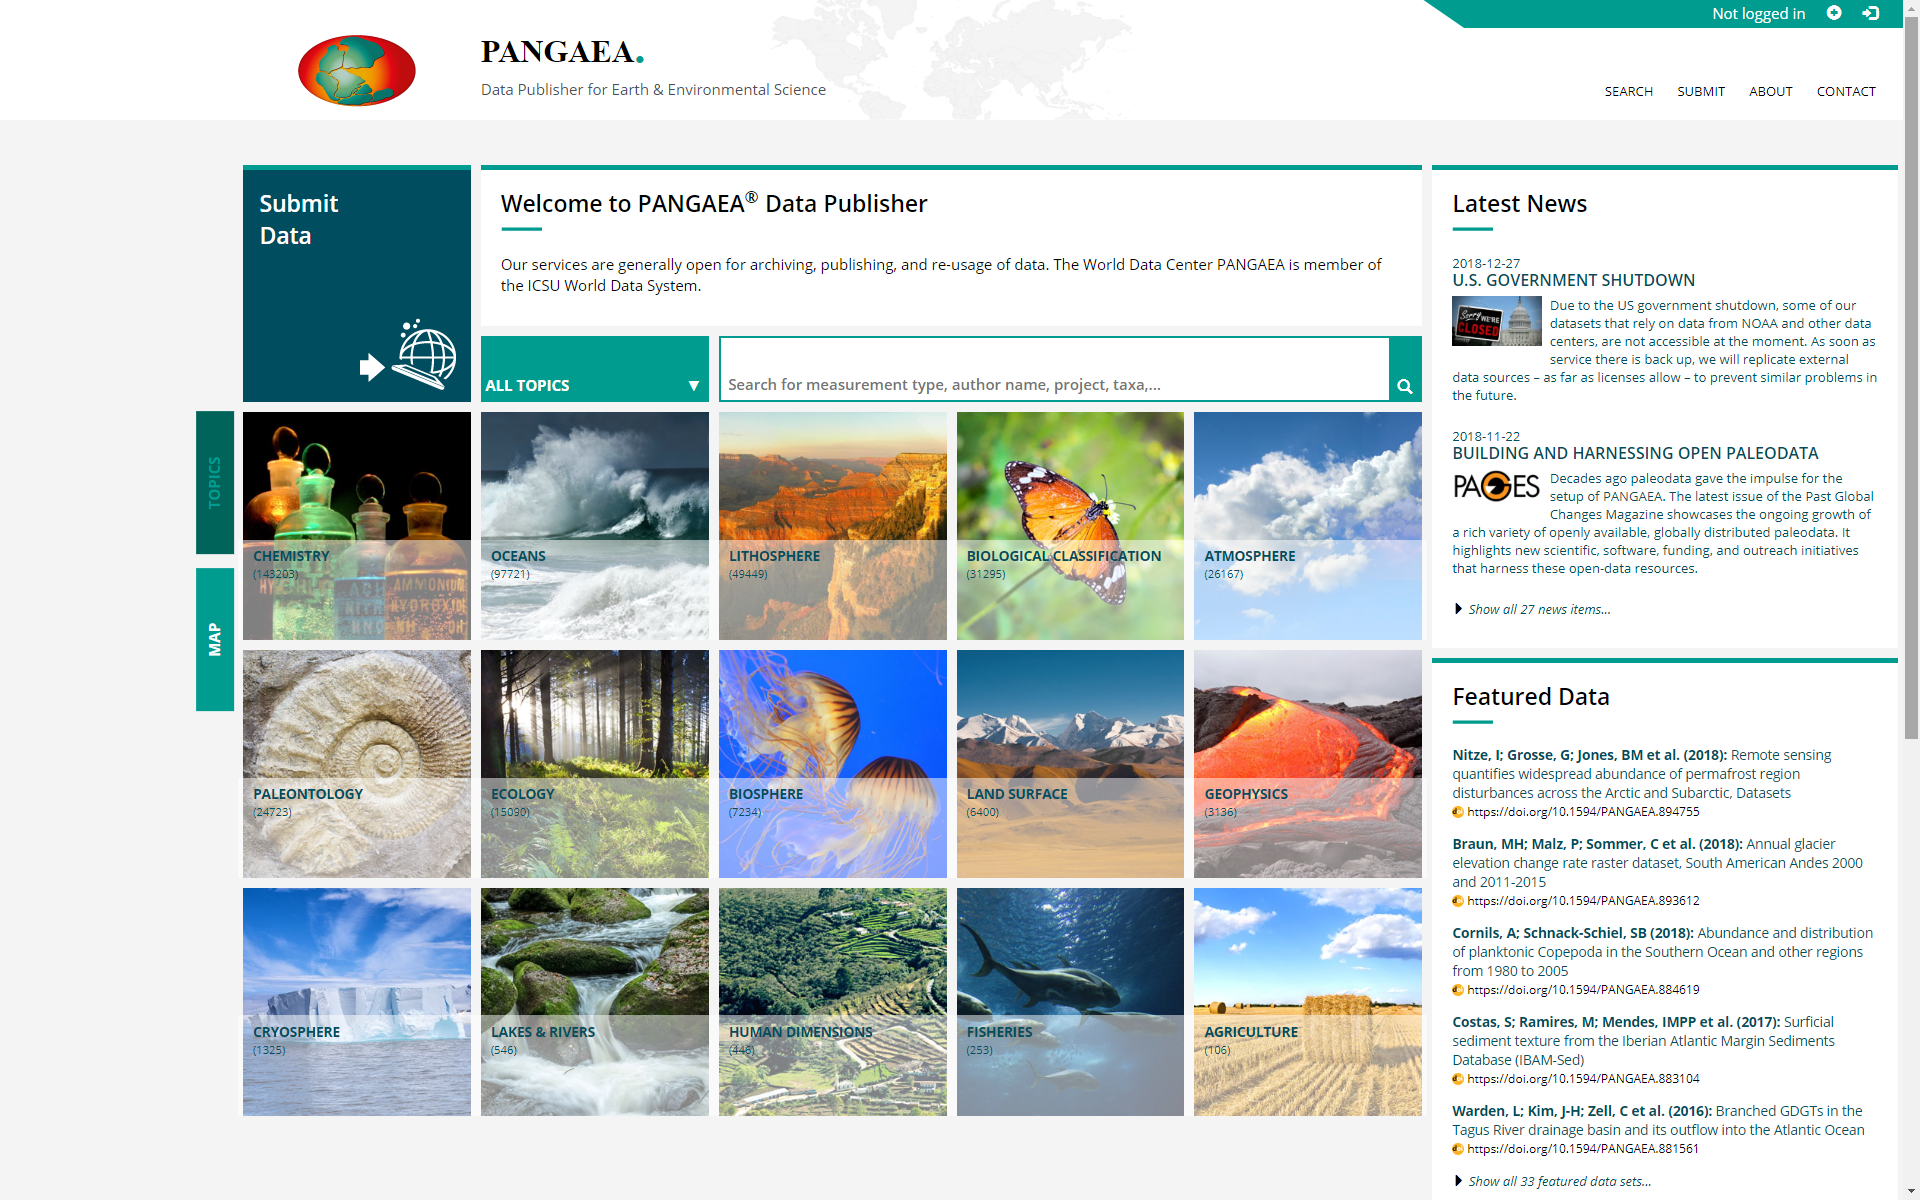
PANGAEA.de is a data repository for aims to display data streams for monitoring purposesfor earth sciences. It supports:
- User-friendly data submission
- Quality control of datasets prior to publishing
- DOI minting including recommended citation
- Tools for data access adn visualization
- Machine-to-machine access to data warehouse
- Long-term data archival
- Optional assignement of data collections
- FAIR principles
SERVICES
WIKI: https://wiki.pangaea.de
Tooling https://pangaea.de/tools/
Data access
DATA SERVICES
Download http://ws.pangaea.de/dds-fgp/
Metadata access, OAI-PMH Base URL http://ws.pangaea.de/oai/provider?verb=Identify
DATA ANALYTICS
Use cases in Software repository https://github.com/bgruening/galaxypangaea-rnadata-workbench
___________________________________________________________________________________________________________________________________________________________________
Contact: info(at)pangaea.de
WIKI: https://wiki.pangaea.de
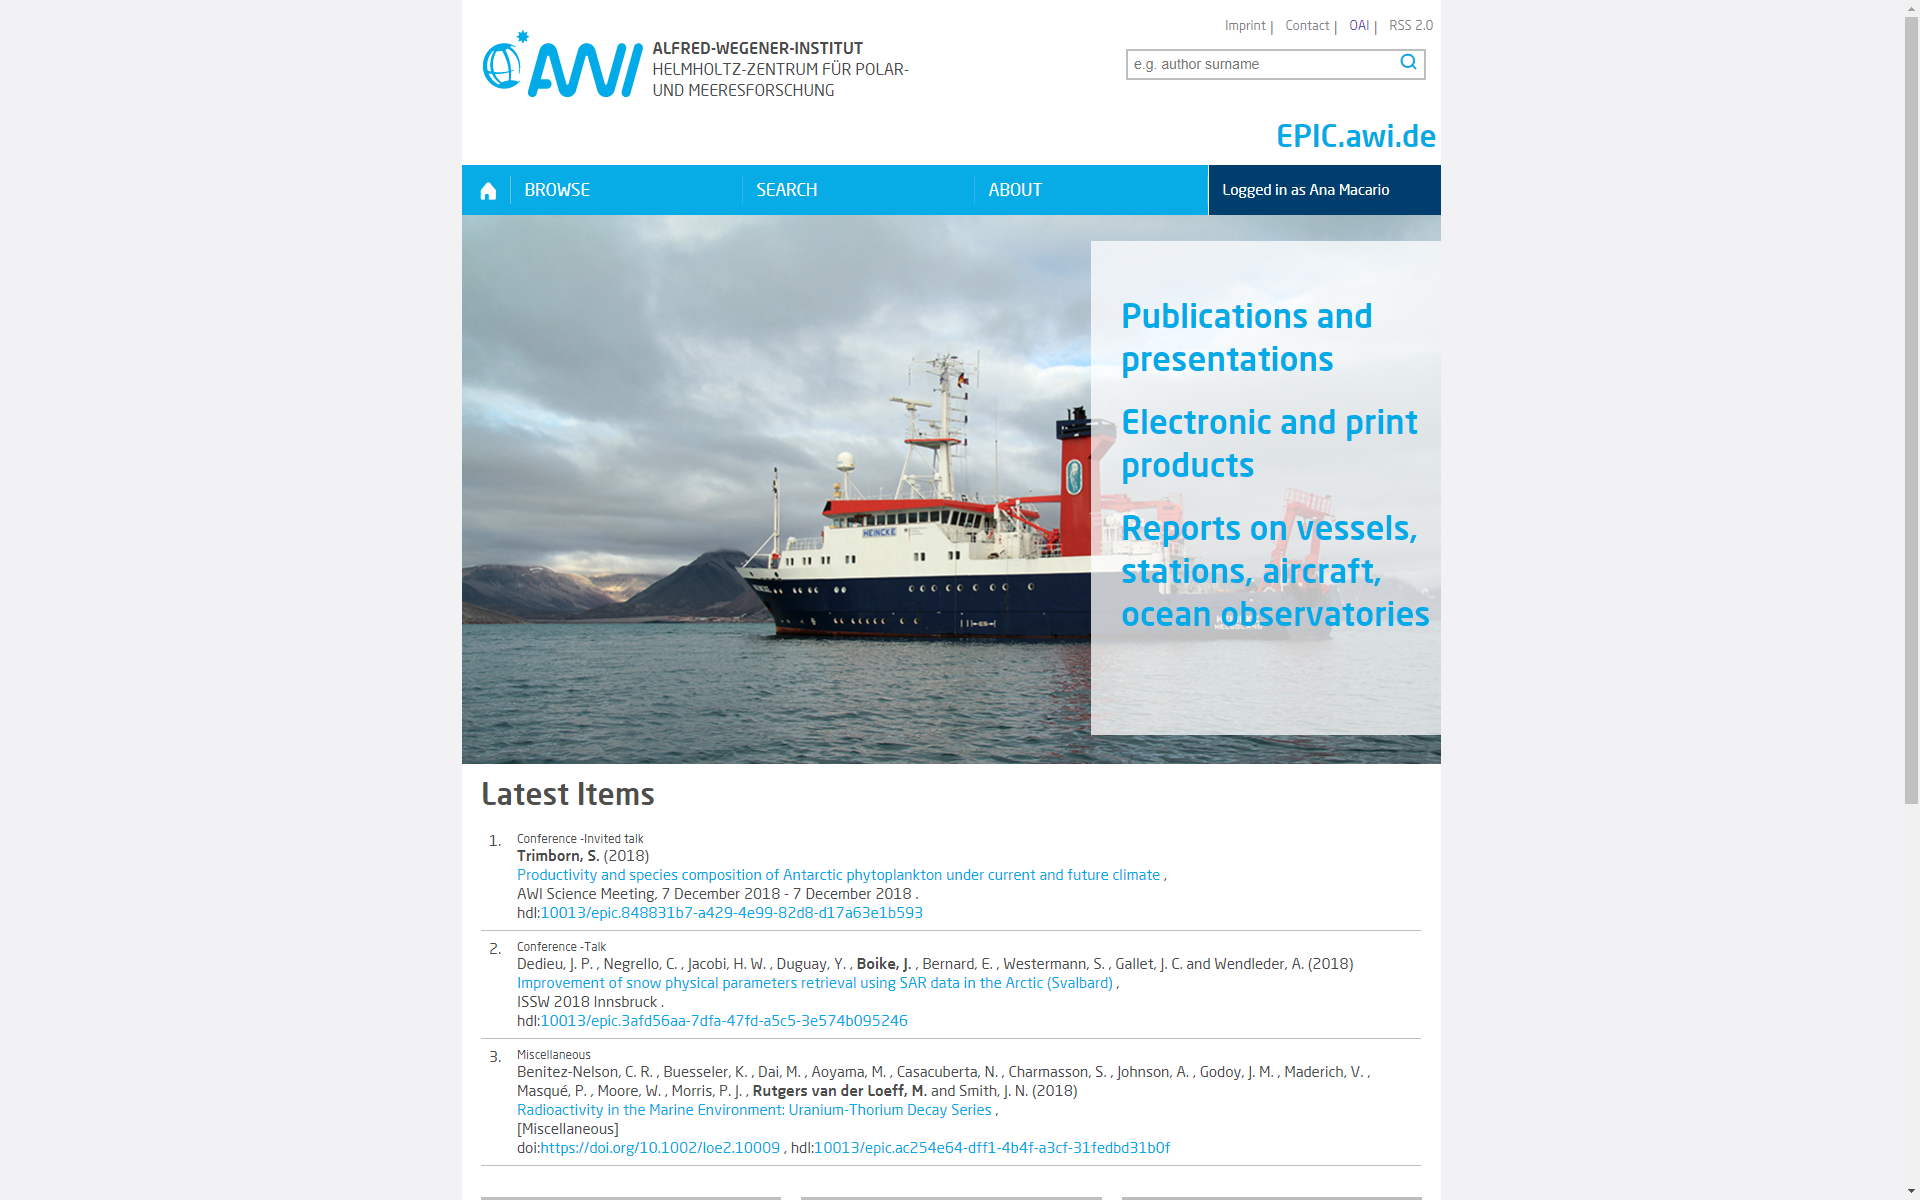
EPIC.awi.de is a repository for aims to display data streams for monitoring purposespublication repository tailored to AWI needs. It supports:
- 2D graph widgets depicting changes in a parameter with time; X-axis may also display another parameter instead ot time as variable
- Heatmap widgets depicting changes in a parameter with time and depth/altitute including contour plot option; ideal for displaying bupy and mooring data
- Map widgets including color-coded paramterts; ideal for displaying data from ship-mounted instruments
- Statistical analysis of selected parameter
- Direct data download
- Machine-friendly data access via REST interface
- User-friendly change of aggregation and display settings
- Re-use widgets across distinct dashboards
- Publishing of individual dashboards (opened to all)
- Sharing of individual dashboard within a group
___________________________________________________________________________________________________________________________________________________________________
- Archival of a large range of genre: from field reports to peer-reviewed articles
- Handle minting for all items
- Browsing for AWI specific organizations and programs
- Full-text search
- Optional embargo for PDFs
- Interoperability with openAIRE
SERVICES
Metadata access, OAI-PMH Base URL: https://epic.awi.de/cgi/oai2?verb=Identify
Contact: epic(at)awi.de
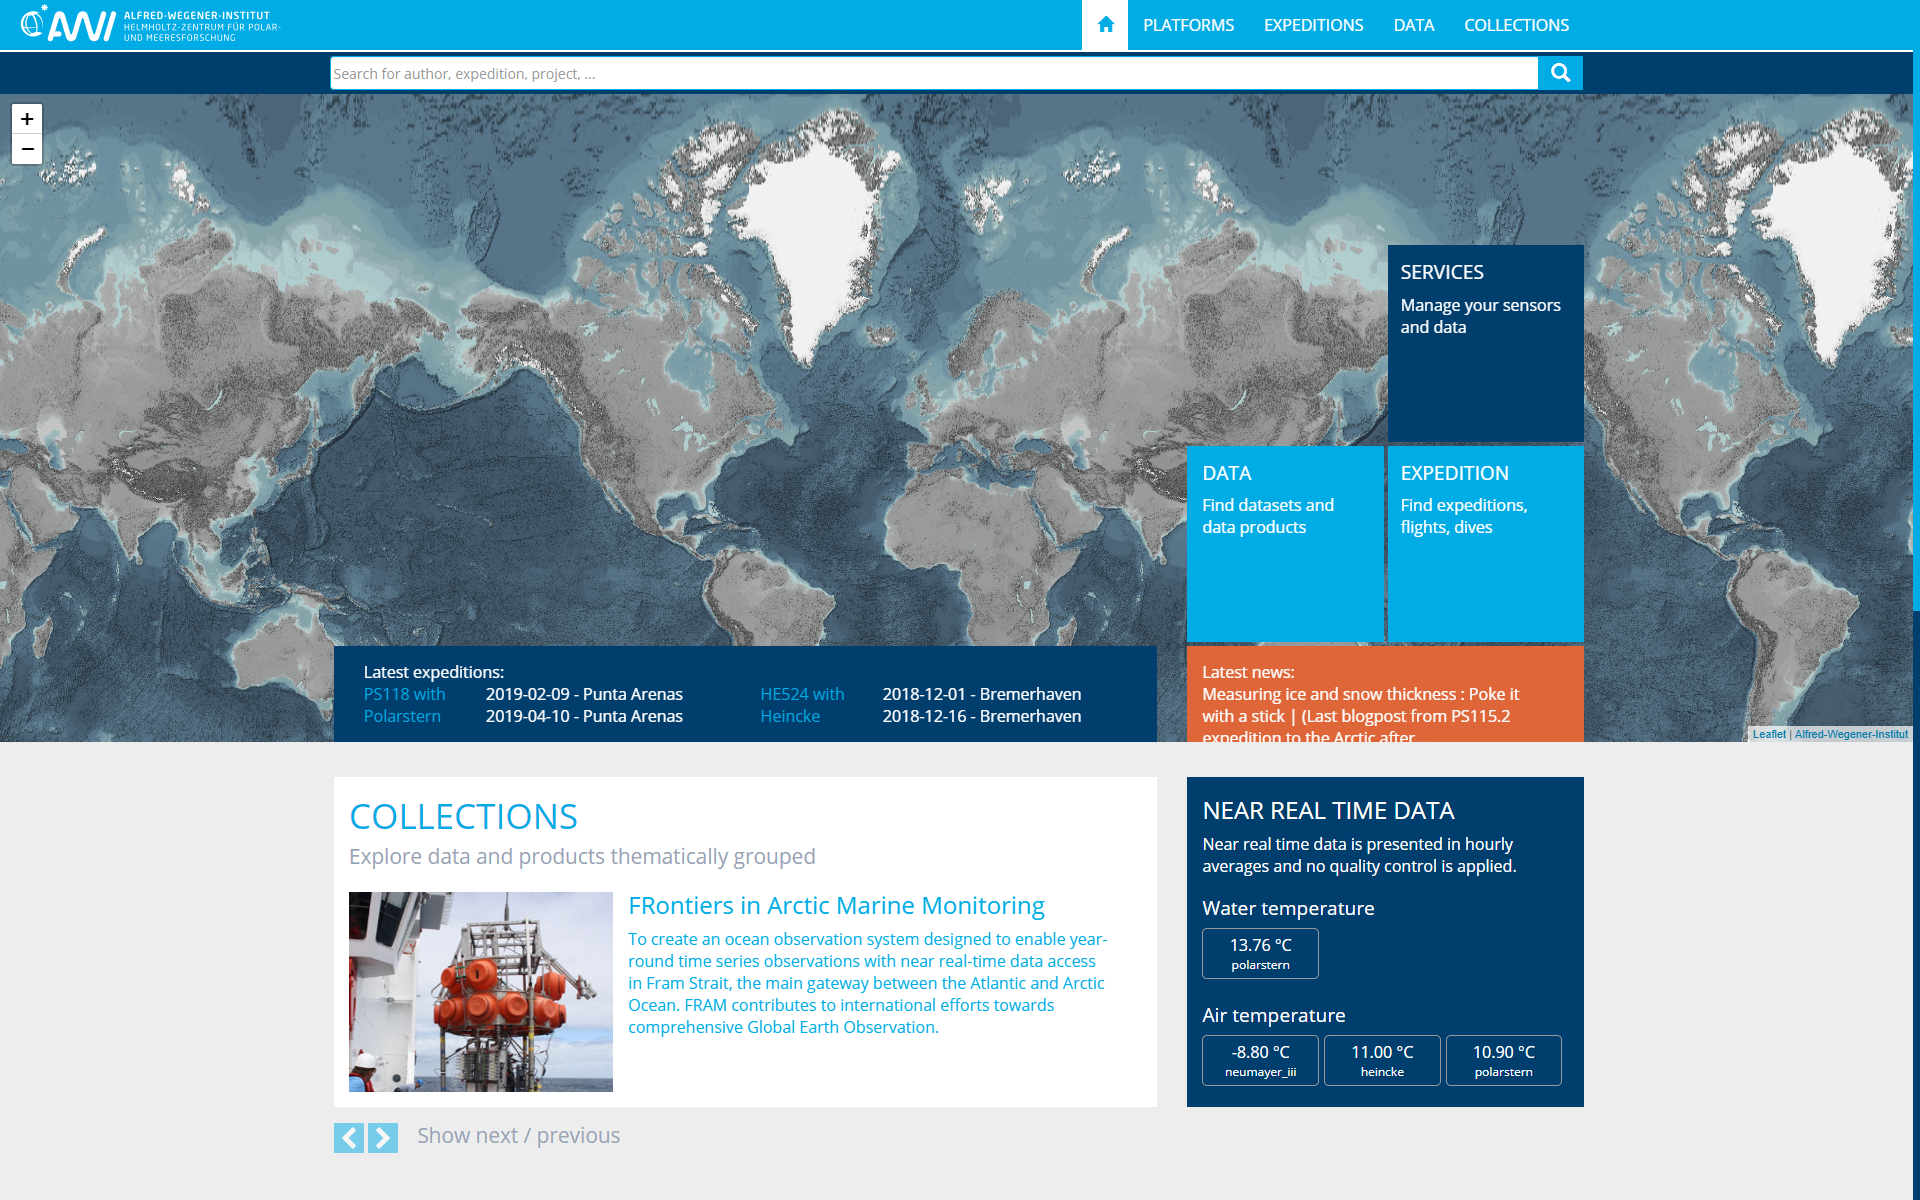
DATA.awi.de is a is a repository for aims to display data streams for monitoring purposes. user-friendly framework for accessing of varios types of scientific content. It supports:
- 2D graph widgets depicting changes in a parameter with time; X-axis may also display another parameter instead ot time as variable
- Heatmap widgets depicting changes in a parameter with time and depth/altitute including contour plot option; ideal for displaying bupy and mooring data
- Map widgets including color-coded paramterts; ideal for displaying data from ship-mounted instruments
- Statistical analysis of selected parameter
- Direct data download
- Machine-friendly data access via REST interface
- User-friendly change of aggregation and display settings
- Re-use widgets across distinct dashboards
- Publishing of individual dashboards (opened to all)
- Sharing of individual dashboard within a group
- Discovery and visualization of a large range of scientific content: from near real-time data to quality-controlled GIS products
- Discovery of information on research platforms, devices and sensors
- Discovery of campaign specific metadata including its scientific output
- Discovery of themantically grouped data in collections
- Re-use of information in user-tailored context
Contact: data(at)awi.de
Overview
Content Tools