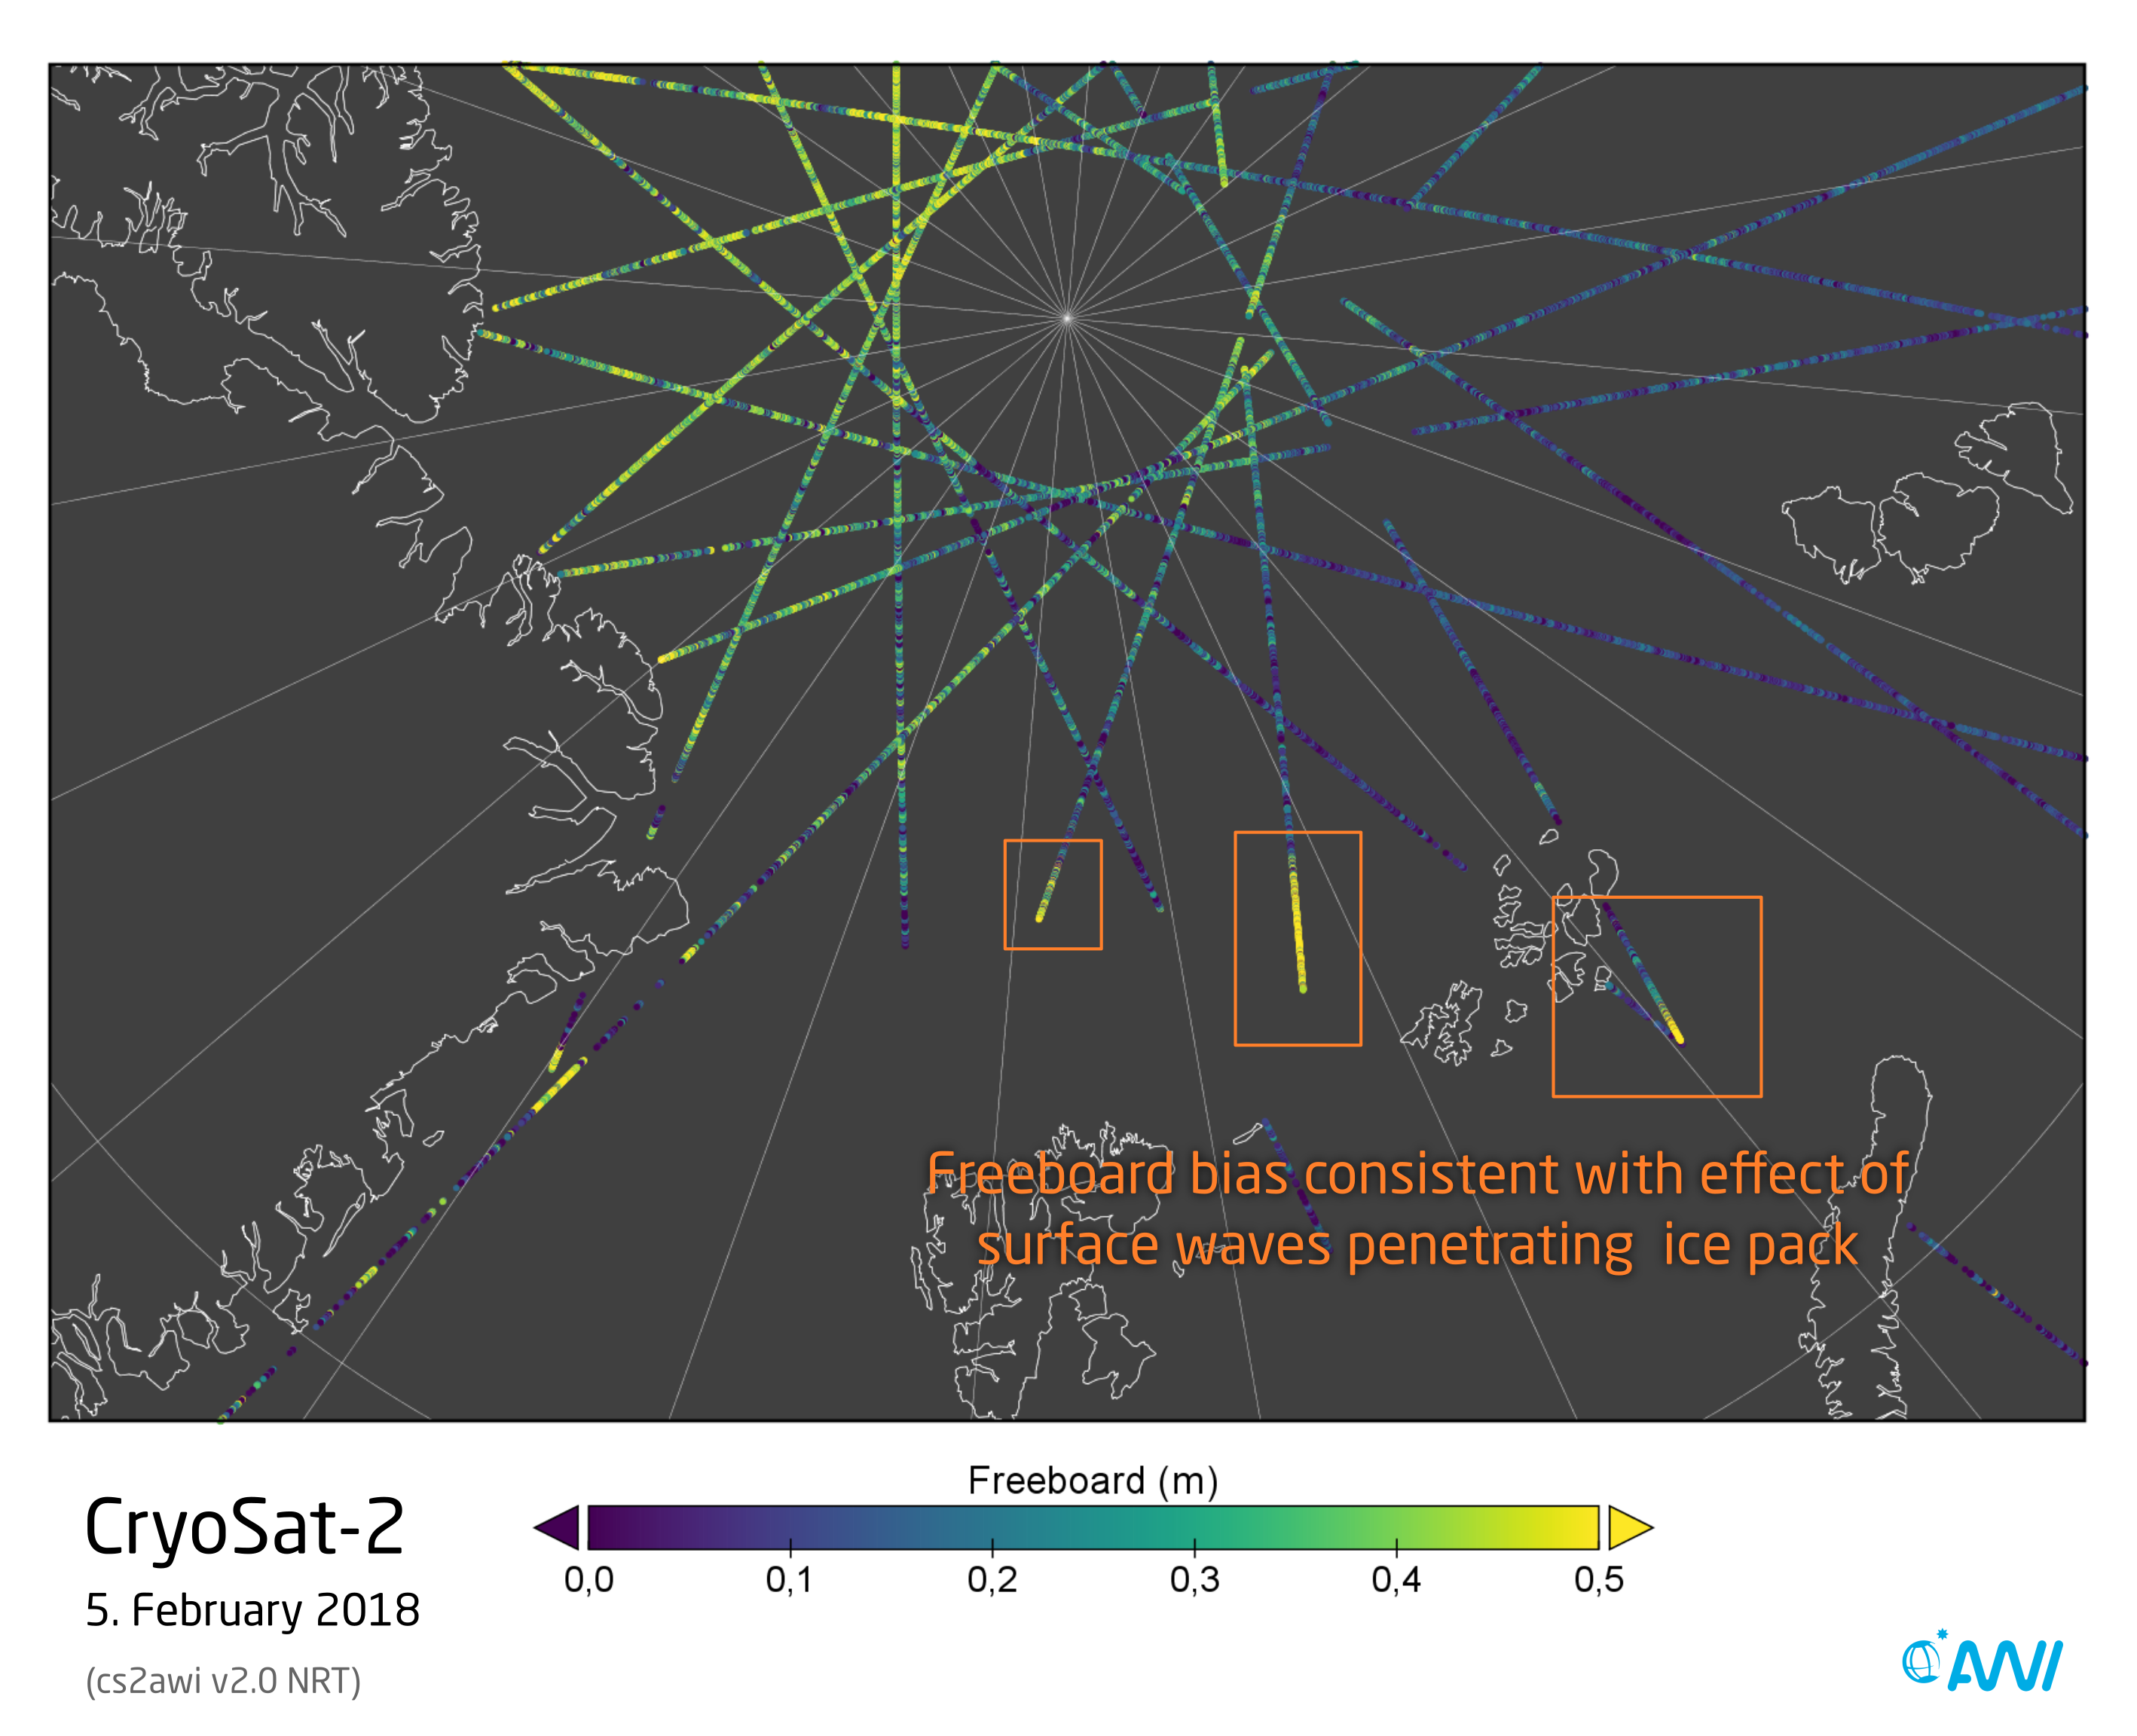
A major low pressure system passed through the Barents Sea on February 5, 2018 transporting significant amount of warm air masses to the central Arctic (overview e.g. Arctic News, Arctic Sea Ice Blog). It also generated high surface waves in the sea-ice free area north of Spitsbergen. The retrieved freeboard in CryoSat-2 NRT product shows how far these waves penetrated into the sea ice since the presence of surface waves causes the freeboard to be biased high (see map below). While this is an unwanted effect and a shortcoming of the algorithm, it can be used to study surface wave penetration into the marginal ice zone.
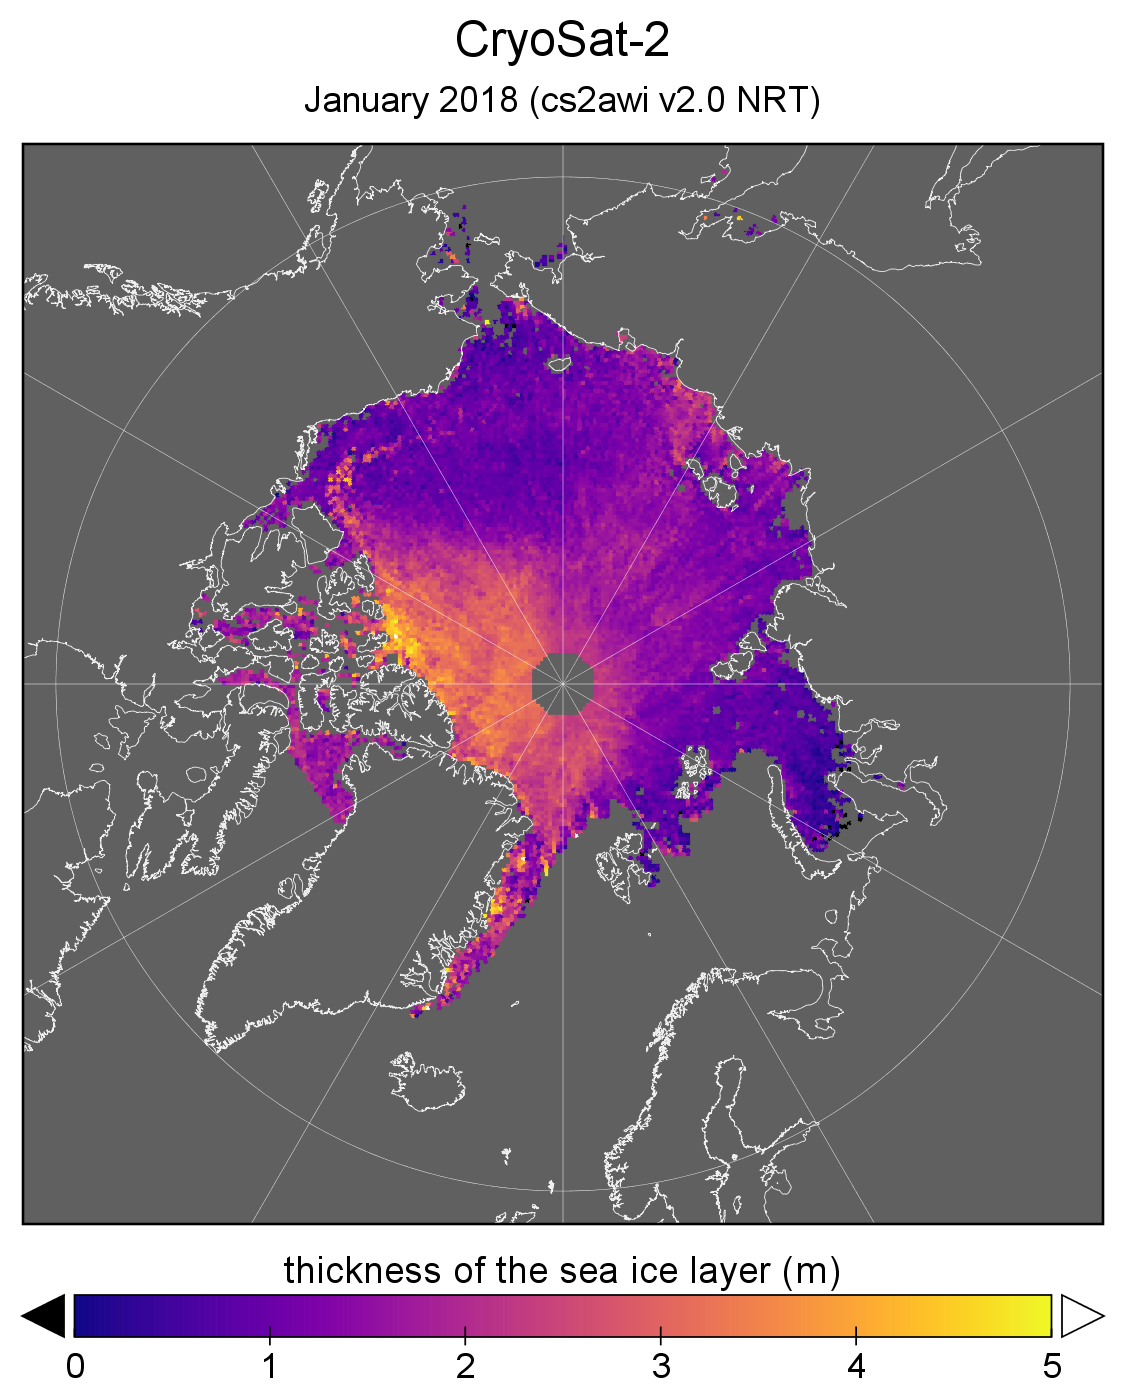
Arctic sea ice thickness information has been updated with NRT data for January 2018 and reprocessed data for December 2017. Daily, weekly and monthly products are available here: Reprocessed, Near-real time


Short Facts
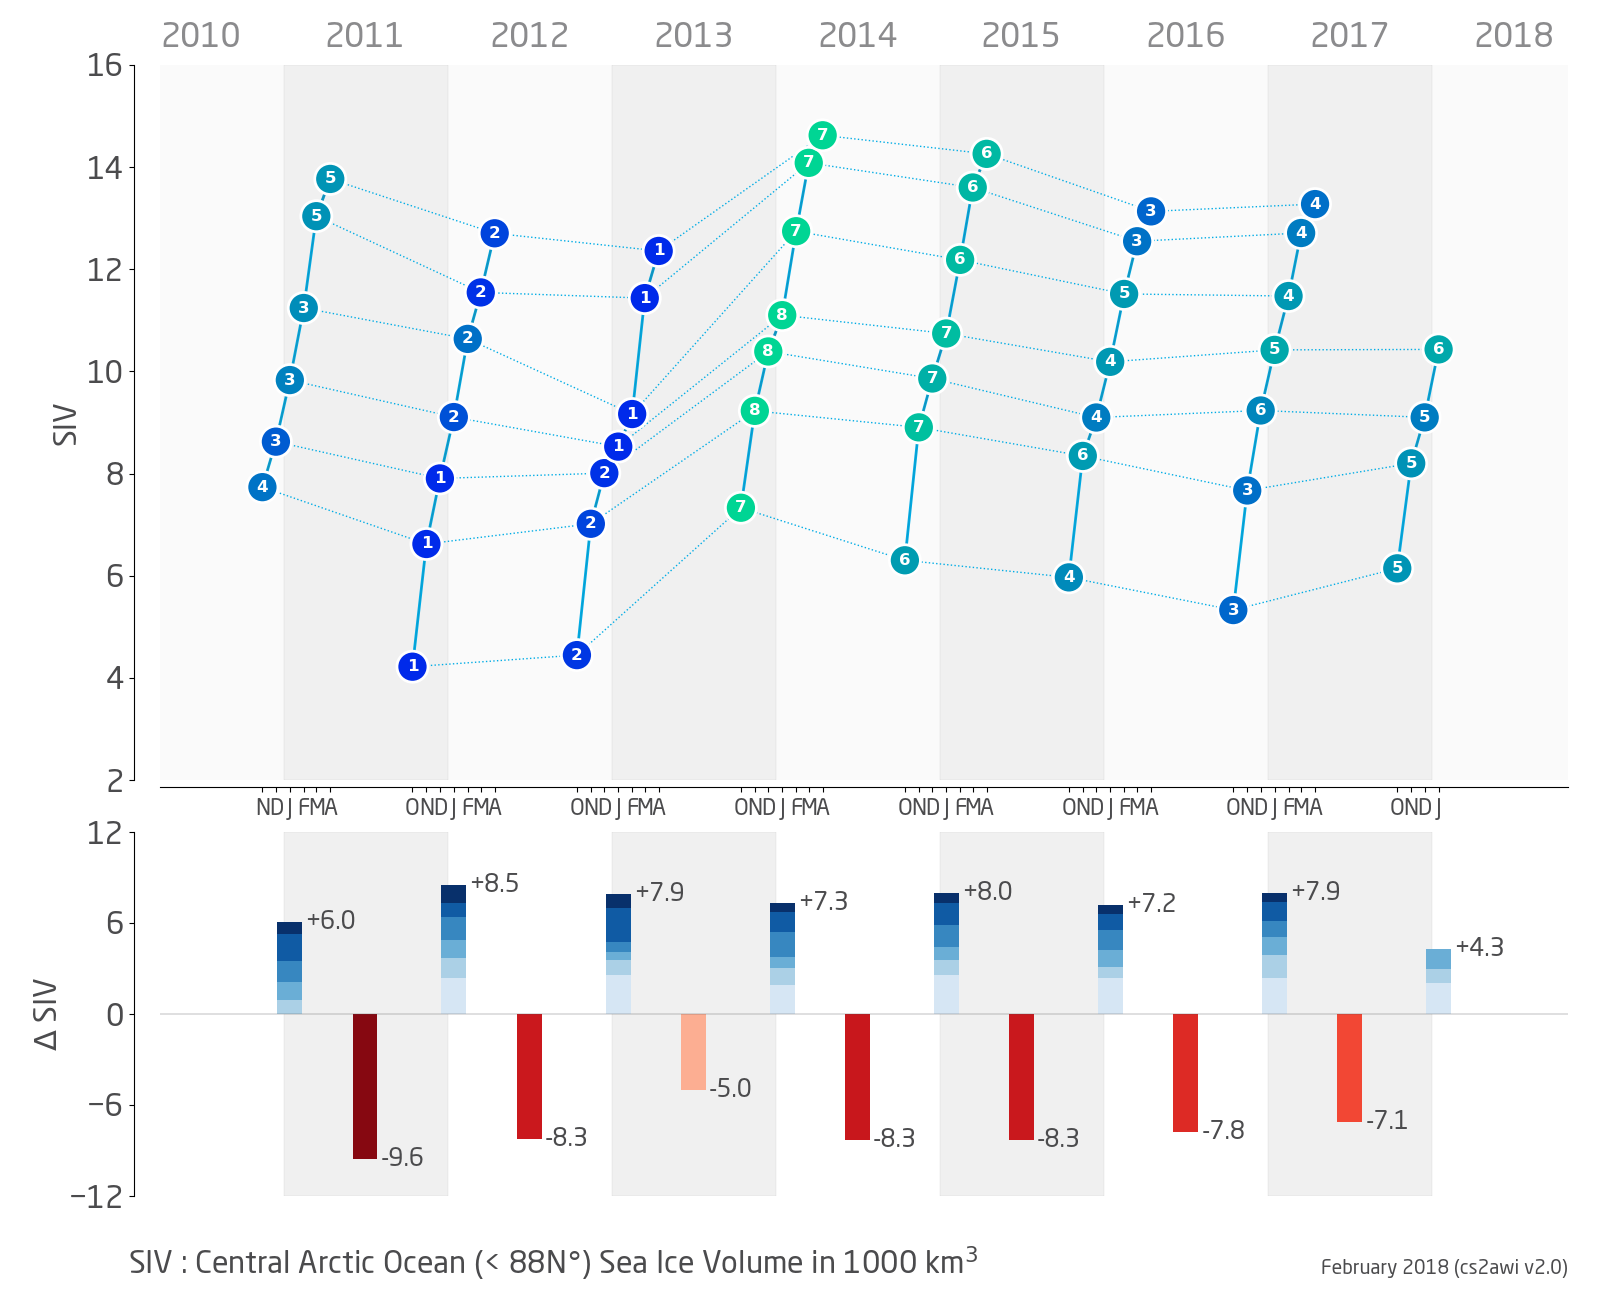
- December sea ice volume in the central Arctic was 6th lowest / 3rd highest in 8 years of CryoSat-2 observations: 10.43 km3
- highest: 11.10 km3 in Jan 2014
- lowest: 8.53 km3 in Jan 2013
- average: 10.04 km3
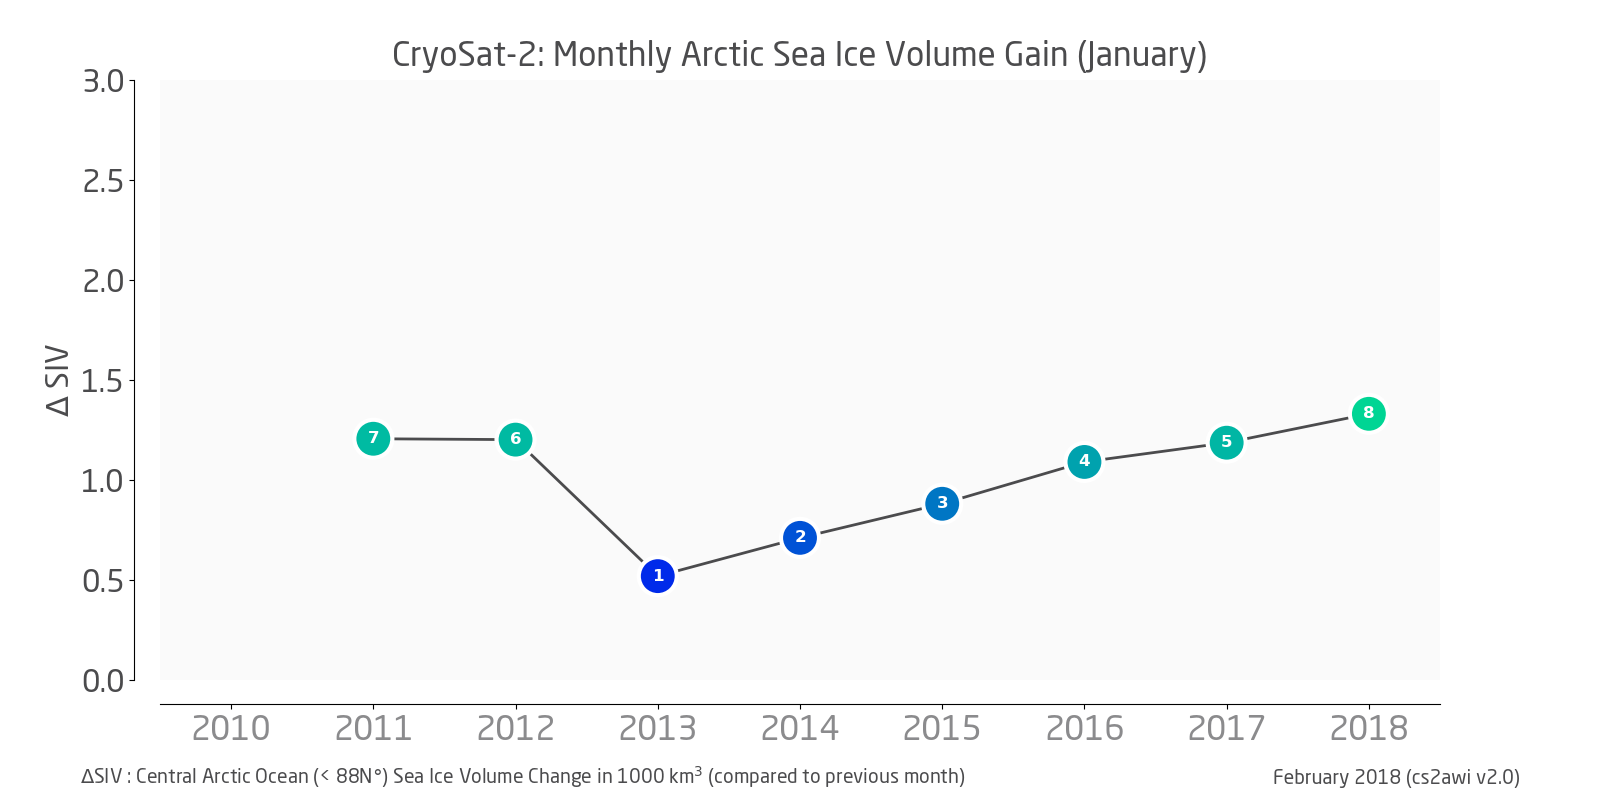
- Monthly sea ice volume gain (December through January) was highest in 8 years of CryoSat-2 observations: +1.33 km3
- lowest: +0.52 km3 in Jan 2013 (potential retrieval anomaly, under investigation)
- average: +1.02 km3
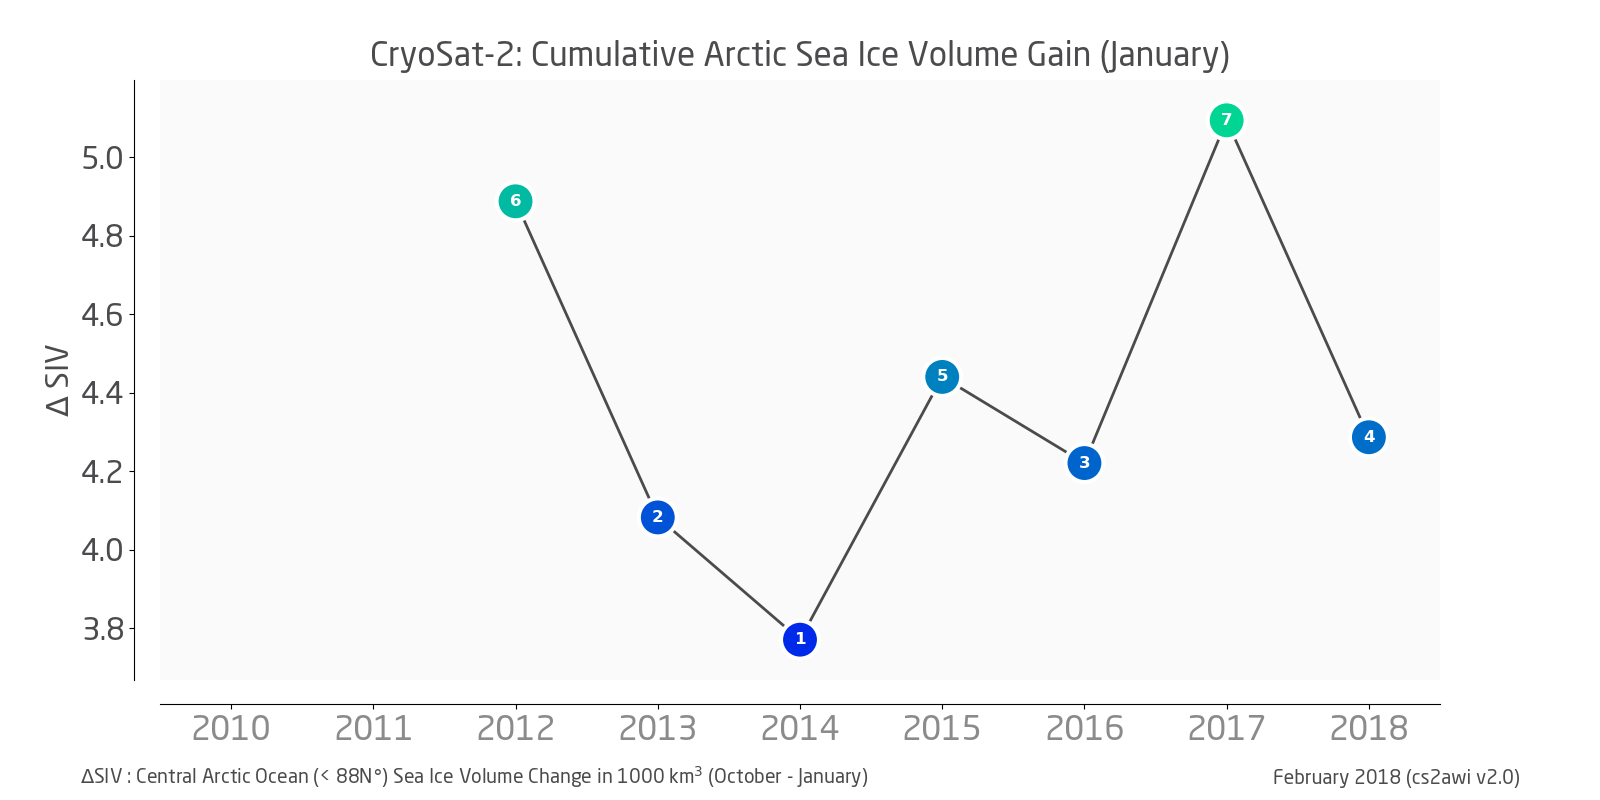
- Cummulative sea ice volume gain (October through January) was 4th lowest / 4th highest in 8 years of CryoSat-2 observations: +4.29 km3
- highest: +5.09 km3 in Jan 2017
- lowest: +3.77 km3 in Jan 2013 (potential retrieval anomaly, under investigation)
- average: +4.40 km3