Page History
Infrastucture, components and services designed to support scientists in their analysis pipelines including data visualization. The solutions range from infrastructure platforms like a hub enabling a jupyter notebook environment over to an ecosystem of tools/code examples tailored to specific scientific needs
Contact
| Note |
|---|
Questions, feature requests, bugs?: |
I) INFRASTRUCTURE & TOOLS
| JupyterHub | https://jupyterhub.awi.de; read documentation Access curently restricted to AWI accounts |
| RASDAMAN | http://rasdaman1.dmawi.de/ Provides a powerful array analytics for multidimensional large-scale datasets. Mockup illustrates how to extract data subsets including along a profile and how to perform certain queries in a federated environment |
| GitLab | https://gitlab.awi.de; read documentation |
| Code repository | https://github.com/o2a-data (O2A-data code repository) A software development platform with built-in version control, issue tracking, code sharing and review, etc. Within the project "O2A-data" we provide open-acess examples on how to download, perform basic analysis and visualize data stored in various backends using Jupyter Notebook |
| AI Tools |
Tutorials
Documentation | Presentation
Documentation | Presentation
27.11.2019
Documentation | Presentation
30.11.2019
Documentation| Presentation
II) VISUALIZATION
Visualization
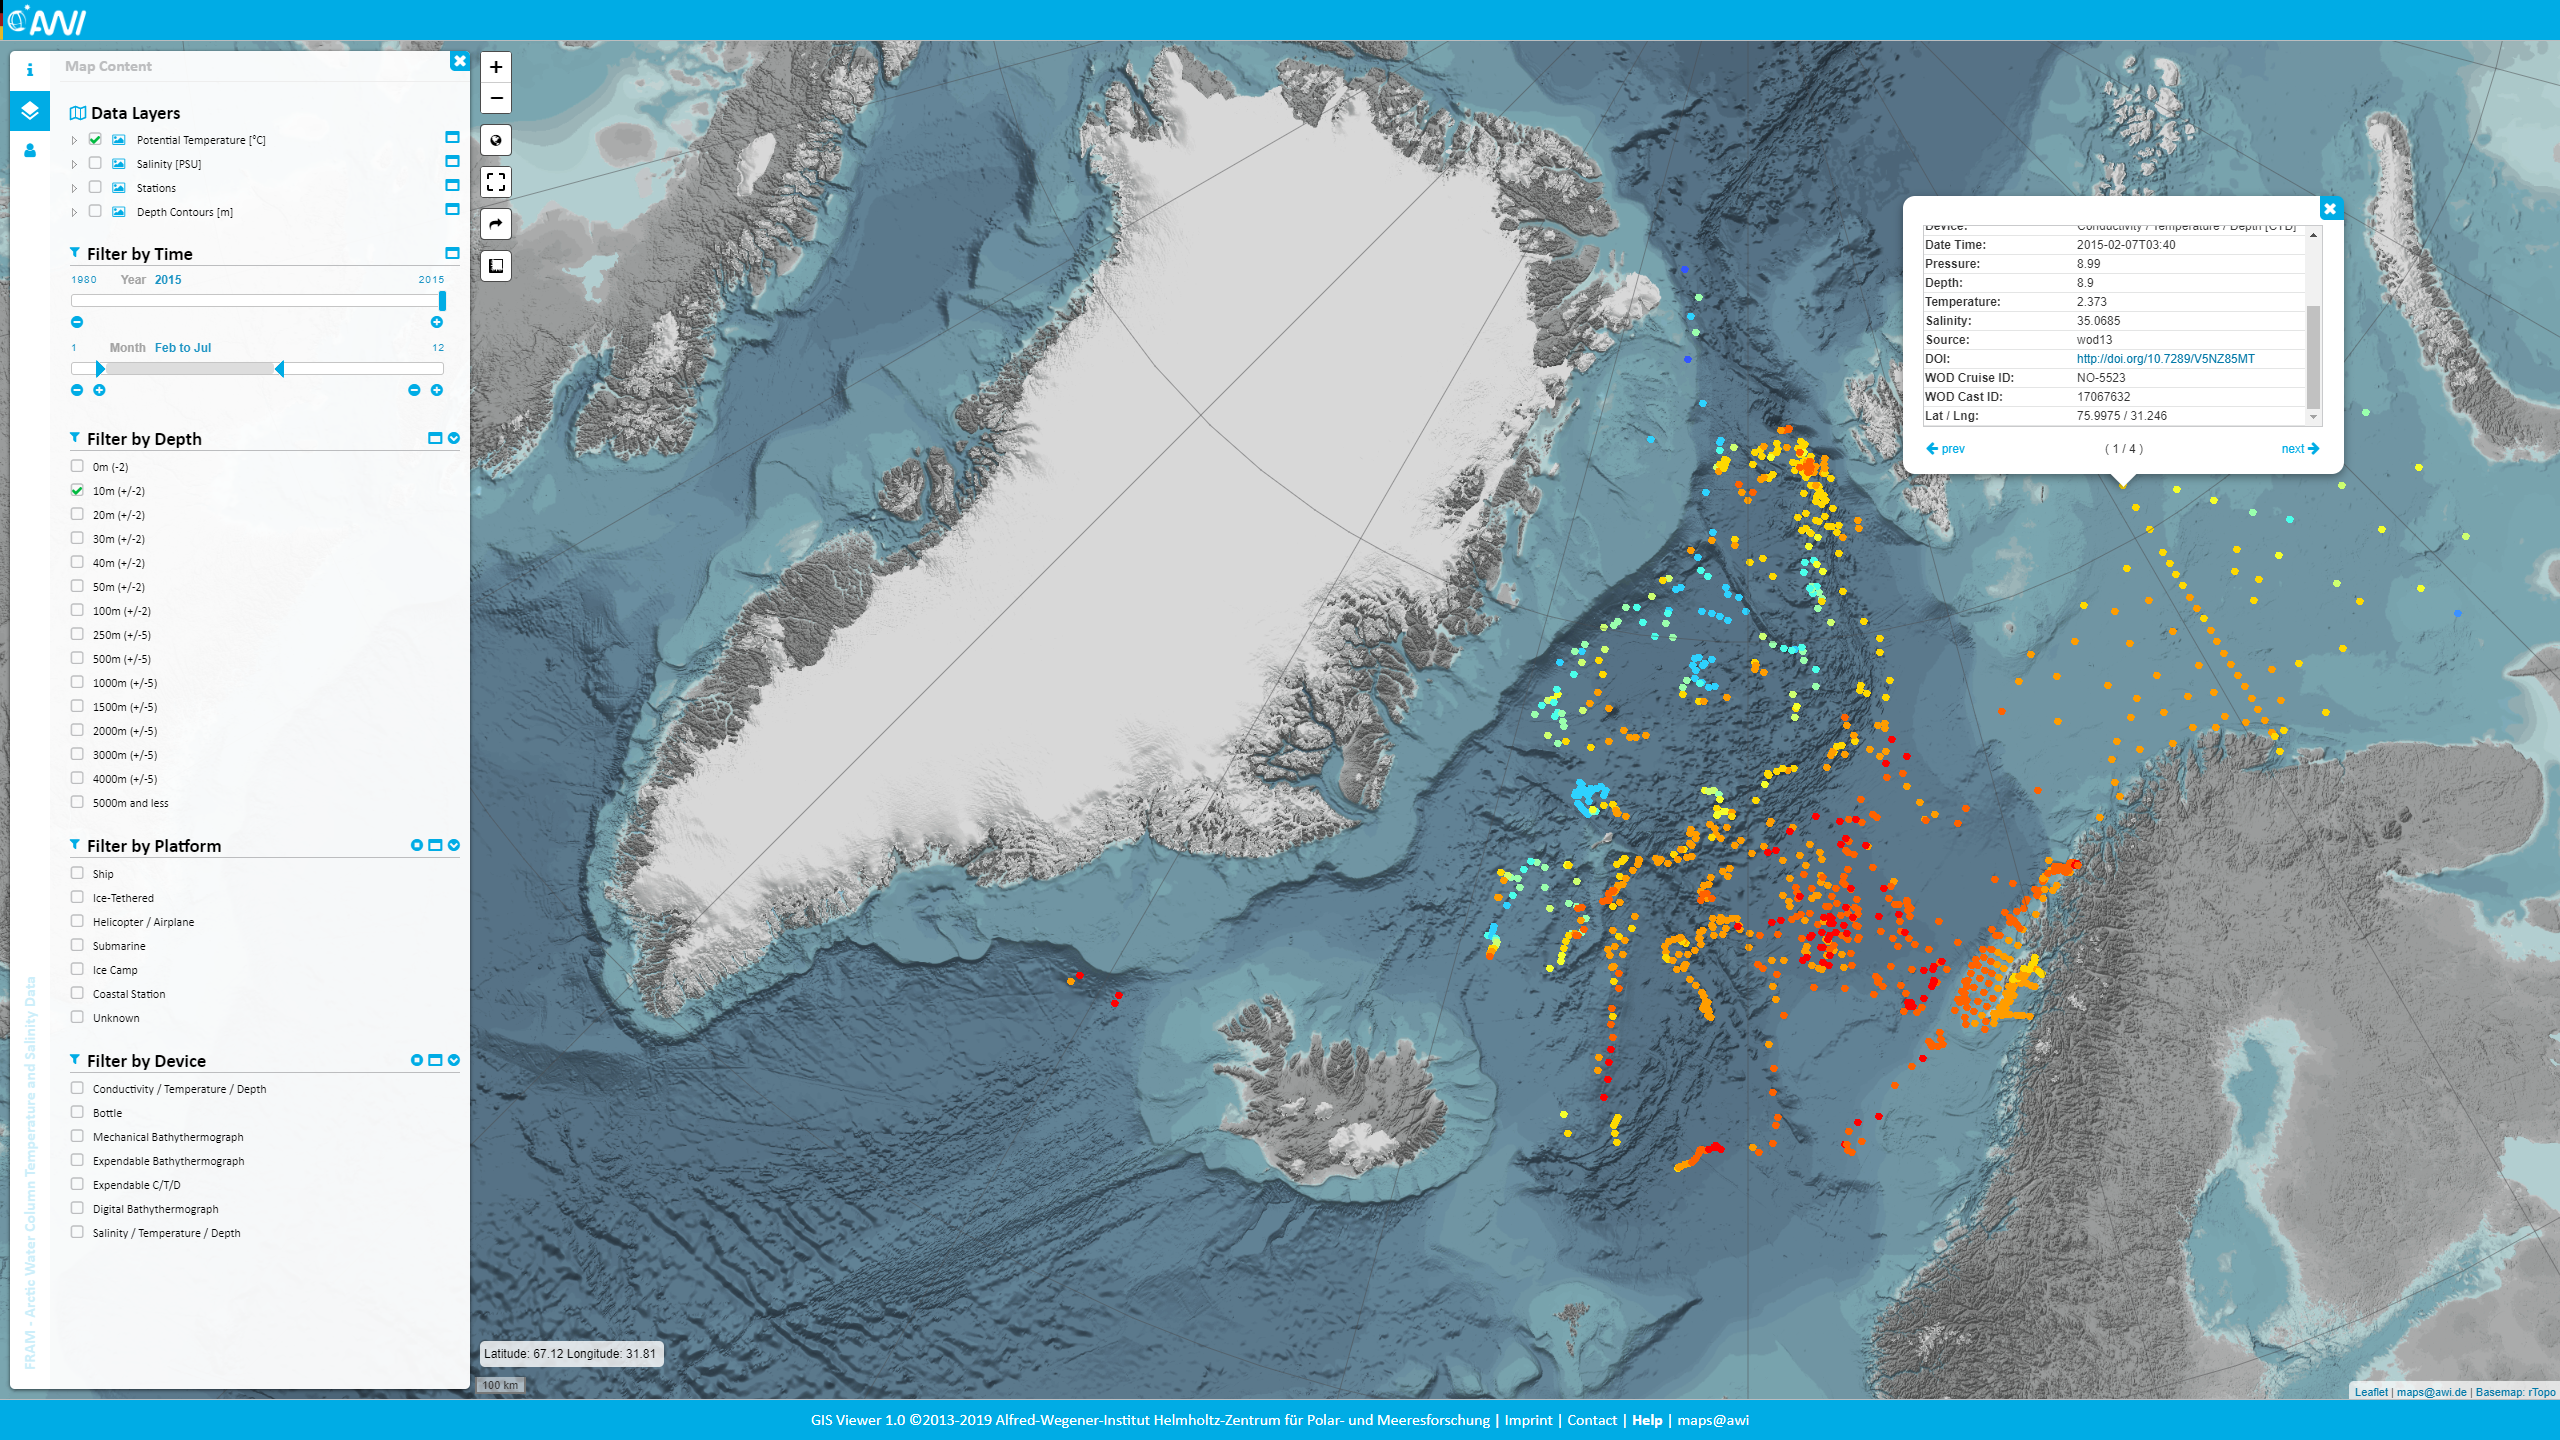
MAPS.awi.de lists scientific projects, that display scientific results as digital data services in a spatial context using webGIS technology. It provides
Browse by region and project
Search by keyword
Project specific abstracts + links to project related data viewers with comprehensive data products and complementary information
Re-use of layers in Desktop GIS Applications (e.g. ArcGIS, qGIS, ...), AWI data portal under "Collections" and DASHBOARD
Recommended Videos
| Widget Connector | ||||||
|---|---|---|---|---|---|---|
|
| Widget Connector | ||||||
|---|---|---|---|---|---|---|
|
Overview
Content Tools