Page History
I) PANGAEA
- 2D graph widgets depicting changes in a parameter with time; X-axis may also display another parameter instead ot time as variable
- Heatmap widgets depicting changes in a parameter with time and depth/altitute including contour plot option; ideal for displaying bupy and mooring data
- Map widgets including color-coded paramterts; ideal for displaying data from ship-mounted instruments
- Statistical analysis of selected parameter
- Direct data download
- Machine-friendly data access via REST interface
- User-friendly change of aggregation and display settings
- Re-use widgets across distinct dashboards
- Publishing of individual dashboards (opened to all)
- Sharing of individual dashboard within a group
repository for data and data products

PANGAEA.de supports:
Browse by discipline, project and region (map-based)
Search in all metadata fields
User-friendly data submission using a ticket system
Quality control of datasets prior to publishing
DOI minting including recommended citation
Tools for data access and visualization
Machine-to-machine access to data warehouse
Long-term data archival
Optional assignement of data collections
FAIR principles
Contact: info(at)pangaea.de
Related Links
|
|
Use cases data analytics
|
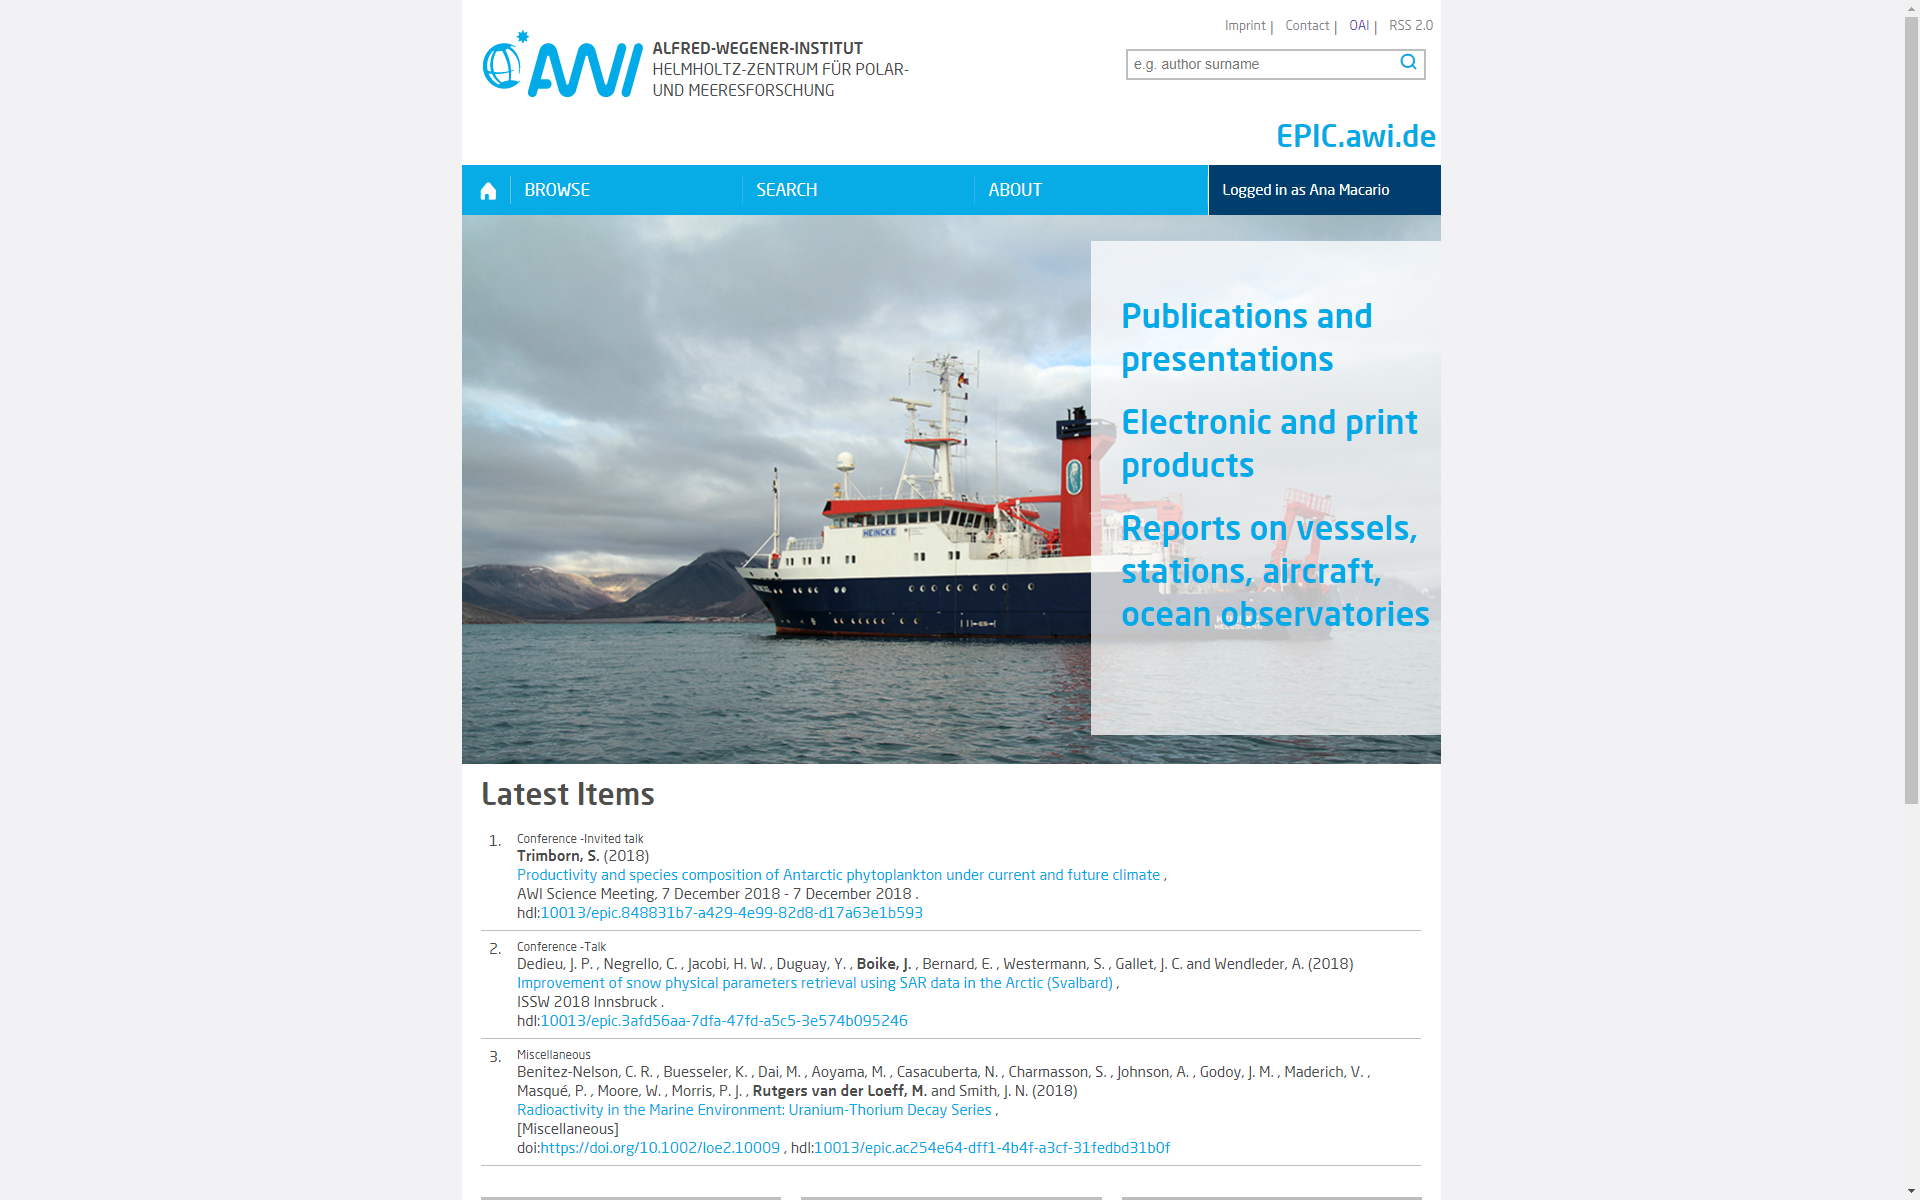
II) EPIC repository for publications and presentations
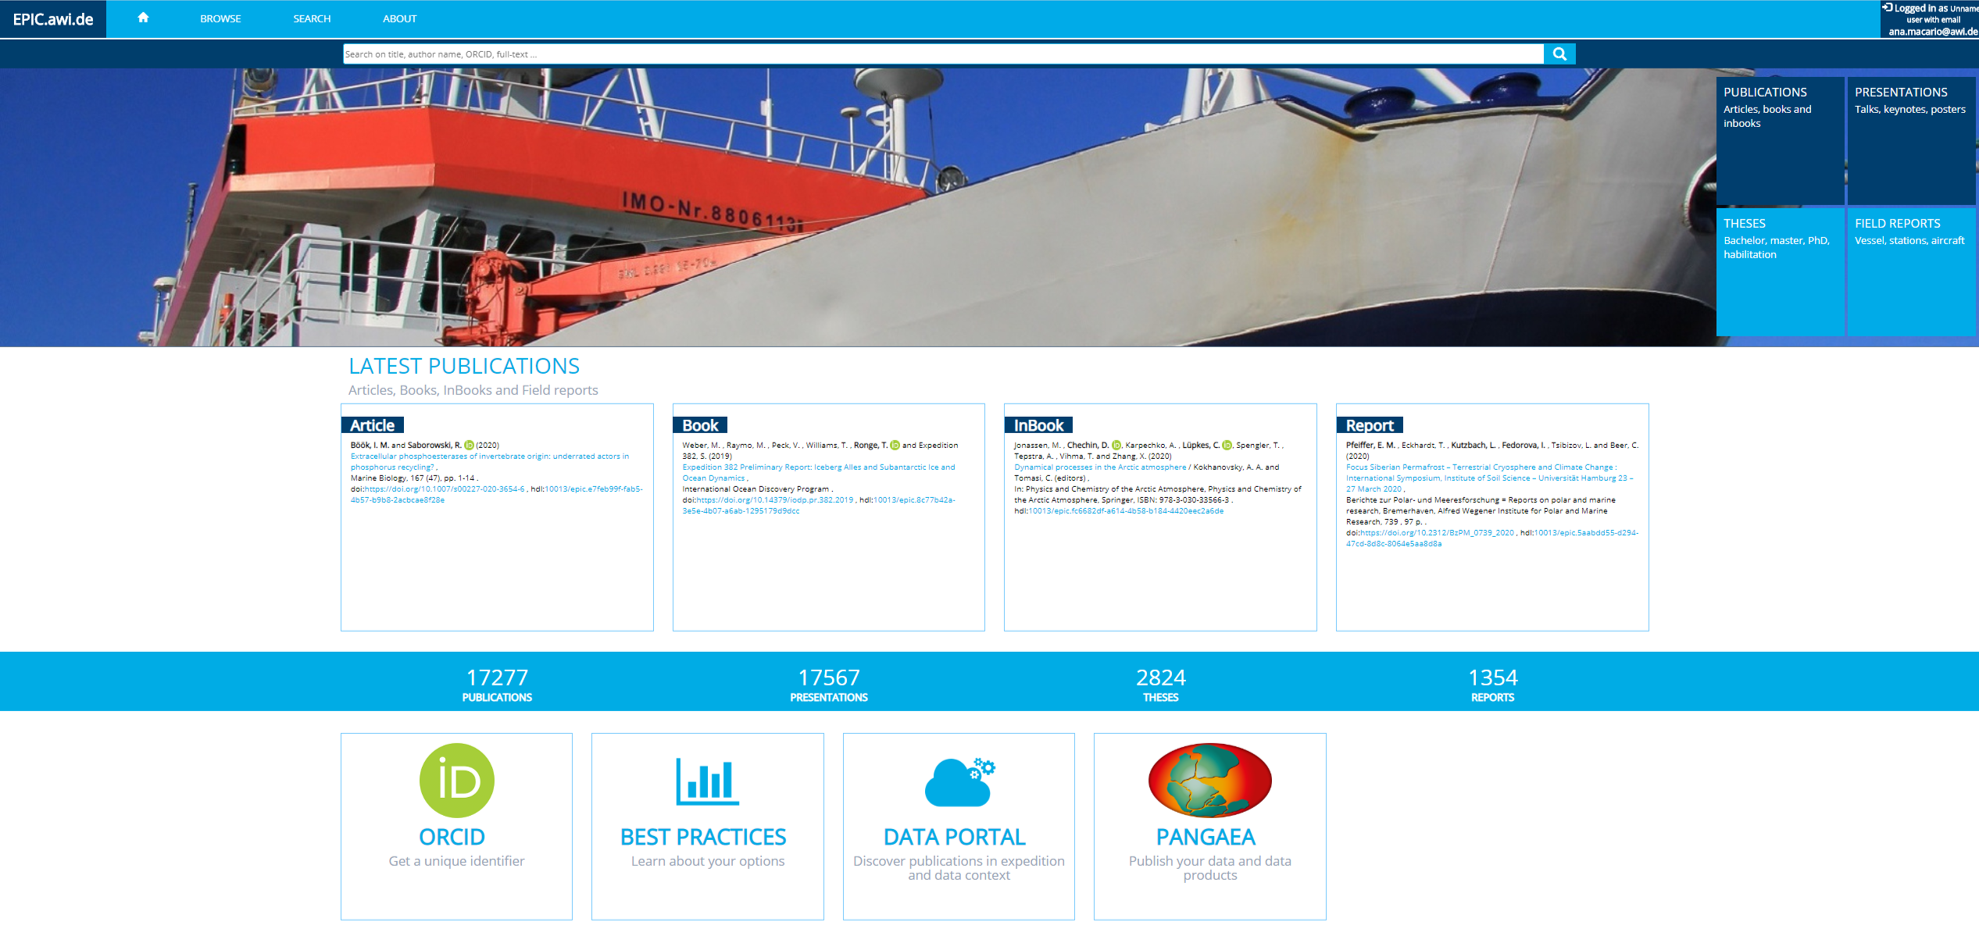
EPIC.awi.de supports:
Browse by item type, author, platform, organizational unit, etc
Search in all metadata fields including full-text
Archival of a large range of genre: from field reports to peer-reviewed articles
Handle minting for all items
Preservation of documents
Open access to full items: optional embargo for PDFs
Interoperability with openAIRE
Related Links
|

EPIC.awi.de is a repository for aims to display data streams for monitoring purposes. It supports:
- 2D graph widgets depicting changes in a parameter with time; X-axis may also display another parameter instead ot time as variable
- Heatmap widgets depicting changes in a parameter with time and depth/altitute including contour plot option; ideal for displaying bupy and mooring data
- Map widgets including color-coded paramterts; ideal for displaying data from ship-mounted instruments
- Statistical analysis of selected parameter
- Direct data download
- Machine-friendly data access via REST interface
- User-friendly change of aggregation and display settings
- Re-use widgets across distinct dashboards
- Publishing of individual dashboards (opened to all)
- Sharing of individual dashboard within a group
|
Overview
Content Tools