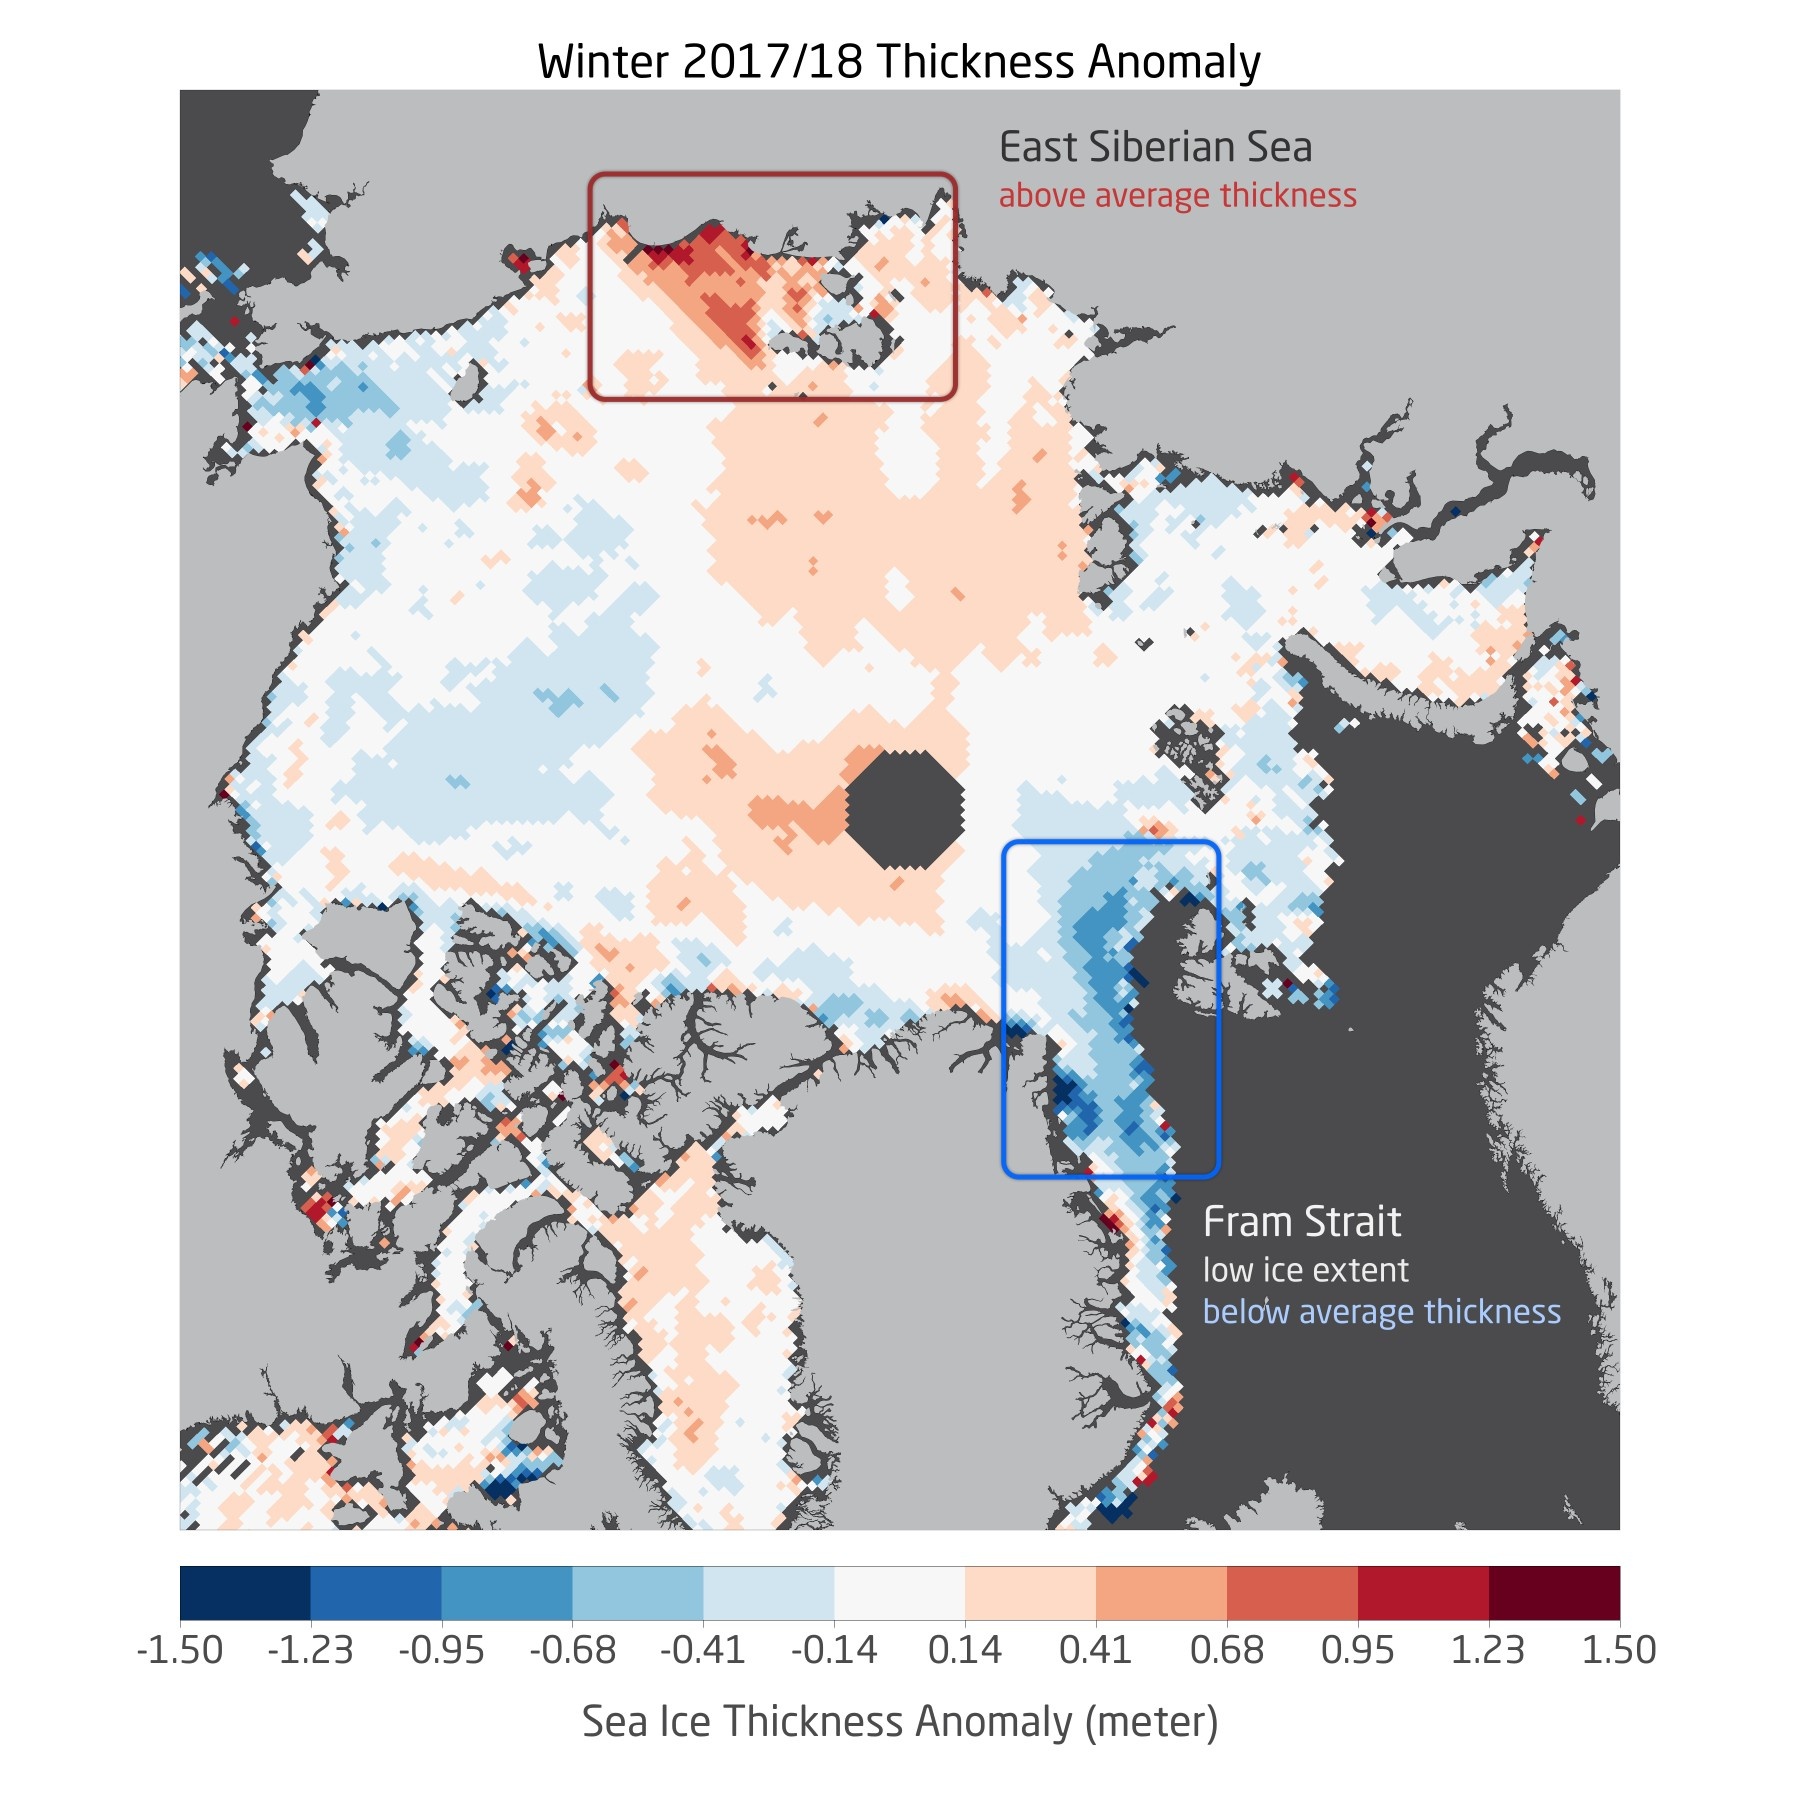
The latest results from CryoSat show that the latest extrema in winter sea ice maximum extent are not necessarily accompanied by a lower mean sea ice thickness of the remaining ice. One factor certainly is that sea ice thickness is a product of thermodynamic ice growth and the acummulated dynamic forces throughout the winter. As a first step in the investigation to what extent dynamic forces have played a role in the last winter, we compare winter mean anomalies of sea ice thickness and ice convergence derived from OSI-SAF data (figures below).
Visual inspection shows that there are two regions where above-average ice convergence and thickness seem to be correlated:
- East Siberian Sea
- Baffin Bay
It must be kept in mind that the convergence anomaly only shows which regions had higher rates of compression. In addition, the analysis is based on monthly mean convergence/divergence estimates, which might not provide an accurate representation on individual events. But the visual comparison can be a starting point for a more detailed physical analysis.
The winter mean thickness anomaly also indicates that regions that had anomalous low sea ice extent this winter (Fram Strait, Bering Sea) also have a negative ice thickness anomaly.
Winter mean sea ice thickness anomaly based on CryoSat-2 data from Oct. 2017 - Apr. 2018 compared to all previous winters (2010/11- 2016/17)
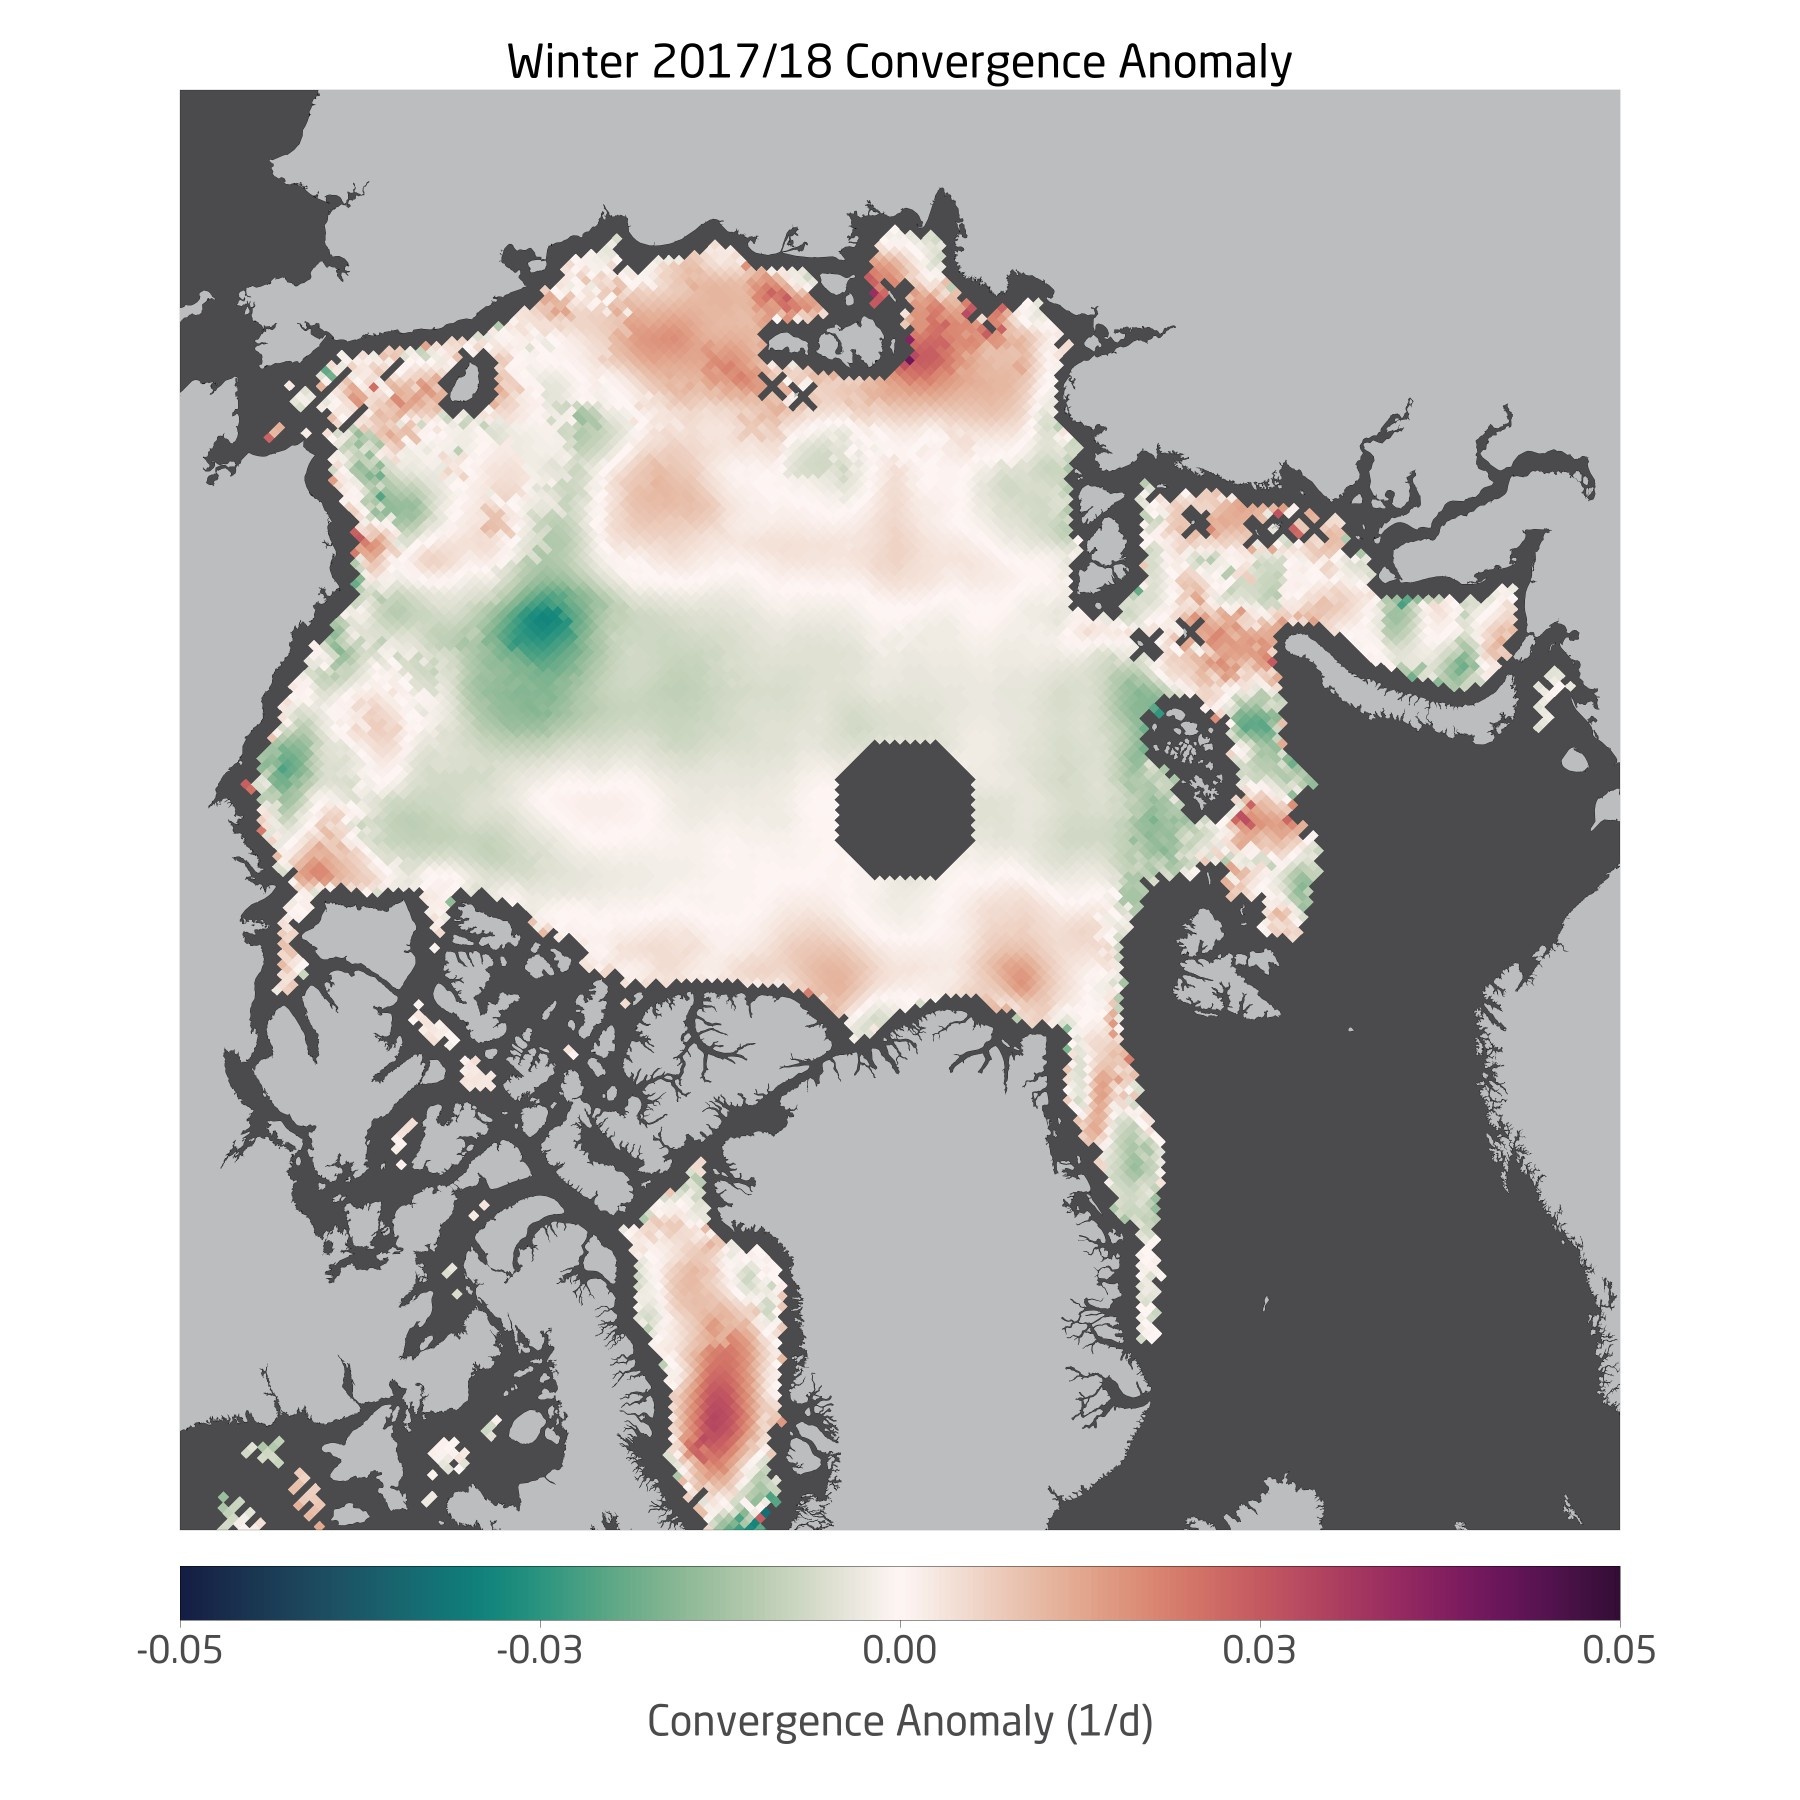
Corresponding ice convergence anomaly from OSI-SAF ice drift data
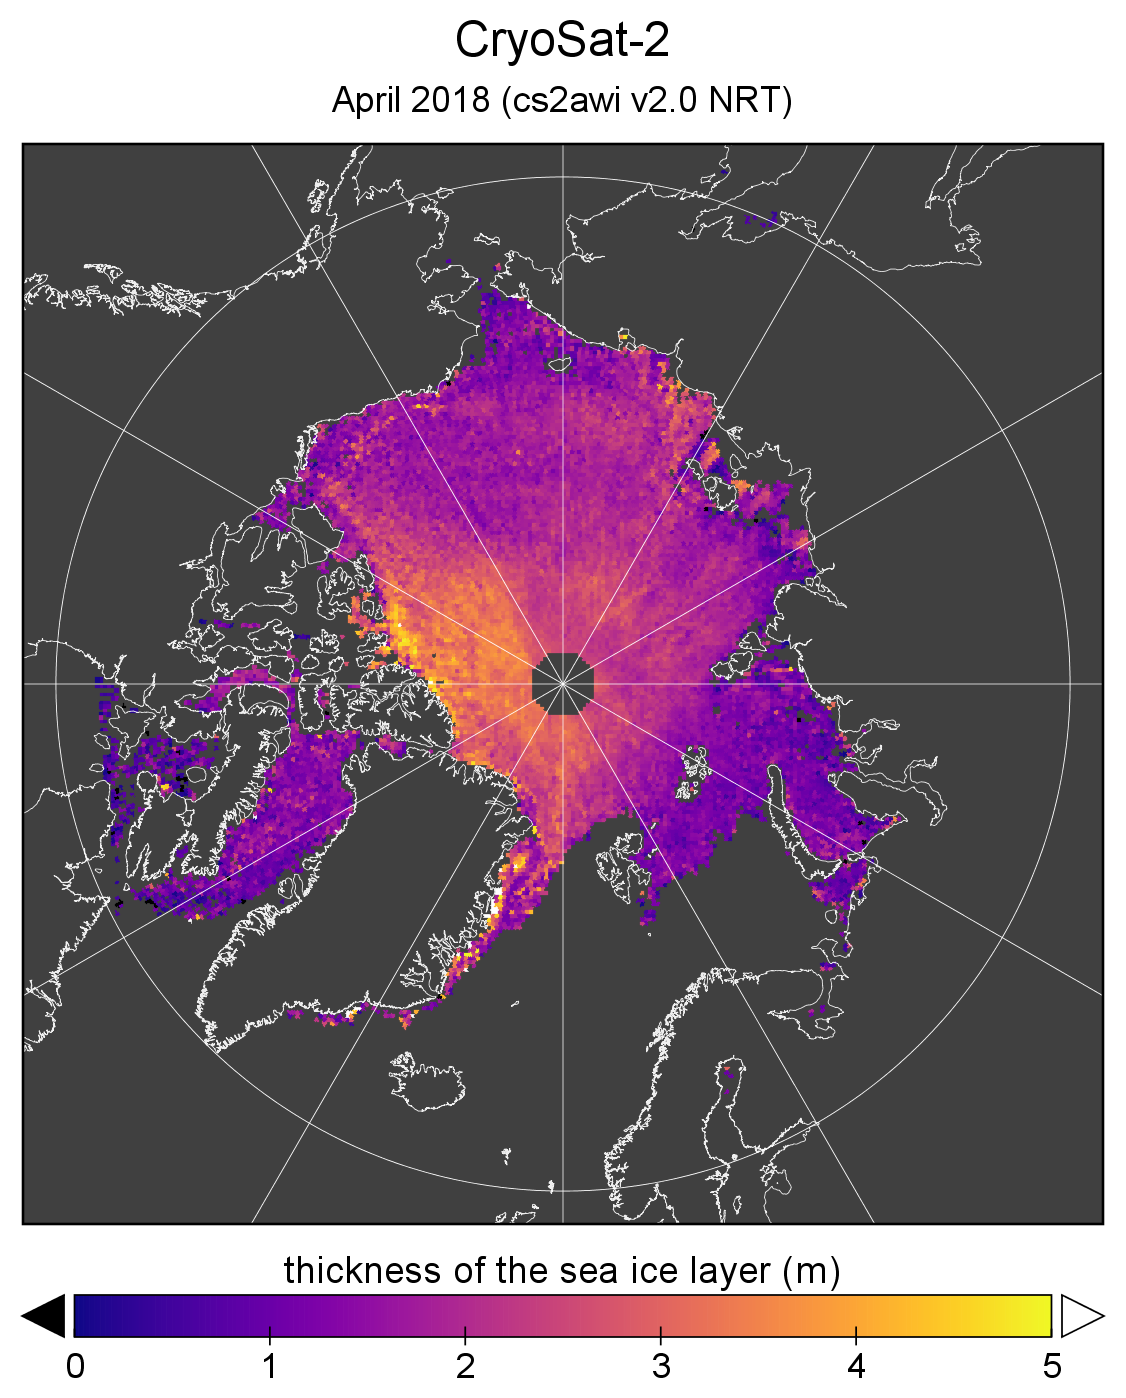
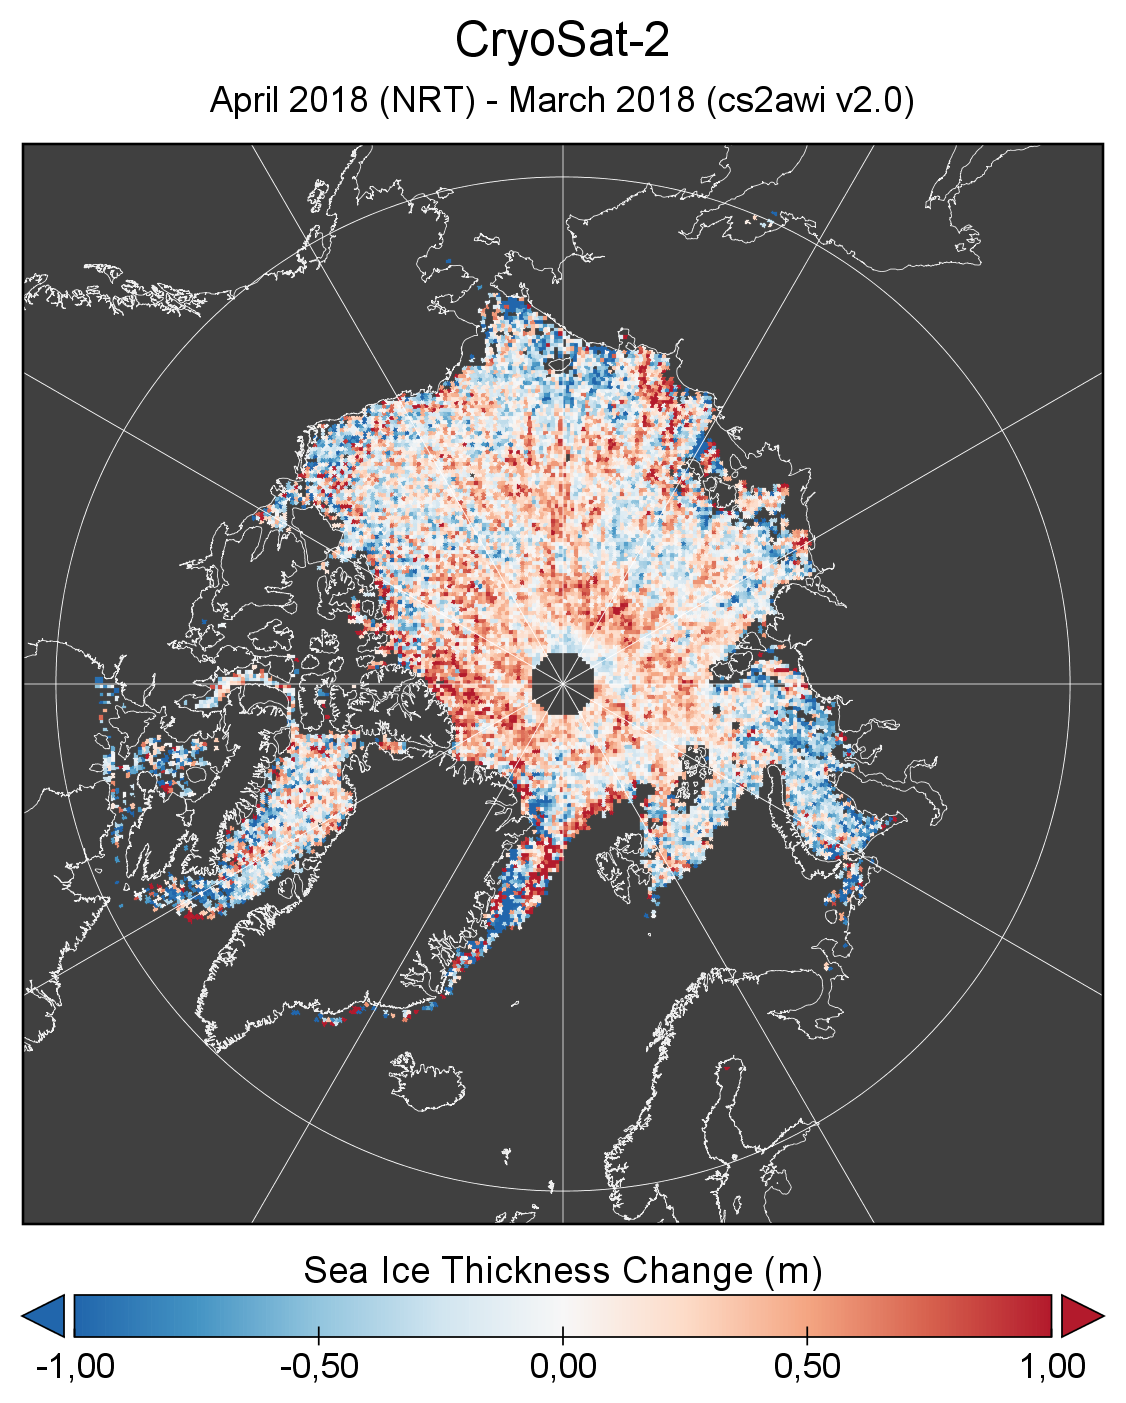
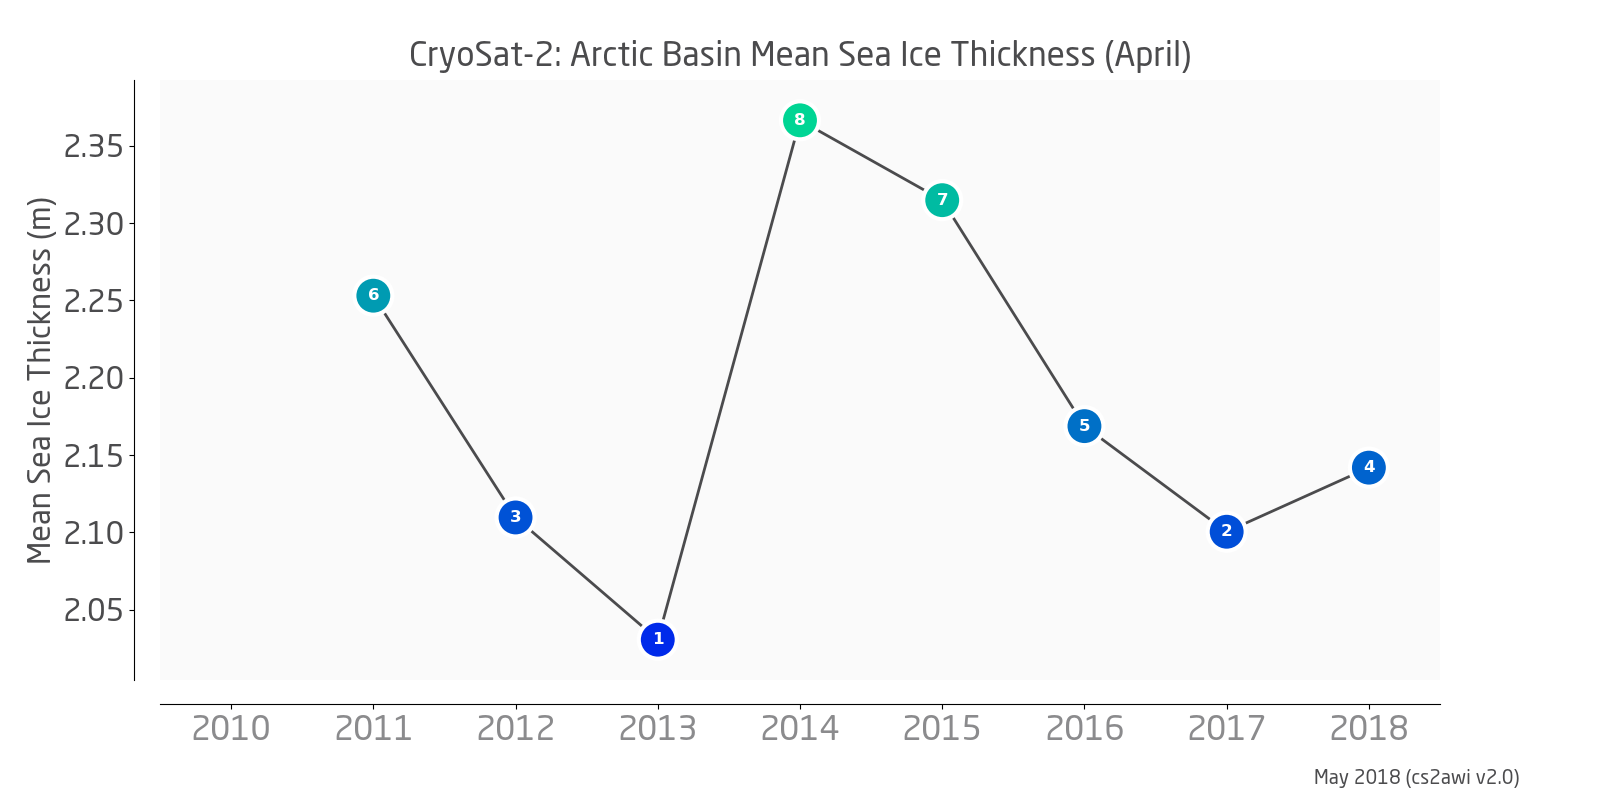
With monthly mean thickness in April 2018, the 8th Arctic winter season of 2017/2018 is now complete.
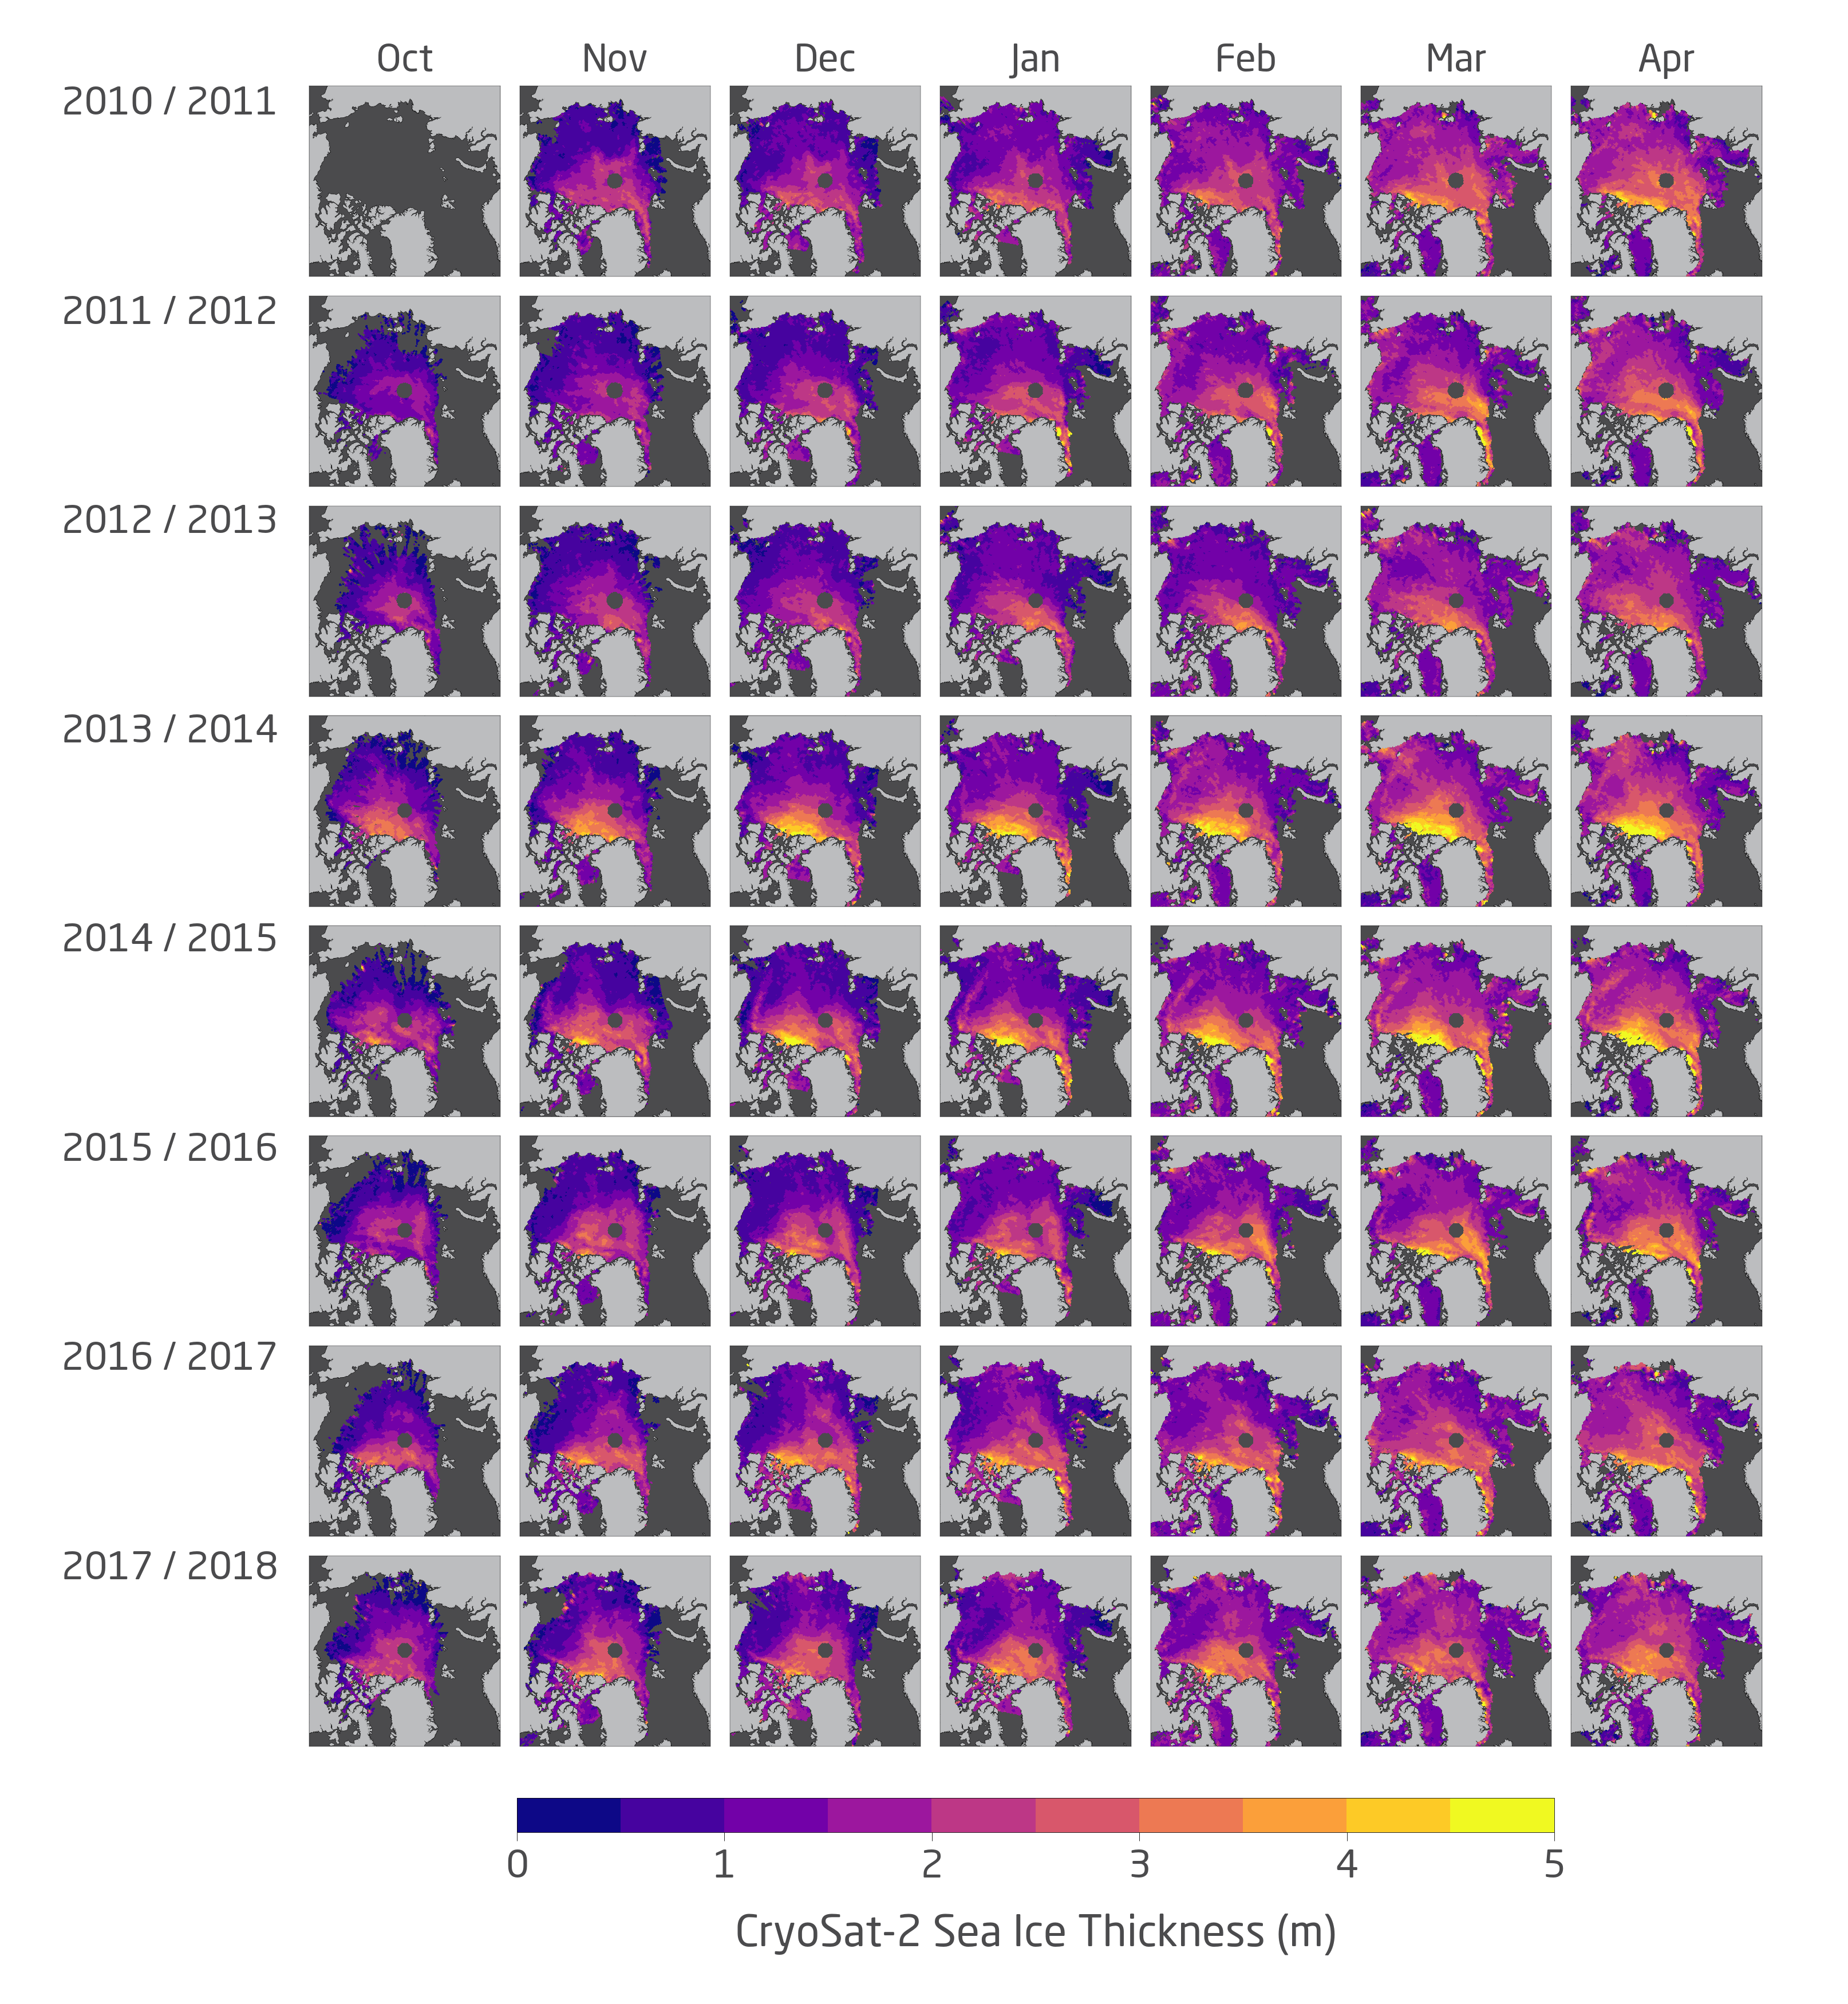
All monthly mean CryoSat-2 Arctic sea ice thickness fields
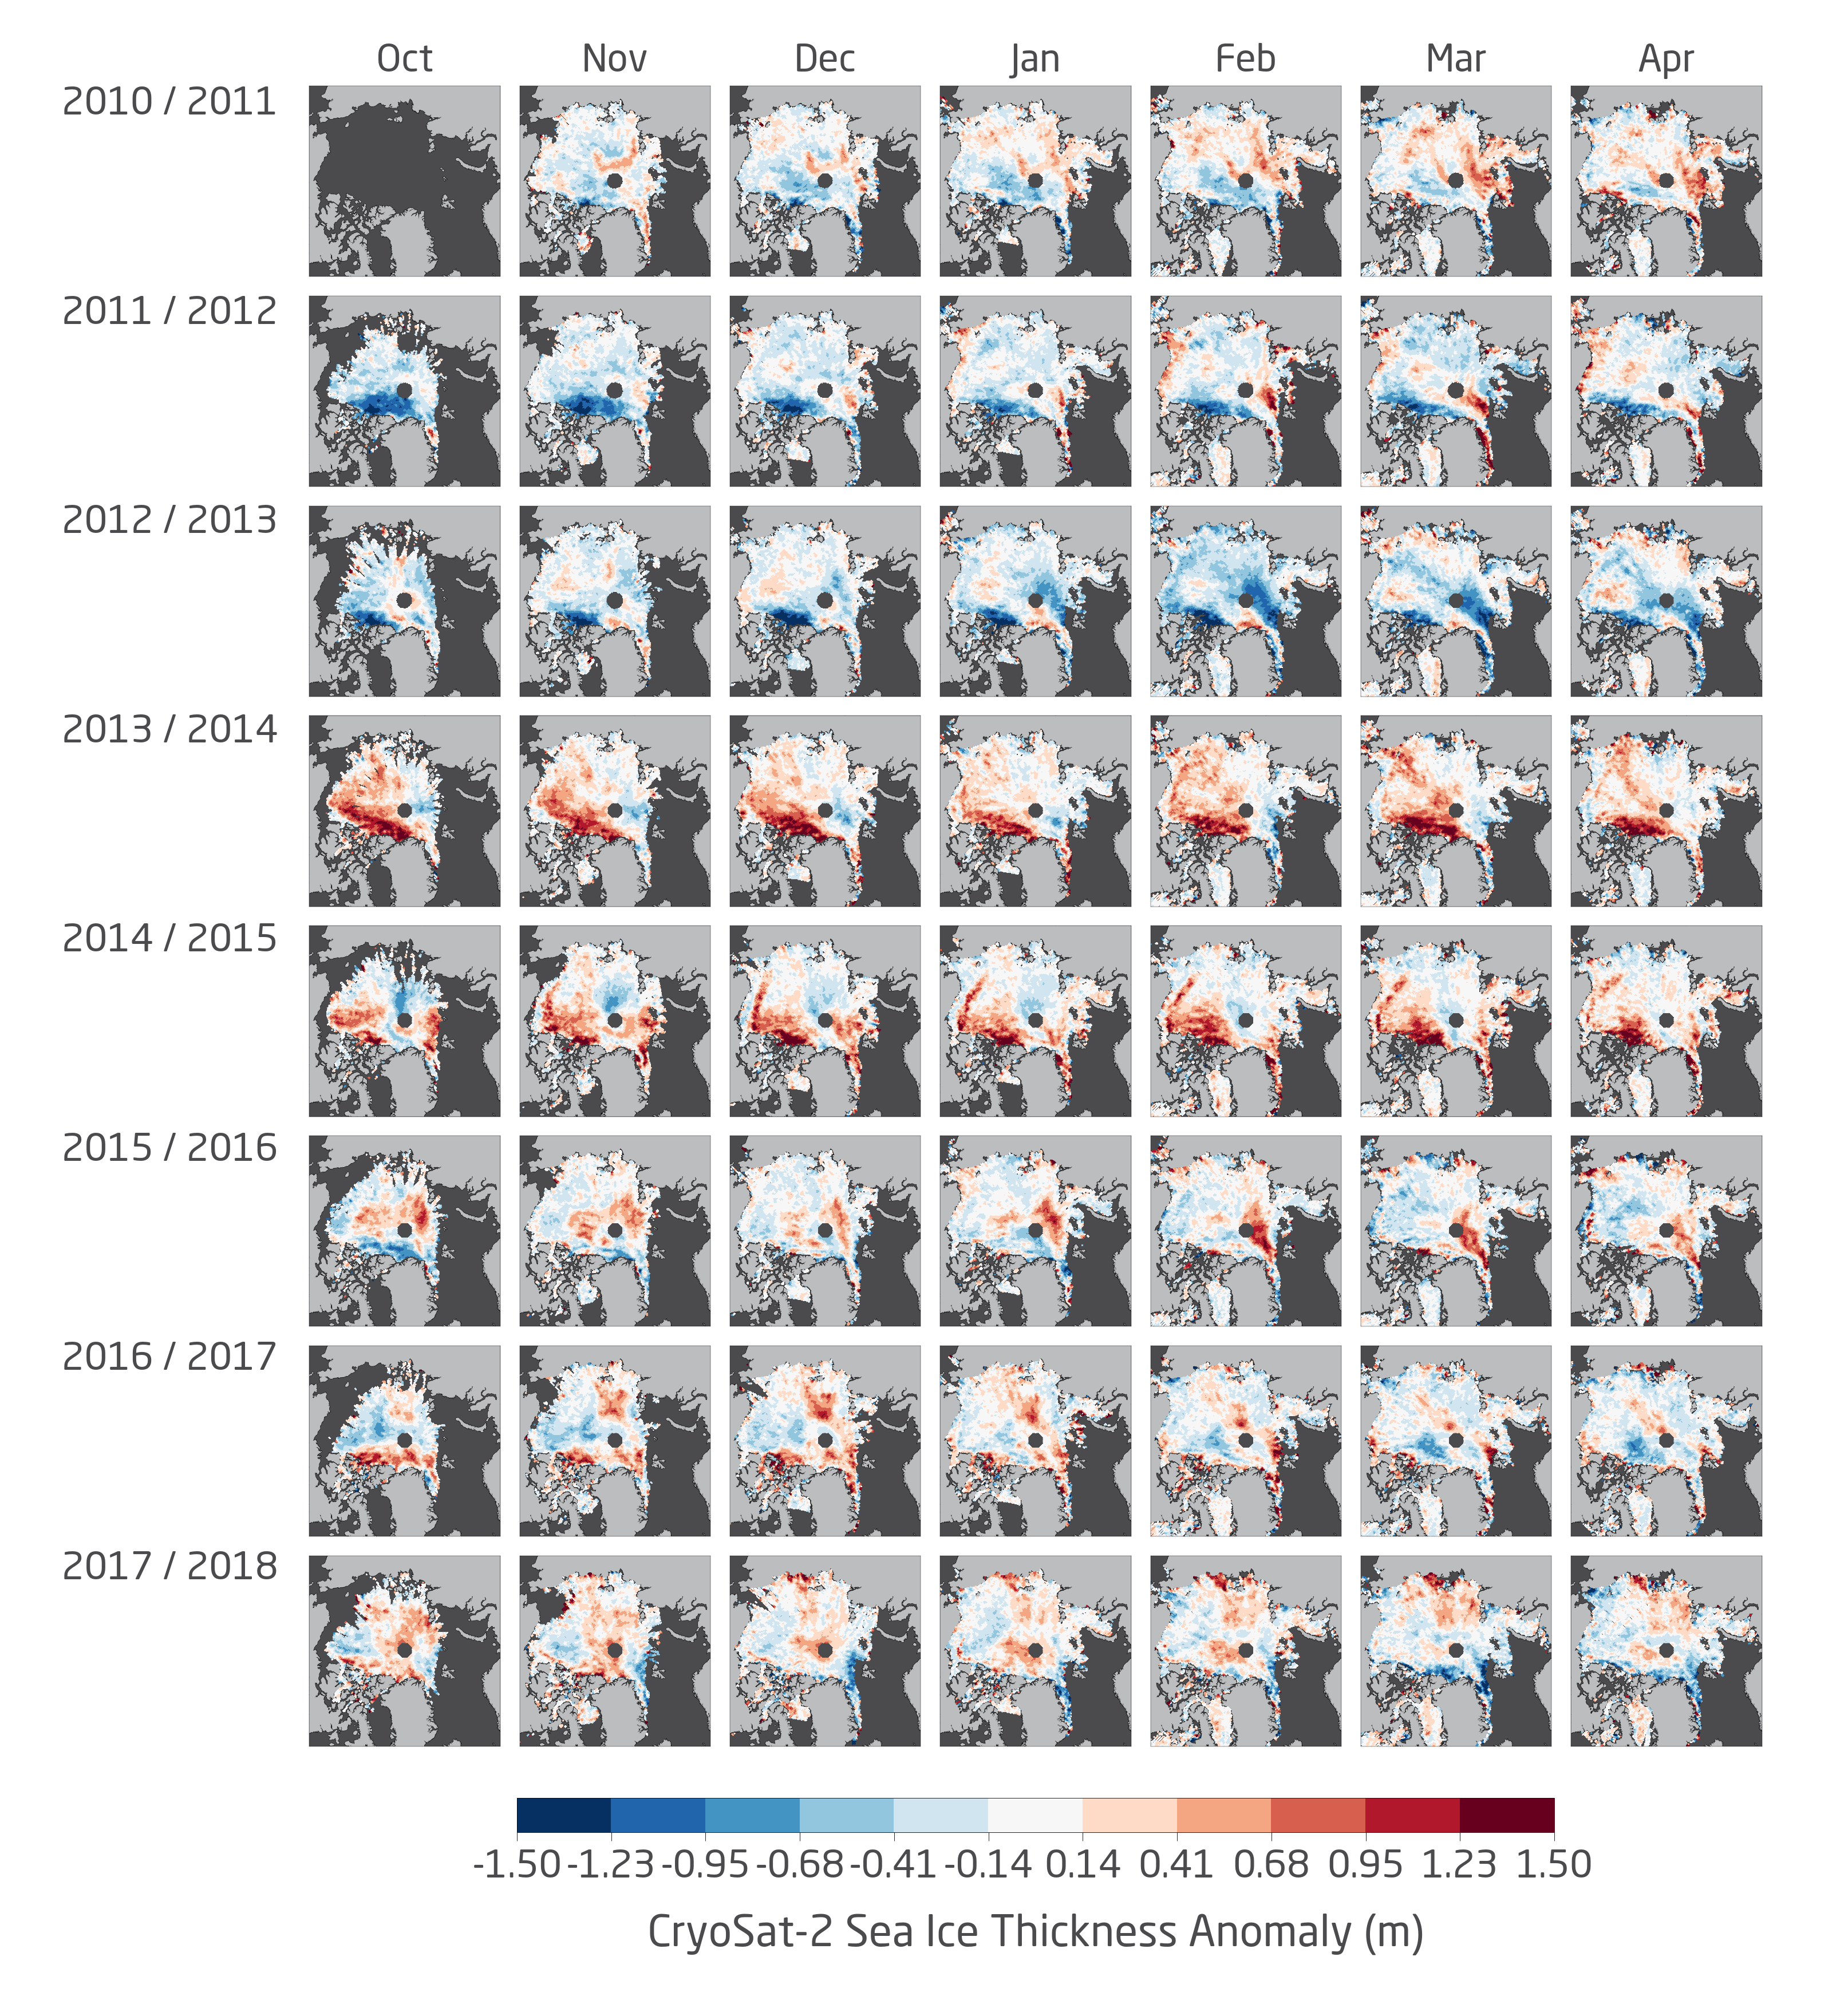
All monthly mean CryoSat-2 Arctic sea ice thickness anomaly fields
Arctic sea ice thickness information has been updated with NRT data for April 2018 and reprocessed data for March 2018. Daily, weekly and monthly products are available here: Reprocessed, Near-real time


Short Facts
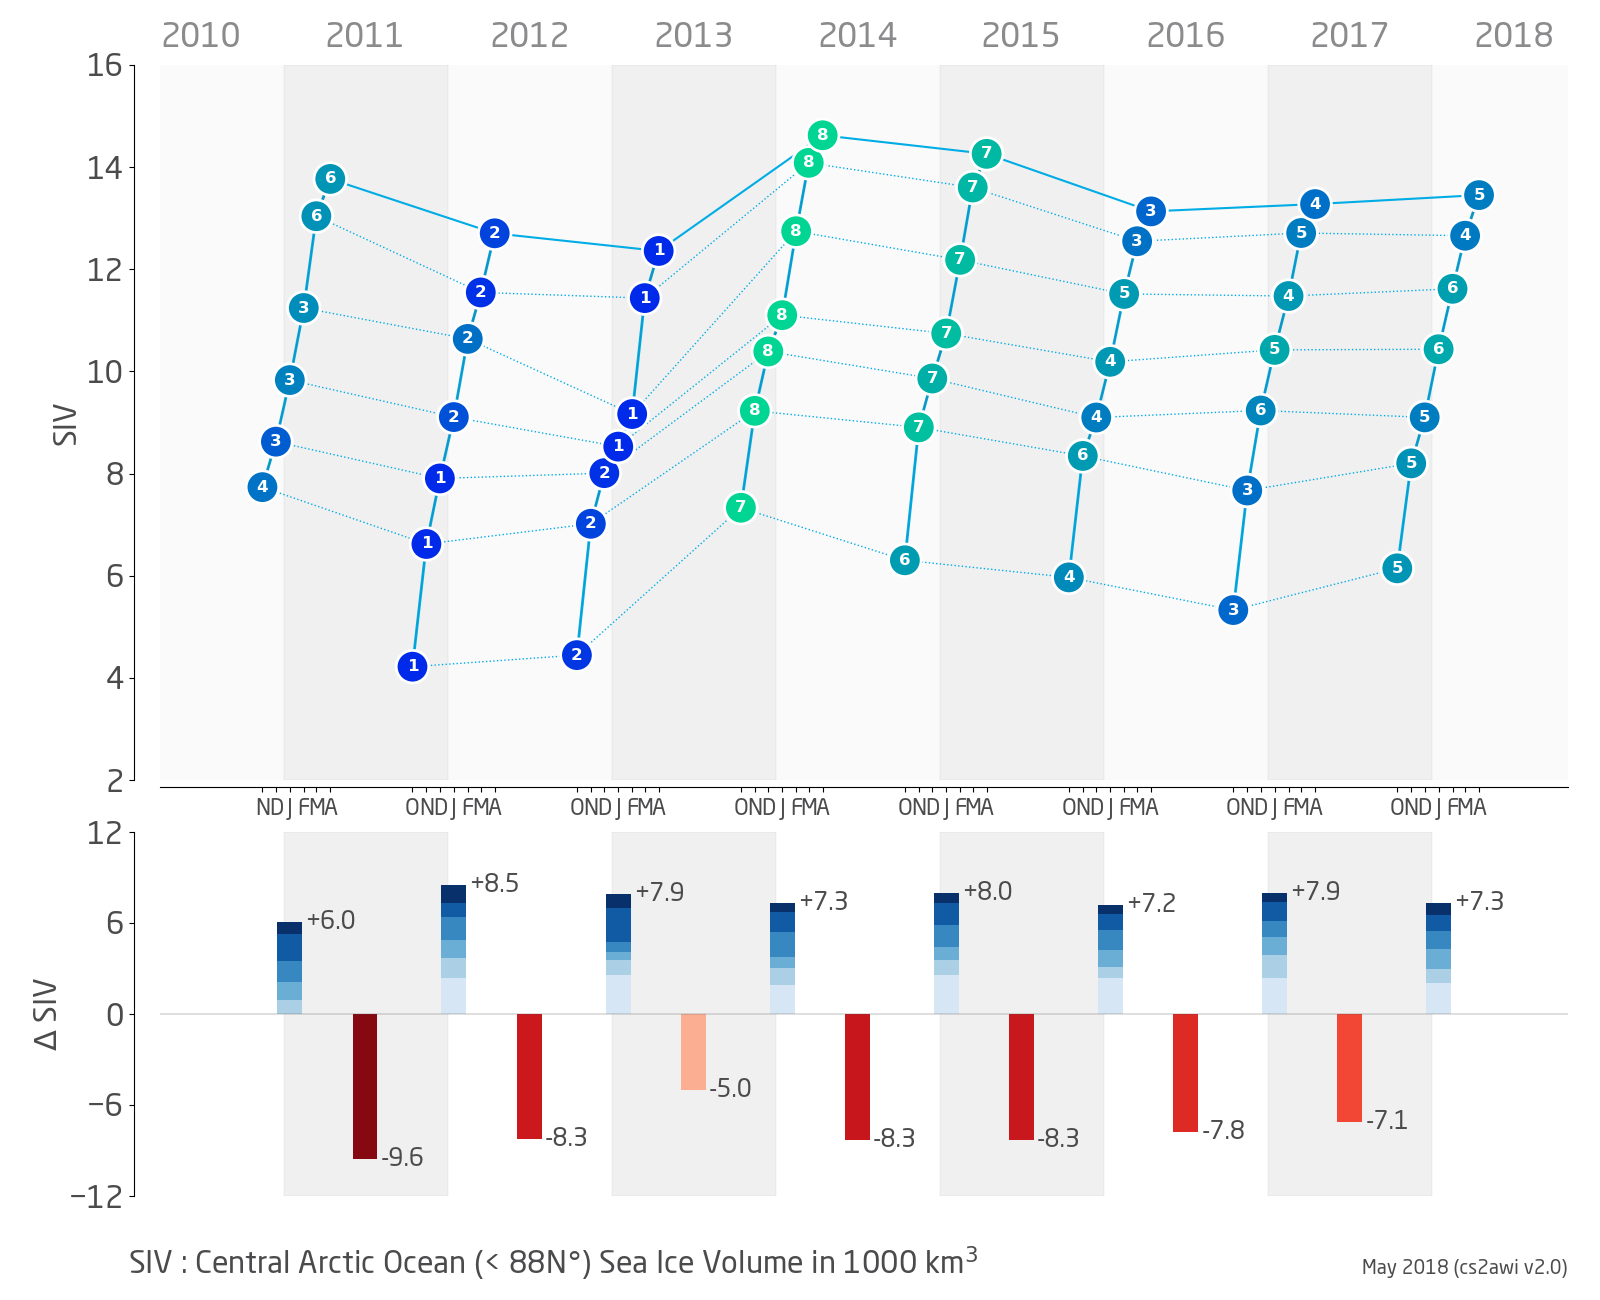
- April sea ice volume in the central Arctic was average (5th lowest / 4th highest) in 8 years of CryoSat-2 observations: 13.45 • 103 km3
- highest: 14.62 • 103 km3 in Apr 2014
- lowest: 12.36 • 103 km3 in Apr 2013
- average: 13.45 • 103 km3
- April mean sea ice thickness in the central Arctic was below average in 8 years of CryoSat-2 observations: 2.14 m
- highest: 2.29 m in Apr 2014
- lowest: 2.03 m in Apr 2013
- average: 2.19 m
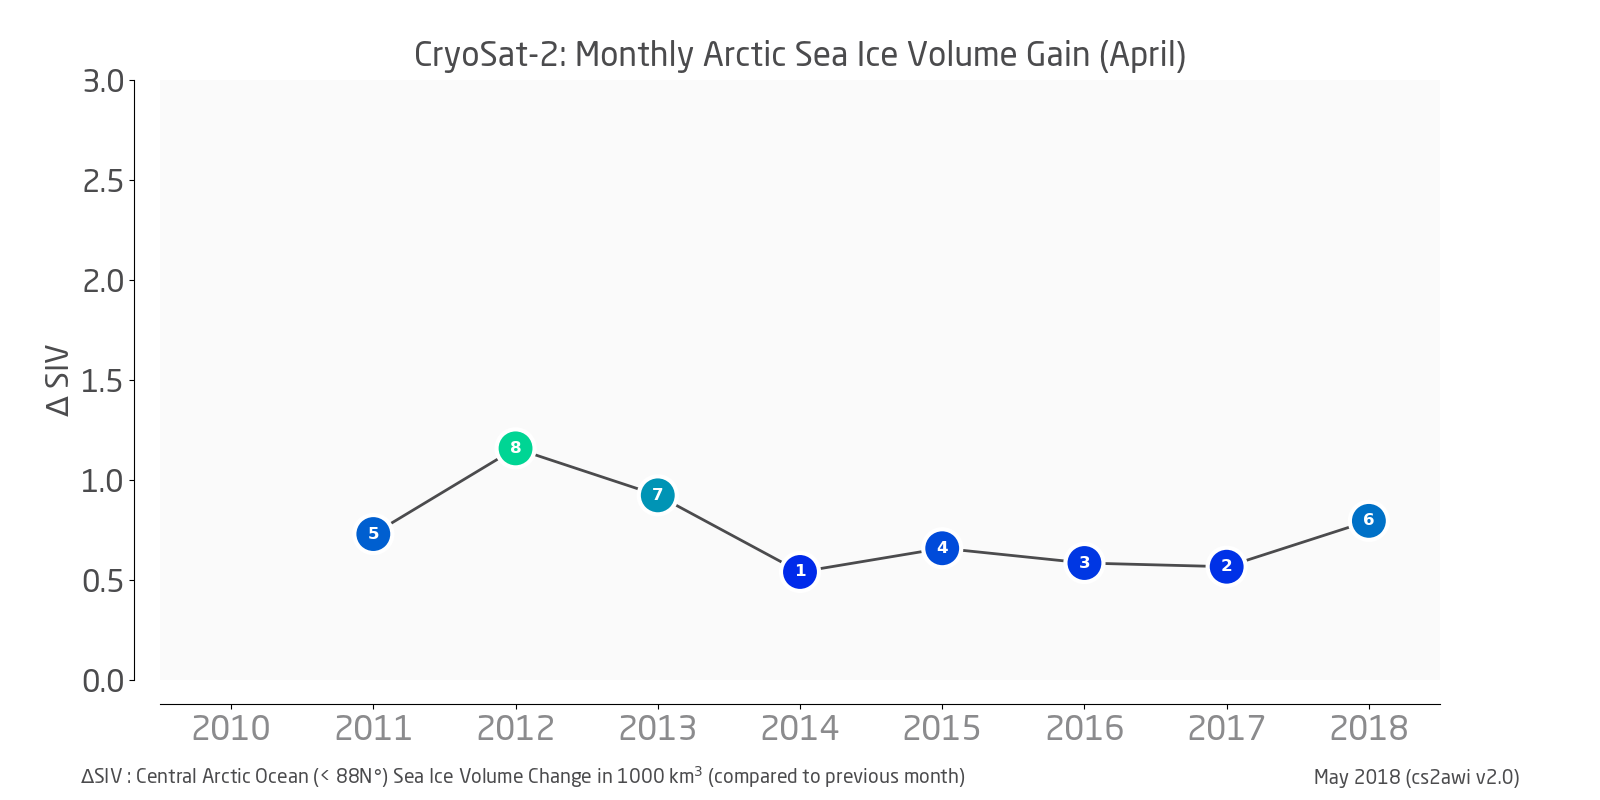
- Monthly sea ice volume gain (March through April) was above average in 8 years of CryoSat-2 observations: +0.80 • 103 km3
- highest: +1.16 • 103 km3 in Apr 2012
- lowest: +0.54 • 103 km3 in Apr 2014
- average: +0.74 • 103 km3
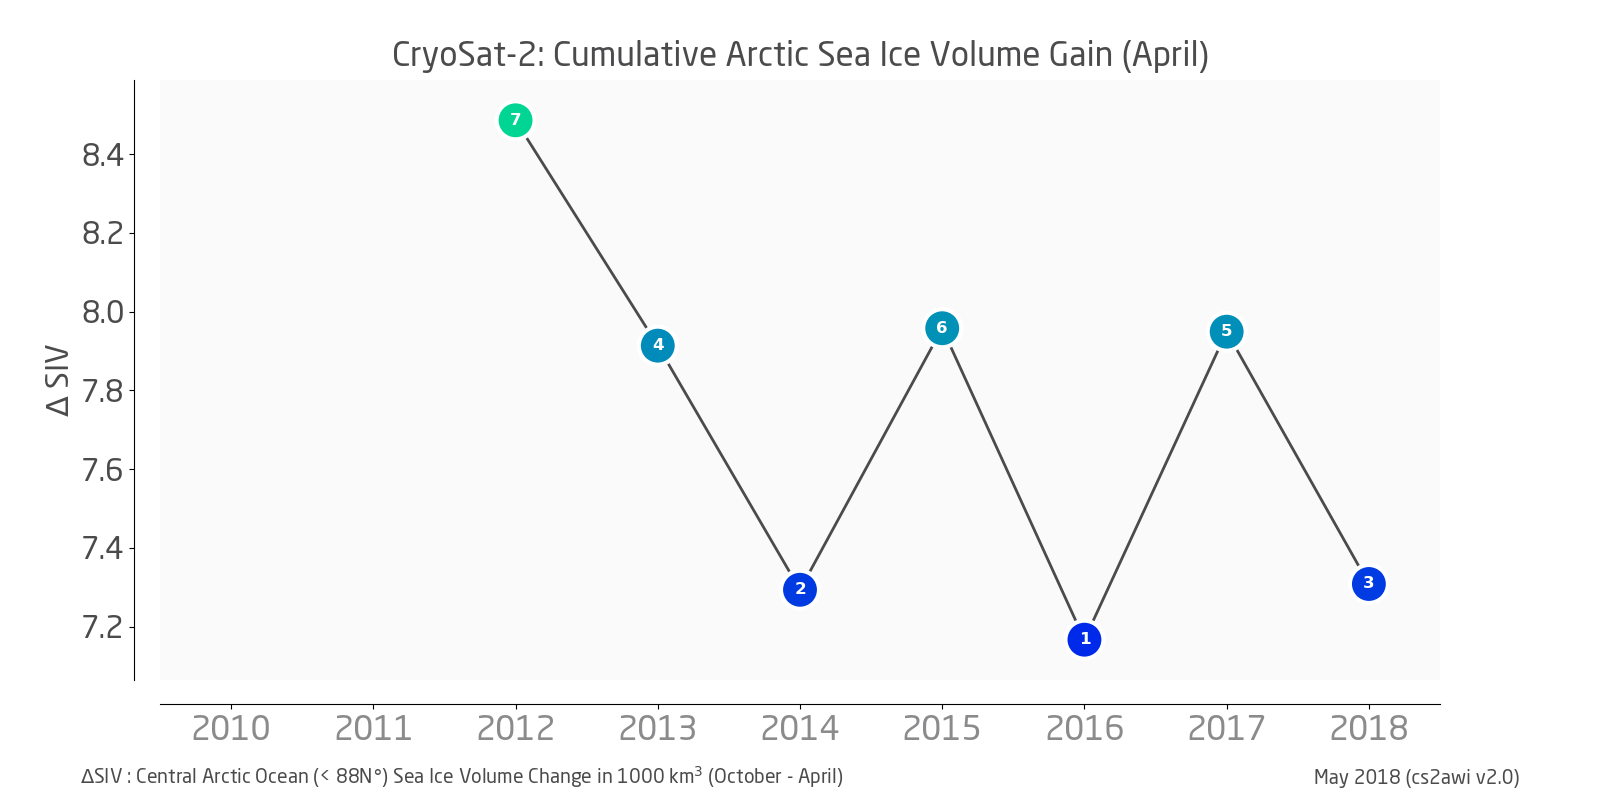
- Cummulative sea ice volume gain (October through April) was below average in 8 years of CryoSat-2 observations: +7.31 • 103 km3
- highest: +8.94 • 103 km3 in winter 2011/2012
- lowest: +7.17 • 103 km3 in winter 2015/2016
- average: +7.73 • 103 km3
All attachments are available under CC BY 4.0 license. Please cite with "Stefan Hendricks & Robert Ricker, Alfred Wegener Institute"